A Closer Look at 2023 Fund Flows
With 2023 in the rearview, we decided to take a look at some prevalent fund flow trends from 2023, including flows into money market funds, Passive vs. Active (vs smart beta) ETF flows, the exodus from mutual funds, and more.
For a more nuanced look at the quarter’s flows, sign up for a copy of our Fund Flows Report and Visual Deck (clients only):If you want to learn more about 2023 fund flows, check out a replay from YCharts’ institutional team’s detailed conversation:
2023: The Year Money Market Funds Re-Emerged
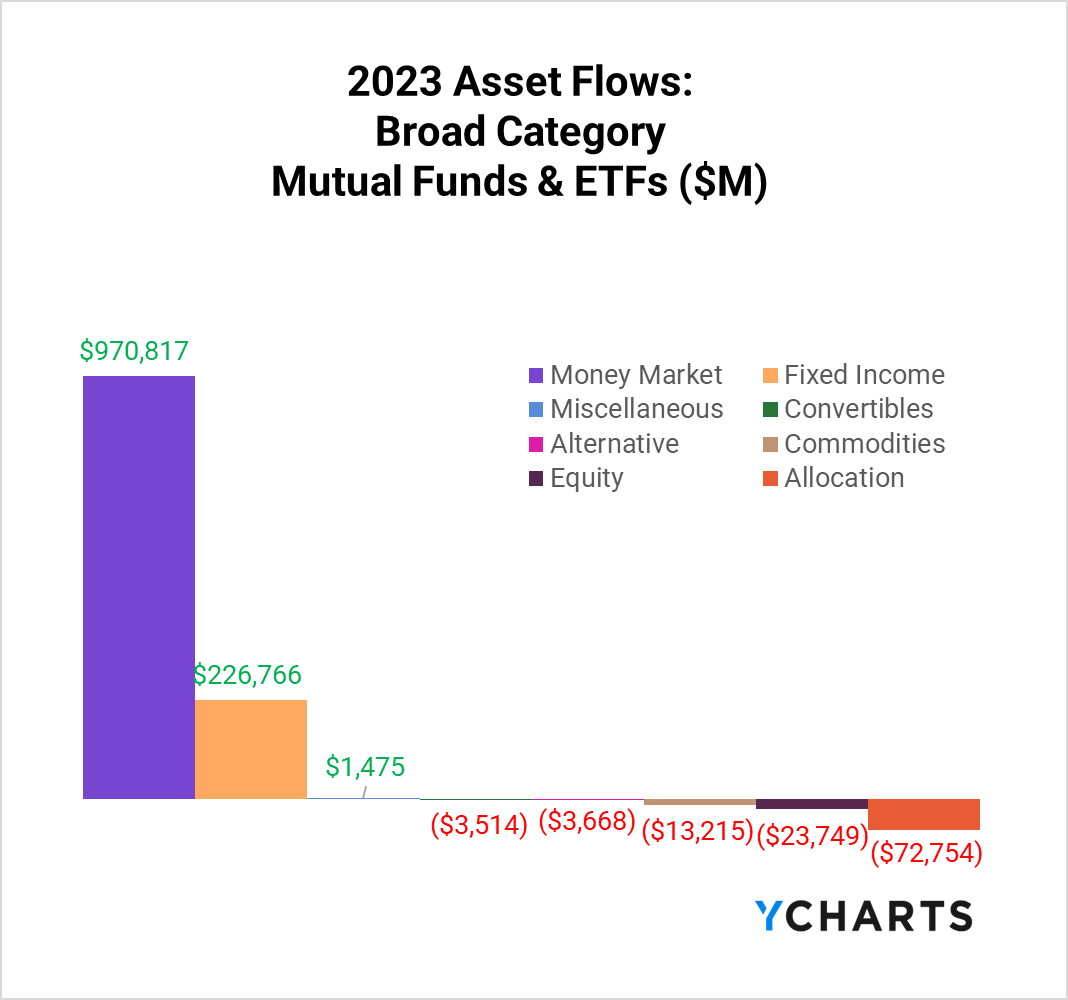
Unquestionably, the asset class that benefited the most from the Federal Reserve’s rate hikes over the past two years was money market funds. In 2023, these funds attracted over $970 billion in assets.
2023 flows accounted for over a quarter of total assets in six of the ten most attractive money market funds in 2023.
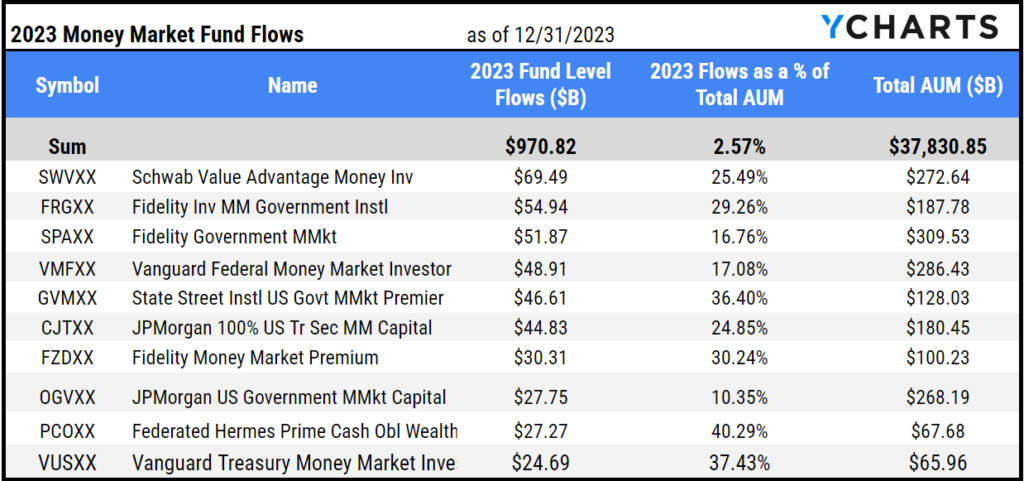
View the Full Comp Table in YCharts
In 2024, asset managers will need to convince investors and advisors that their strategies are the best choice for any assets coming off the sideline.
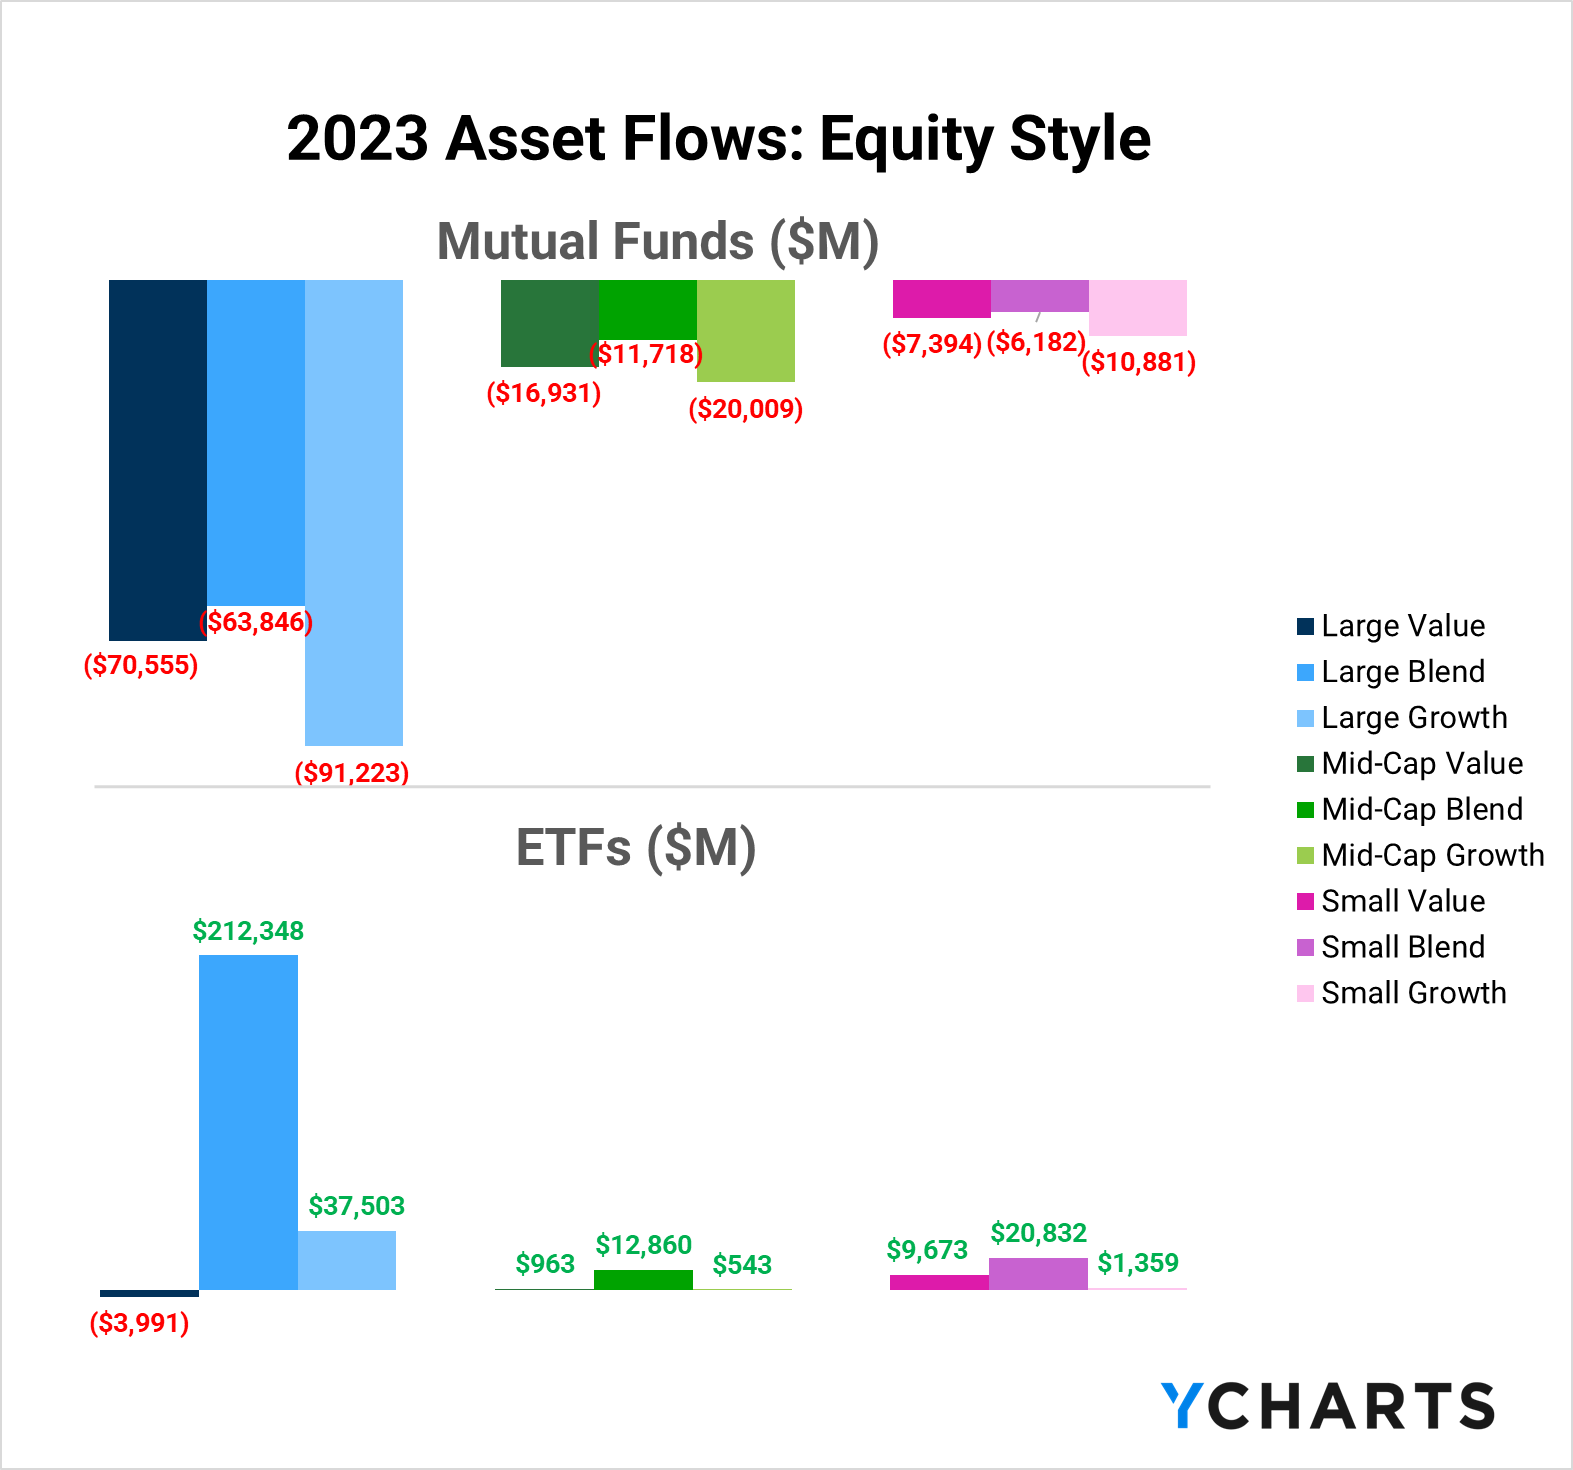
ETFs Continue To Make Strides vs Mutual Funds
Based on 2023’s flow trend, it seems that if any assets return into equities, ETFs would be poised to assume those flows.
Last year, ETFs saw net-positive flows in 8 of the nine equity-style boxes. Meanwhile, Mutual Funds saw net-negative flows across all style boxes.
So, what’s been driving the inflows in ETFs?
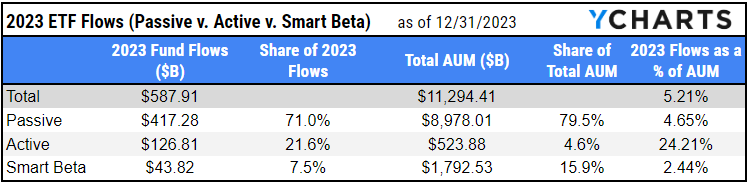
Passive Vs Active ETFs in 2023
In 2023, another revealing trend emerged, as active ETFs punched above their weight class when attracting assets. Despite making up less than 5% of total ETF AUM, active ETFs accounted for 21.6% of inflows in 2023.
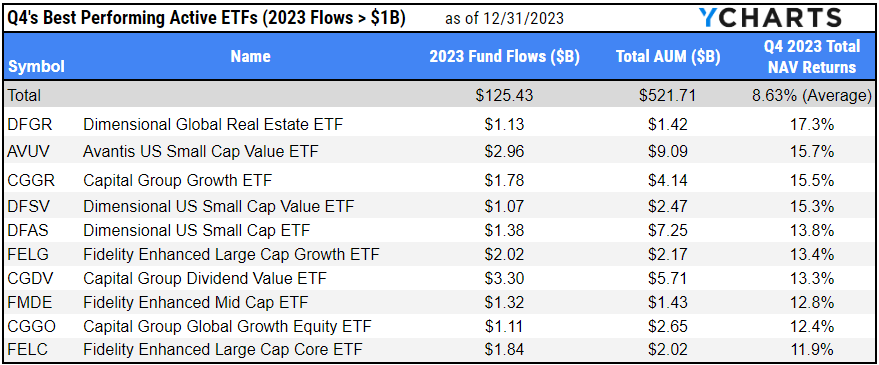
Some of the active ETFs that brought in over $1B in assets and ended the year on a high note were Dimensional Global Real Estate ETF (DFGR), Avantis US Small Cap Value ETF (AVUV), and Capital Group Growth ETF (CGGR), which had respective NAV returns of 17.3%, 15.7%, and 15.5% in Q4.
View the Full Comp Table in YCharts
Which ETFs Found Success in Attracting Assets in 2023
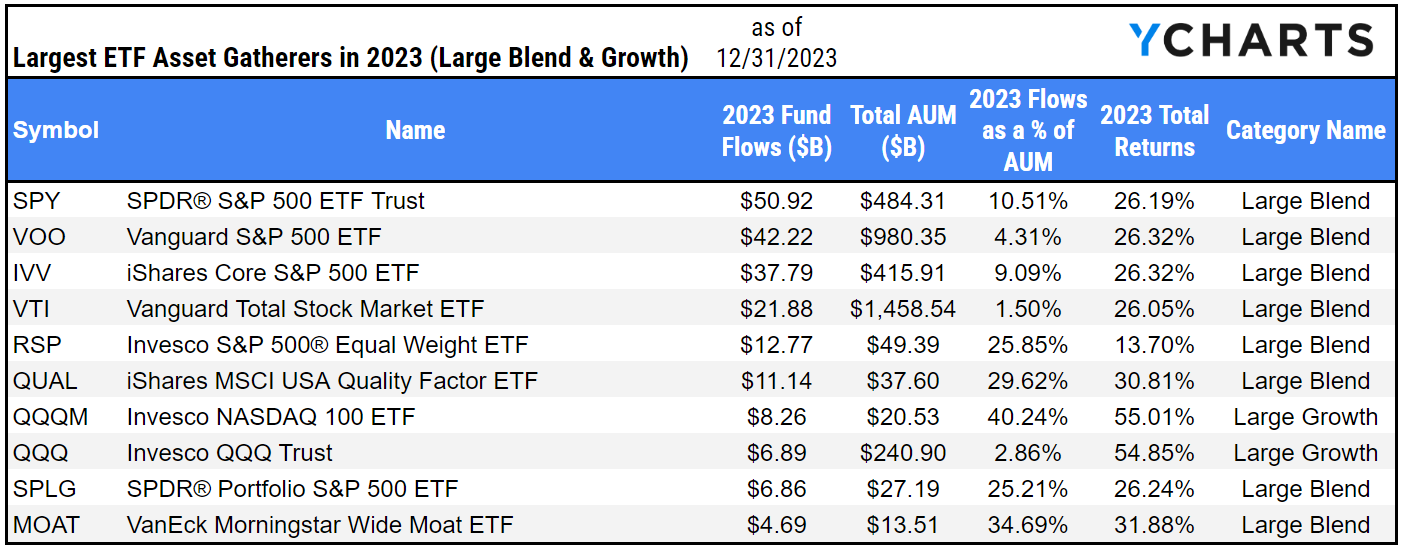
In 2023, the S&P 500 advanced 26.29%, and the NASDAQ 100 surged 55.13%. So it’s no surprise that the domestic equity categories that brought in the most assets were Large Blend and Large Growth.
The biggest equity ETFs continued to get bigger. The SPDR® S&P 500 ETF Trust (SPY) and Vanguard S&P 500 ETF (VOO) brought in $50.9B and $42.2B, respectively.
View the Full Comp Table in YCharts
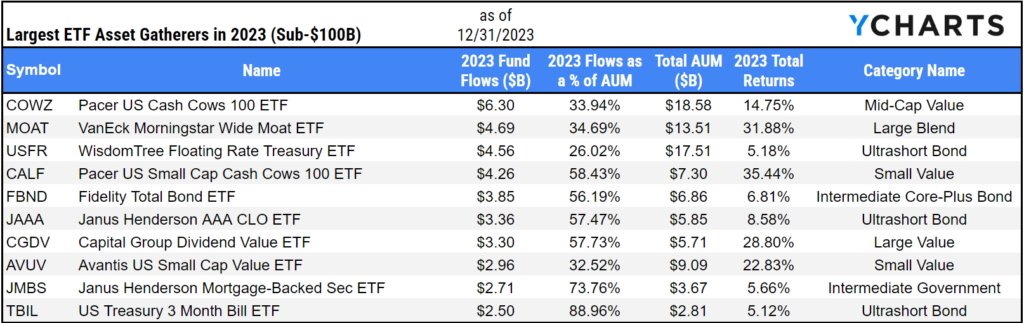
When you take a look at ETF issuers with less than $100B in AUM, Pacer US Cash Cows 100 ETF (COWZ) and VanEck Morningstar Wide Moat ETF (MOAT) attracted $6.3B and $4.7B, respectively.
View the Full Comp Table in YCharts
One of the more under-the-radar stories of 2023 was the fact that foreign large blend ETFs brought in more assets than Large Growth ETFs. Vanguard FTSE Developed Markets (VEA) and Vanguard Total International Stock ETF (VXUS) received $7.8B and $6.9B in 2023, respectively.
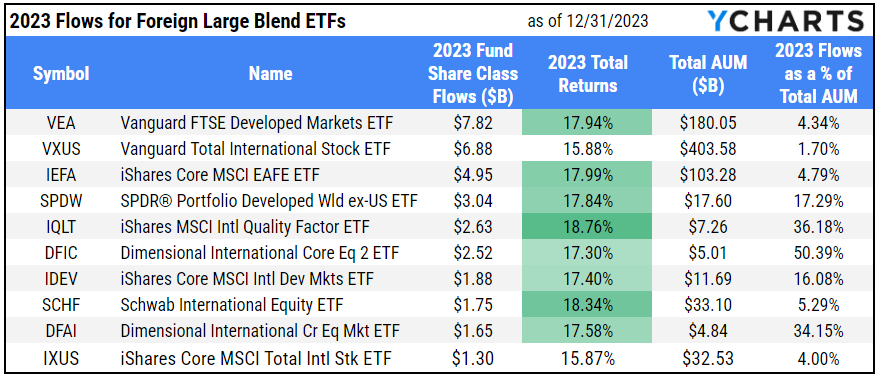
View the Full Comp Table in YCharts
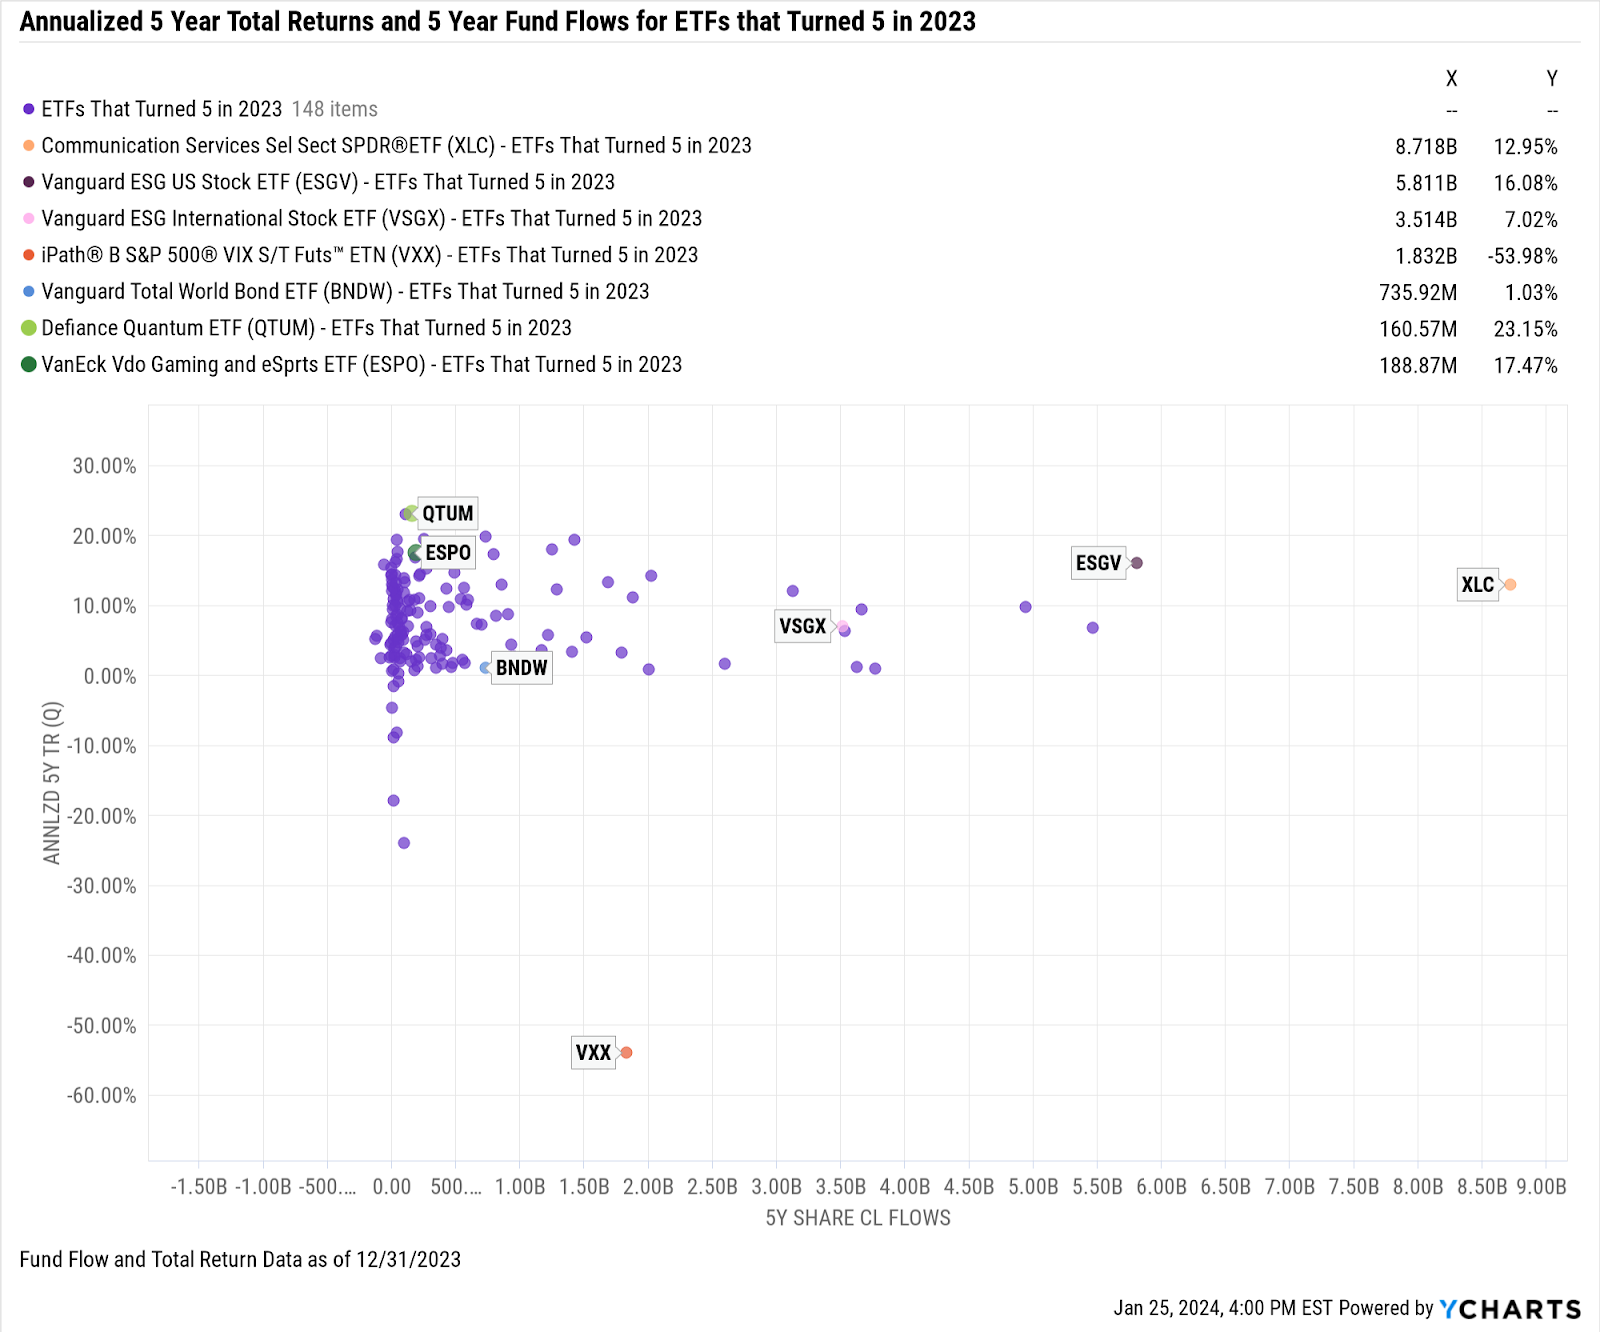
These ETFs Celebrated their 5th Inception Date in 2023
The fifth anniversary of an ETF is a special one. It allows asset managers to highlight the longer-term performance of their strategies. More importantly, a longer track record could mean that more advisors have access to investing in a particular fund.
The following ETFs had inception dates in 2018. Here’s how they’re doing.
Communication Services Select Sector SPDR® ETF (XLC) and Vanguard ESG US Stock ETF (ESGV) lead the clubhouse with $8.72B and $5.81 in inflows over five years, respectively.
Meanwhile, Defiance Quantum ETF (QTUM)’s 23.15% annualized five-year total return (quarterly) is the highest among ETFs of similar age.
Download Visual | Contact Us to Access This Chart
Whenever you’re ready, there are three ways YCharts can help you:
Have questions about how YCharts can help you grow AUM and prepare for meetings?
Email us at hello@ycharts.com or call (866) 965-7552. You’ll get a response from one of our Chicago-based team members.
Sign up for a copy of our Fund Flows Report and Visual Deck (clients only)
Unlock access to our Fund Flows Report and Visual Deck by becoming a client.
Dive into YCharts with a no-obligation 7-Day Free Trial now.
Disclaimer
©2024 YCharts, Inc. All Rights Reserved. YCharts, Inc. (“YCharts”) is not registered with the U.S. Securities and Exchange Commission (or with the securities regulatory authority or body of any state or any other jurisdiction) as an investment adviser, broker-dealer or in any other capacity, and does not purport to provide investment advice or make investment recommendations. This report has been generated through application of the analytical tools and data provided through ycharts.com and is intended solely to assist you or your investment or other adviser(s) in conducting investment research. You should not construe this report as an offer to buy or sell, as a solicitation of an offer to buy or sell, or as a recommendation to buy, sell, hold or trade, any security or other financial instrument. For further information regarding your use of this report, please go to: ycharts.com/about/disclosure
Next Article
A Look at the Top Charts of 2023Read More →