The Emergence of Emerging Markets with Shay Kshatriya

Interested in testing out YCharts for free?
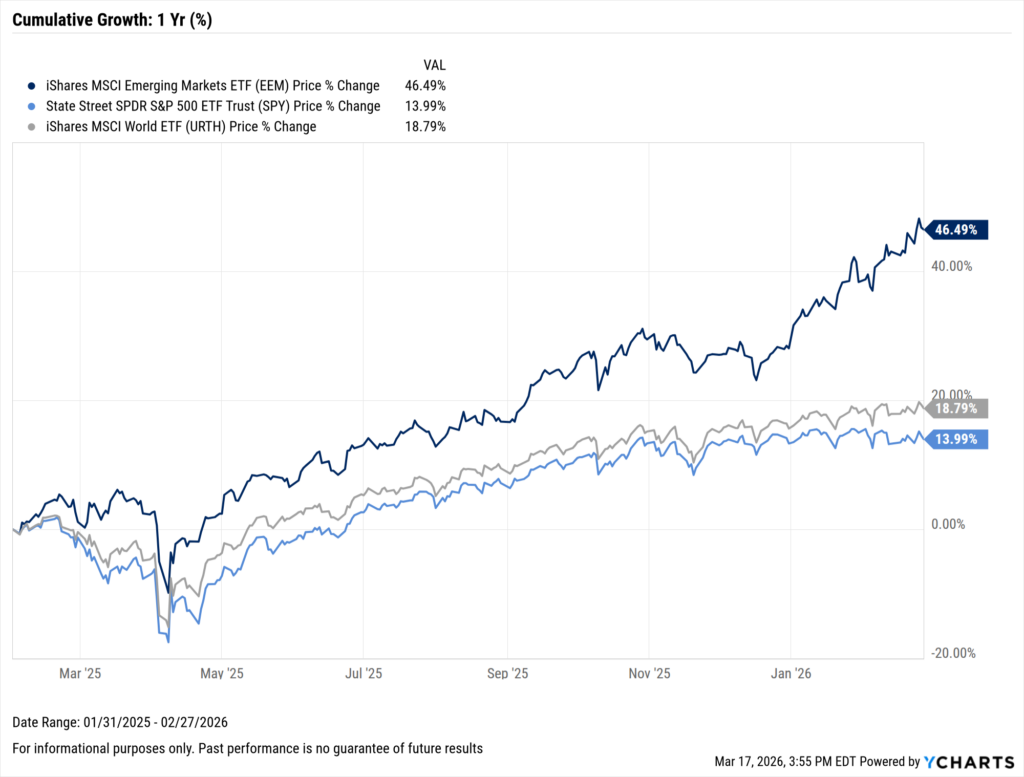
Start 7-Day Free TrialEmerging Markets (EM) have spent much of the past decade in the background of global portfolios, often categorized by prolonged underperformance and persistent volatility concerns. With emerging markets rising more than 35% over the trailing twelve months, we sat down with Shay Kshatriya, CFA, Chief Investment Officer at Trident Strategic Partners, to discuss why this asset class may deserve renewed strategic attention.

Table of Contents
Kshatriya brings more than 20 years of experience across asset management firms on Wall Street in New York and Bay Street in Toronto, advising clients on multi-asset solumarkets, and economic trends. His insights have appeared on Bloomberg TV and in publications including Dow Jones and The Globe and Mail.
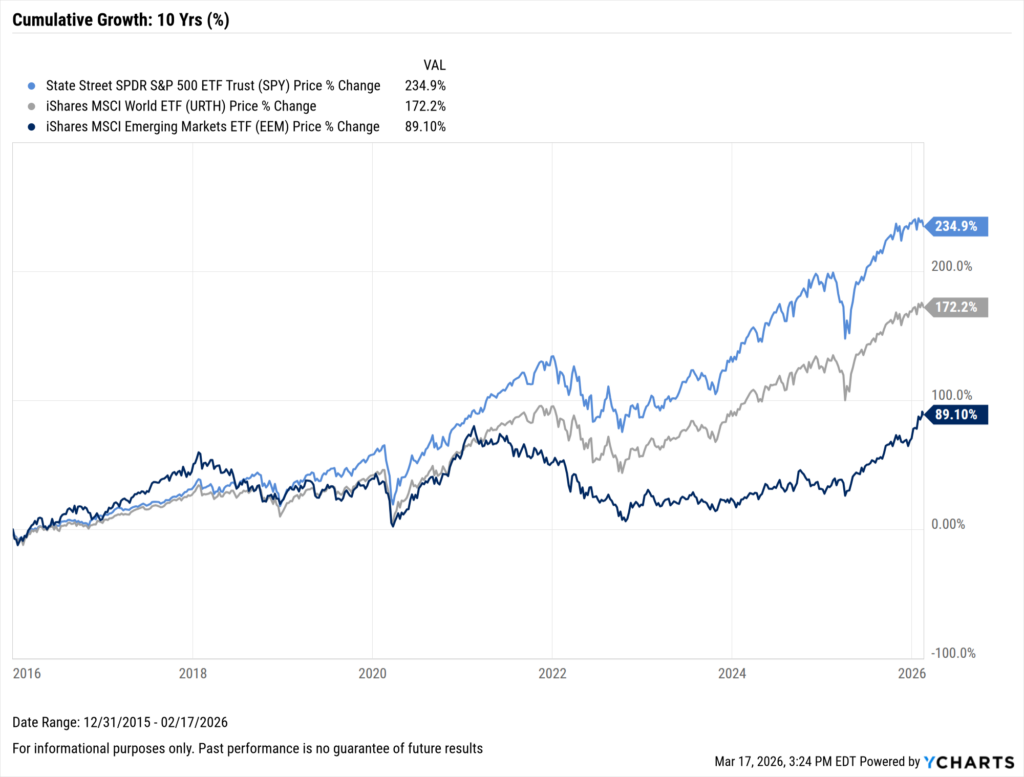
Trident Strategic Partners’ February 2026 Monthly Observation: The Emergence of Emerging Markets, examines how stronger fiscal discipline, resilient growth, and higher real yields are reshaping the case for EM exposure. To illustrate those trends, Kshatriya uses YCharts historical datasets across volatility, relative performance, and fixed income throughout his research.
In the conversation below, Kshatriya discusses the structural changes supporting emerging markets, what may be driving lower relative volatility, and which risks could challenge the outlook going forward.
Q&A with Shay Kshatriya
YCharts: Emerging Markets (EM) were viewed as a performance laggard, yet the global environment has now shifted in their favor. What structural changes are driving this potential turning point?
Shay Kshatriya: There are five core pillars to improving prospects for Emerging Markets: improved fiscal positioning, strong growth profile, institutional integrity, compelling valuations, and USD trends.
While emerging economies have long been recognized for stronger growth than developed economies, the major shift from the past lies in fiscal policy. As investors grow more worried about the debt and deficits of many developed markets (DM), it’s interesting that the fiscal situations of many developing economies are in better relative shape.
For example, Taiwan, Korea, India, and Brazil have government debt-to-GDP ratios below 100%. In contrast, most G-7 economies, excluding Germany, now carry debt levels exceeding 100% of GDP. In other words, unlike the fiscal concerns that caused EM volatility in the 1990s, the fiscal situation today is, in some cases, arguably more stable than that of DM.
Furthermore, EM central banks have become more proactive in managing inflation, indicating improved institutional integrity. For example, during the post-pandemic inflation surge in 2021-22, the central banks in Brazil and Mexico started raising their policy rates in 2021, well before the US Federal Reserve, which viewed the increase as temporary and did not begin tightening policy until March 2022.
Moreover, the U.S. Dollar spent much of the post-GFC period in a structural uptrend, though that dynamic appears to be moderating. Since the USD serves as the world’s reserve currency, a weakening USD trend is globally liquidity-enhancing and benefits EM nations with dollar-denominated debt.
While valuations have been attractive for some time relative to U.S. equities, the improved fiscal environment, along with the structural forces discussed, makes EM an appealing strategic addition to globally diversified portfolios.
YC: Historically, EM assets have carried higher volatility, but your research shows that volatility has recently aligned more closely with that of developed markets. What has driven that change, and how sustainable do you think it is?
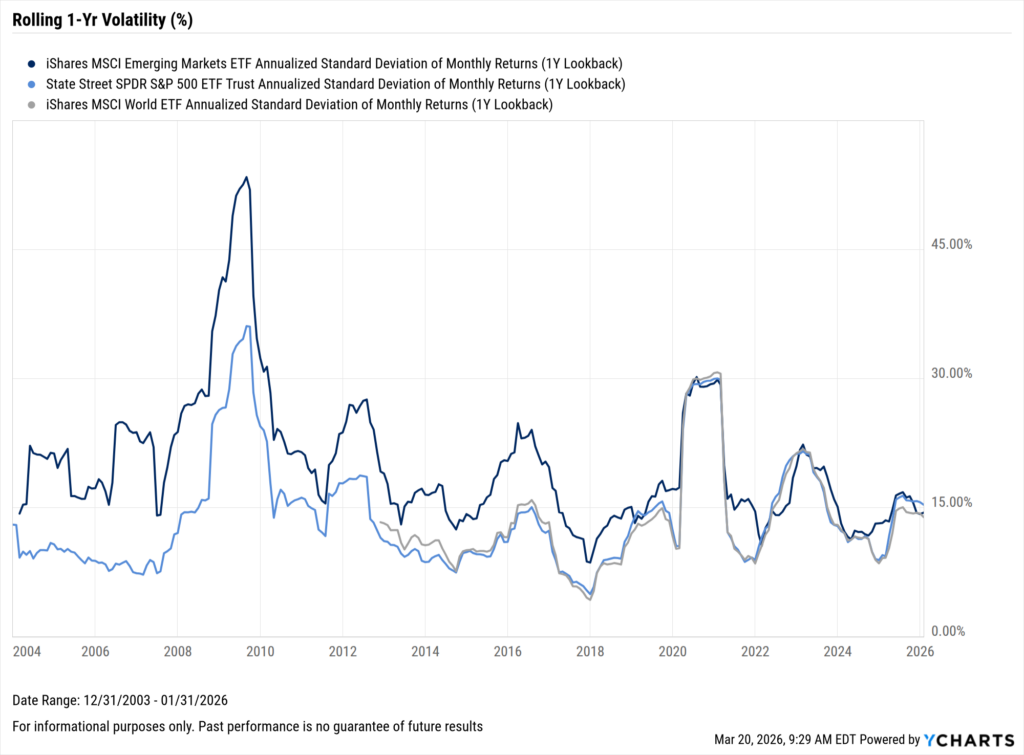
SK: The points noted, such as an improved fiscal outlook, a stronger monetary policy framework, and better foreign-exchange management, have helped reduce EMs’ perceived risk. No trend is ever linear, so exogenous shocks or idiosyncratic policy decisions can have a disproportionate effect.
For example, EM assets often show increased volatility during geopolitical shocks, influenced by global risk-off sentiment, commodity price fluctuations, and currency changes – all of which have been factors since the outbreak of war with Iran.
Still, we believe that, overall, emerging economies are in a healthier fiscal position, and an improved central bank framework makes the asset class structurally less vulnerable than during the 1990s crisis cycles. But, as with all investing, diversified exposure is essential, since it is not a homogeneous asset class.
YC: Your research shows EM local-currency debt offering a higher yield-to-duration ratio than other fixed-income sectors. Why is that particularly important now?
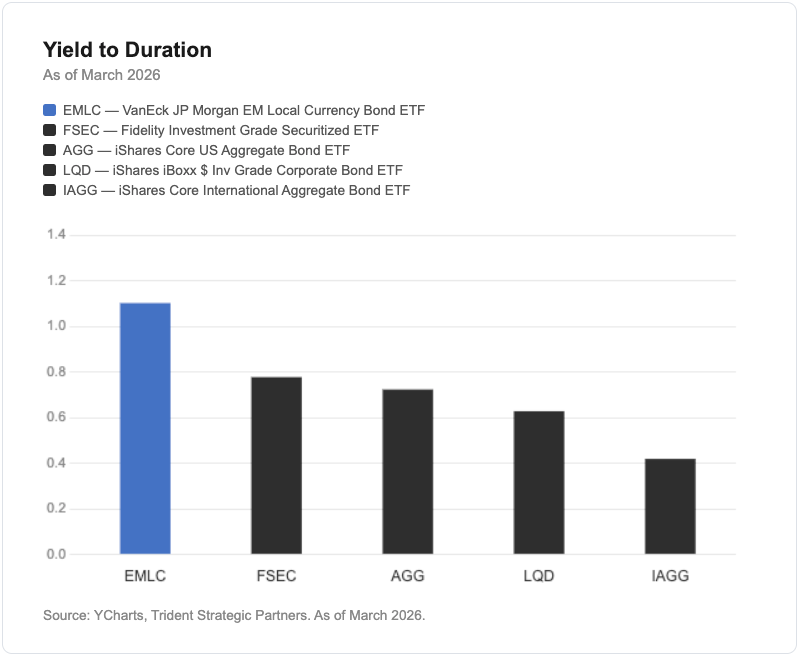
SK: Although we are highlighting an improved fiscal position for EM compared to its history, there are inherent policy risks that lead to a risk premium and, ultimately, higher sovereign yields relative to developed economies. While investors seek higher yields, they also need to evaluate them relative to interest rate risk. While imperfect, a rough measure of potential income in relation to risk is the yield (or income potential) to duration (interest rate sensitivity).
The higher the yield-to-duration (YtD) ratio, the better the compensation for interest rate risk. And what we highlight is that local-currency EM debt has a higher YtD ratio than US aggregate bonds and other selected fixed-income sectors. Additionally, a cyclical downturn in the US dollar would also support emerging market debt.
YC: Even with stronger fiscal positioning, growth advantages, and attractive valuations, what developments could undermine the case for EM?
SK: The volatility we’re seeing in the asset class right now, caused by the war in the Middle East, is a clear reminder that no trend is ever linear. While the asset class still looks promising over the long term, short-term vulnerabilities can undermine the benefits of the strategic outlook. I am also keeping a close eye on the US dollar.
Historically, periods of a strong dollar have been a headwind for emerging market assets, so if the USD downtrend that started last year reverses sustainably, it could also create challenges.
What’s encouraging, however, is that EM is no longer just a play on commodities, as it was during its last period of outperformance in the 2000s. Emerging economies now offer exposure to technology, finance, and, of course, commodities, among other sectors, making them more dynamic today.
Still, there are obviously no guarantees in investing, so it’s important to emphasize that any asset class consideration should be made within the context of a globally diversified asset allocation.
Empowering Advisors
Shay Kshatriya’s insights suggest that resurgence in emerging markets is not just about growth momentum, but rather a wider shift in global fundamentals.
For OCIOs, navigating this shift requires tools that make it easy to visualize trends, share research with advisors, and create custom-branded reports for client and prospect conversations.
With real-time model updates, white-labeled reports, and seamless collaboration, YCharts empowers these teams to strengthen both advisor and end-client engagement.
Ready to Move On From Your Investment Research and Analytics Platform?
Follow YCharts Social Media to Unlock More Content!
Next Article
Tech Drawdowns, Value Inflows: What ETF Flows Are Telling Us NowRead More →