When Clients Ask Why, You’ll Have an Answer with Factor Analysis in YCharts

When reviewing investment performance with clients, one question almost always follows:
Why did this happen?
Attribution helps answer part of that question. It breaks down how individual holdings, sectors, or allocation decisions contributed to returns. But attribution doesn’t always tell the whole story.
Investment performance is often shaped by common market factors that affect groups of securities in similar ways. Understanding those drivers can help advisors better explain why a security or portfolio behaved the way it did.
That’s where Factor Analysis adds another perspective.
A Deeper Look at What’s Driving Performance
Factor Analysis is now available as a tab within Attribution on portfolio and fund pages in YCharts. It evaluates performance through seven systematic investment factors — Growth, Value, Momentum, Size, Quality, Low Volatility, and Dividend Yield — giving advisors another lens for understanding why a security or portfolio behaved the way it did relative to the broader market.
If you’re already thinking about factor exposures when building or evaluating strategies, this gives you a place to do that analysis directly within your existing YCharts workflow.
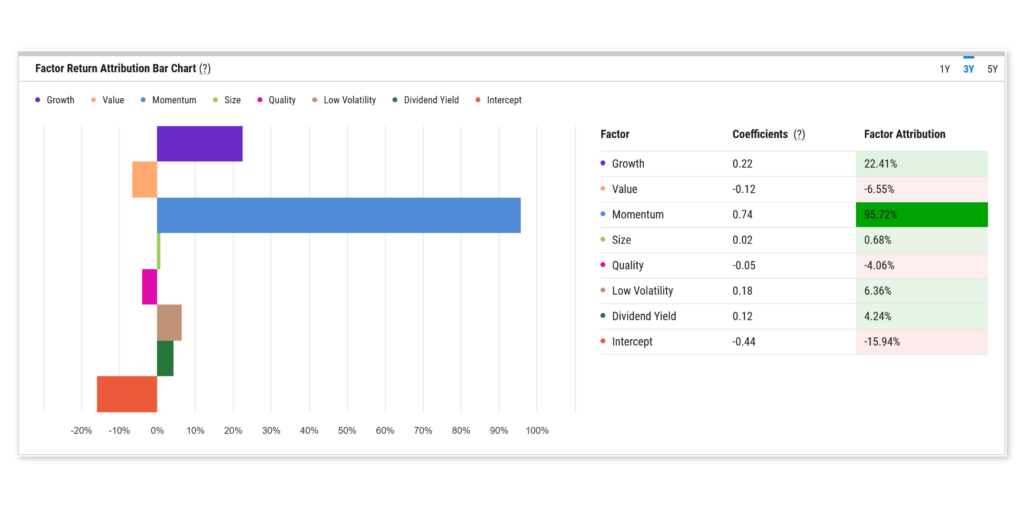
Toggle between Return and Risk views to see how much each factor contributed to overall performance or volatility. The Factor Attribution module shows each factor’s contribution, making it easy to identify the primary drivers at a glance.
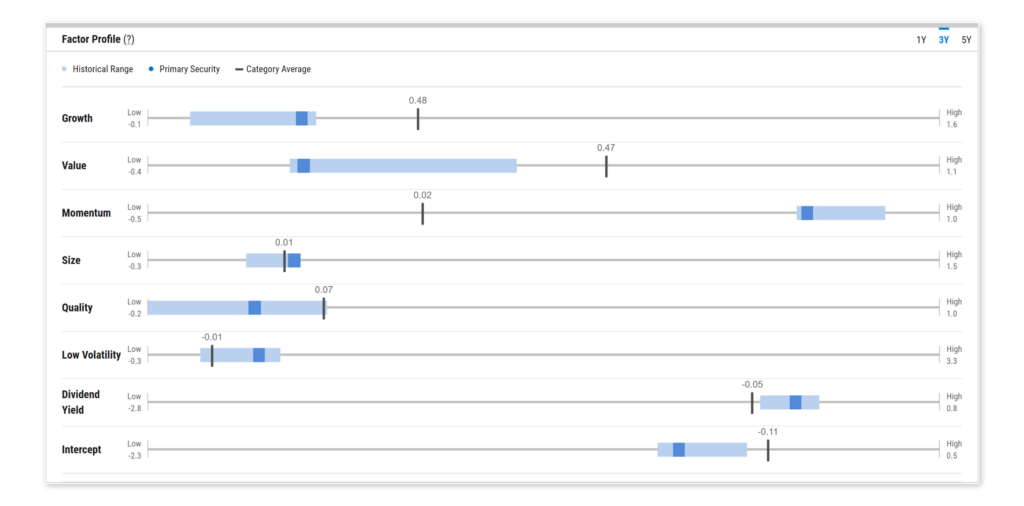
The Factor Tilt Visualization goes a step further, showing how a security’s factor exposures compare to its peer category, both historically and at the current point in time. Spot whether a portfolio is tilting toward momentum, leaning into quality, or drifting from its intended factor profile.
The Factor Risk/Return Scatterplot adds historical context by plotting the risk and return characteristics of each factor benchmark, helping advisors interpret how those exposures may influence portfolio behavior going forward.
Putting It to Work in Client Conversations
Factor insights are most valuable when they sharpen the story you’re telling clients. Whether a portfolio outperformed because of a momentum tilt, underperformed due to value headwinds, or carried more volatility than expected from a size exposure, Factor Analysis helps you explain the why behind the results, not just the what.
Combined with Attribution, it gives advisors a more complete picture of performance from every angle.
Already a YCharts user? Find Factor Analysis within the Attribution tab on any portfolio or fund page.
Not on YCharts yet? See how Factor Analysis and the full suite of portfolio analysis tools can help you have better client conversations.
Follow YCharts Social Media to Unlock More Content!
Next Article
Monthly Market Wrap: March 2026Read More →