
How Gas and Diesel Prices Feed Into Inflation
Interested in testing out YCharts for free?
Start 7-Day Free TrialLabor Day weekend usually marks the end of the pain at the pump. The pricier summer gas gets phased out, road trips wind down, and prices ease their way into September. That is not how this year is playing out. Diesel hit a nominal record of $5.85 a gallon on Friday, September 4, according to AAA, and regular gasoline averaged $4.15, a level AAA says it has never held on a Labor Day.
The headline is the least interesting part. Record fuel prices are a familiar story with a familiar shape, and the market has had six months to price the obvious beneficiaries. The harder question is the one nobody has answered yet: how long does a fuel shock take to reach a shelf, and what has to happen along the way for it to get there.
Fuel prices reach inflation two ways. Motor fuel is a direct component of the CPI energy category, so retail prices show up in headline CPI the same month they move. Diesel costs also enter the supply chain as freight and production expense, reaching consumer prices months later in core goods rather than energy. That second channel is why a fuel shock can pressure inflation long after crude stops rising.
On this page
Not every price spike works the same way
Crude is the largest single input in a gallon of refined fuel, so the pump story starts upstream. Brent wholesale spot crossed $100 a barrel on September 3, up from roughly $70 before the conflict with Iran began in late February, a move of about 40%, with most tanker traffic bottlenecked in the Strait of Hormuz.
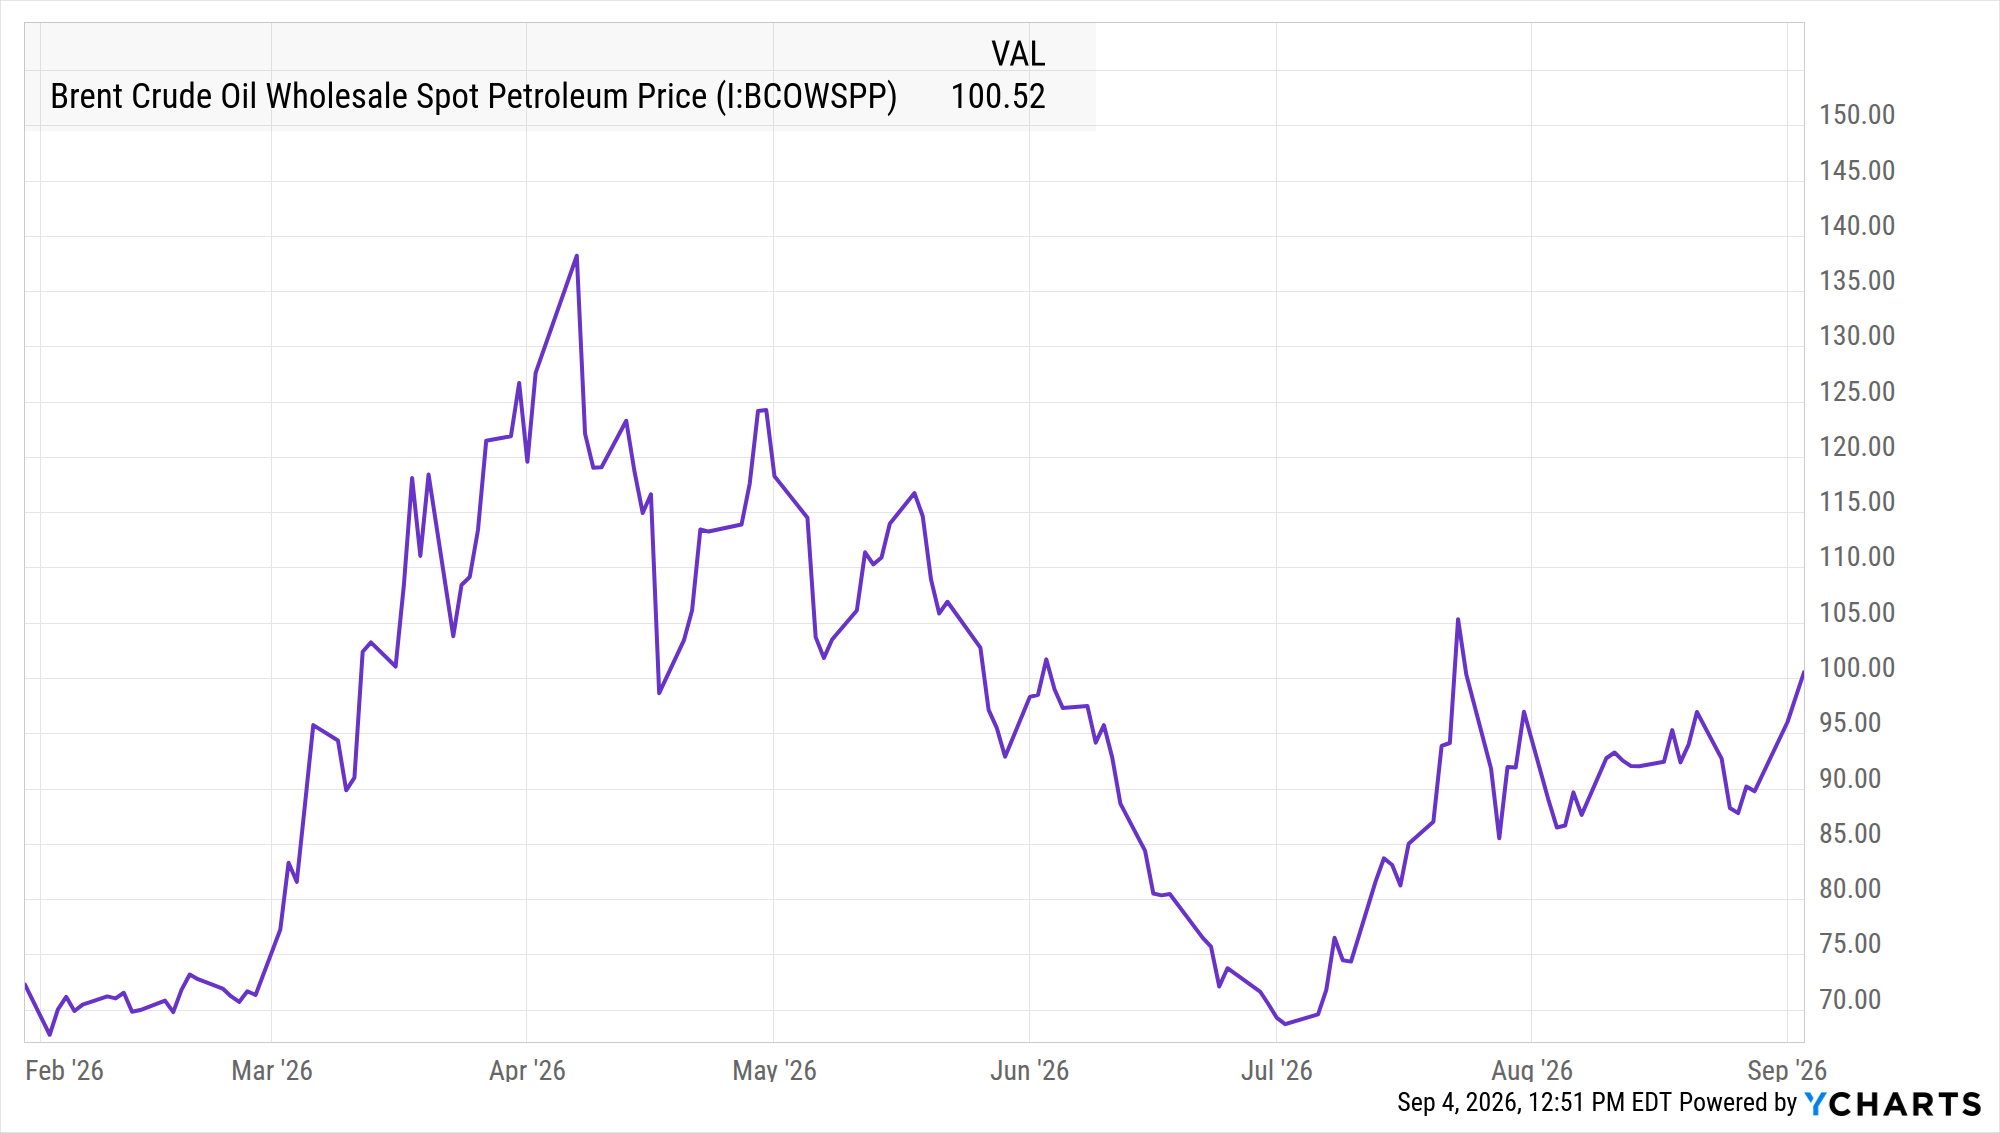
The distinction that matters is that this move came from constrained supply rather than strong demand, and the two are not interchangeable. Demand-driven inflation tends to build and recede slowly, because it reflects the underlying economy. Supply-driven inflation can reverse in days if the constraint lifts, which is what happened when crude eased on hopes for a settlement earlier in the summer before resuming its climb. The pump followed in both directions, with a delay.
That asymmetry is what makes fuel shocks so hard to trade. The price contains a risk premium that can evaporate without anything changing in the real economy, while the costs it has already pushed into the supply chain cannot be reversed on the same timeline.
Diesel is the number that matters
Gasoline gets the attention because households buy it directly. Diesel does the economic damage. It powers long-haul trucking, freight rail, marine shipping, and farm equipment, which puts it upstream of the price of nearly everything on a shelf rather than just the cost of a commute.
The two fuels have also moved at different speeds. AAA puts diesel up roughly 56% from its late-February level near $3.76 a gallon, while regular gasoline is up a little over 39% from $2.98. The gap is not a coincidence. A household can drive less when gasoline gets expensive. A freight network has no near-term substitute for diesel, so demand barely flexes and the price does the adjusting instead.
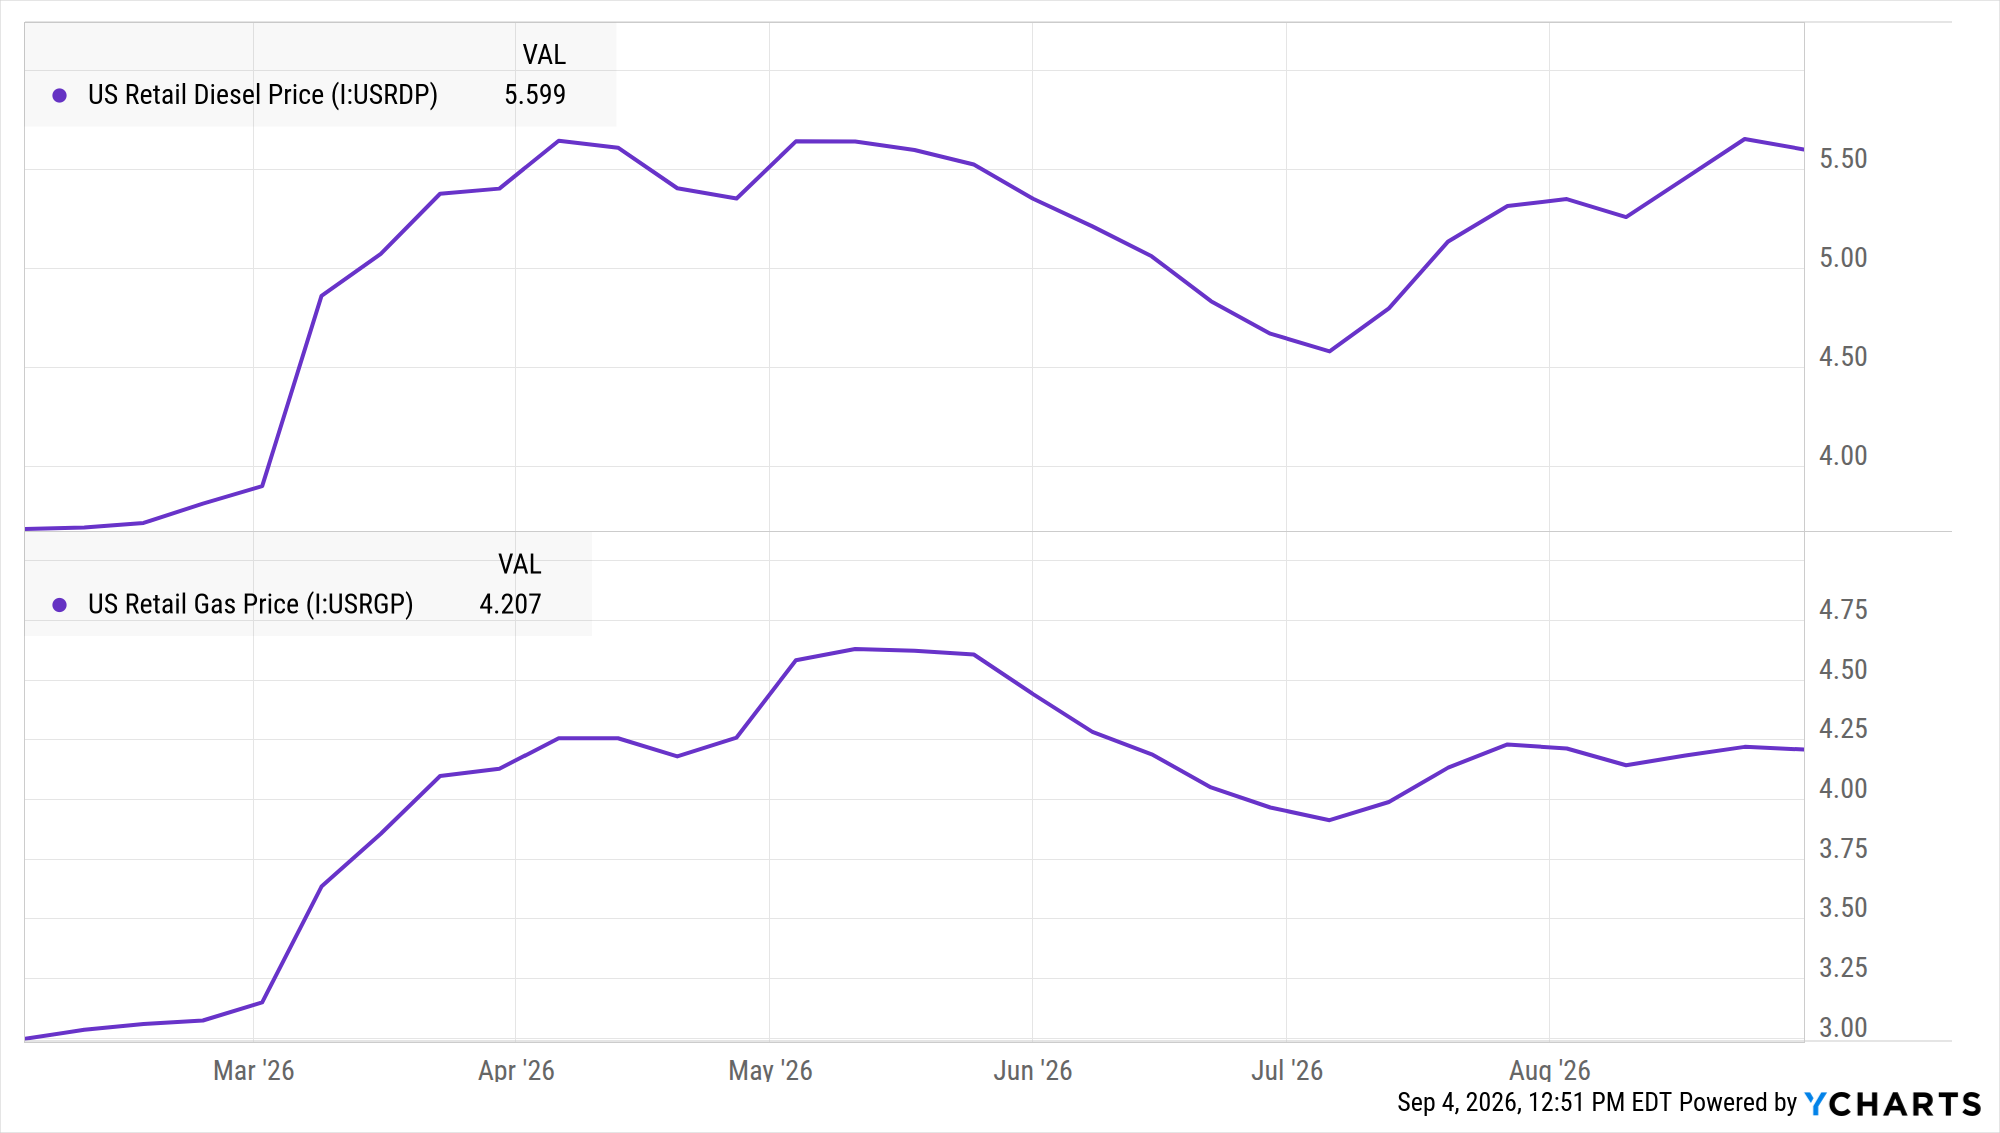
US Retail Diesel Price data by YCharts
When gasoline rises, households feel it immediately and adjust discretionary spending. When diesel rises, the cost enters the supply chain as freight surcharges and equipment operating expense, and it reaches consumers later, embedded in the price of goods that have nothing obvious to do with fuel.
The nominal record is the wrong yardstick
A $5.85 average is the highest nominal diesel price on record, edging past the peak set in June 2022 after the invasion of Ukraine. Adjusted for inflation the ranking changes.
| Diesel peak | Nominal | In 2026 dollars |
|---|---|---|
| September 2026 | $5.85 | $5.85 (current) |
| June 2022 | $5.81 | $6.56 |
| July 2008 | $4.76 | $7.20 |
Nominal figures reflect the EIA weekly retail diesel series. The real-dollar column converts each peak to 2026 dollars using headline CPI.
Today’s price is a record at the pump and a materially smaller shock than either in real terms. That matters for two reasons. It frames how much further prices could plausibly run, and it goes some way toward explaining why the observable economic damage has been more contained than the headline implies.
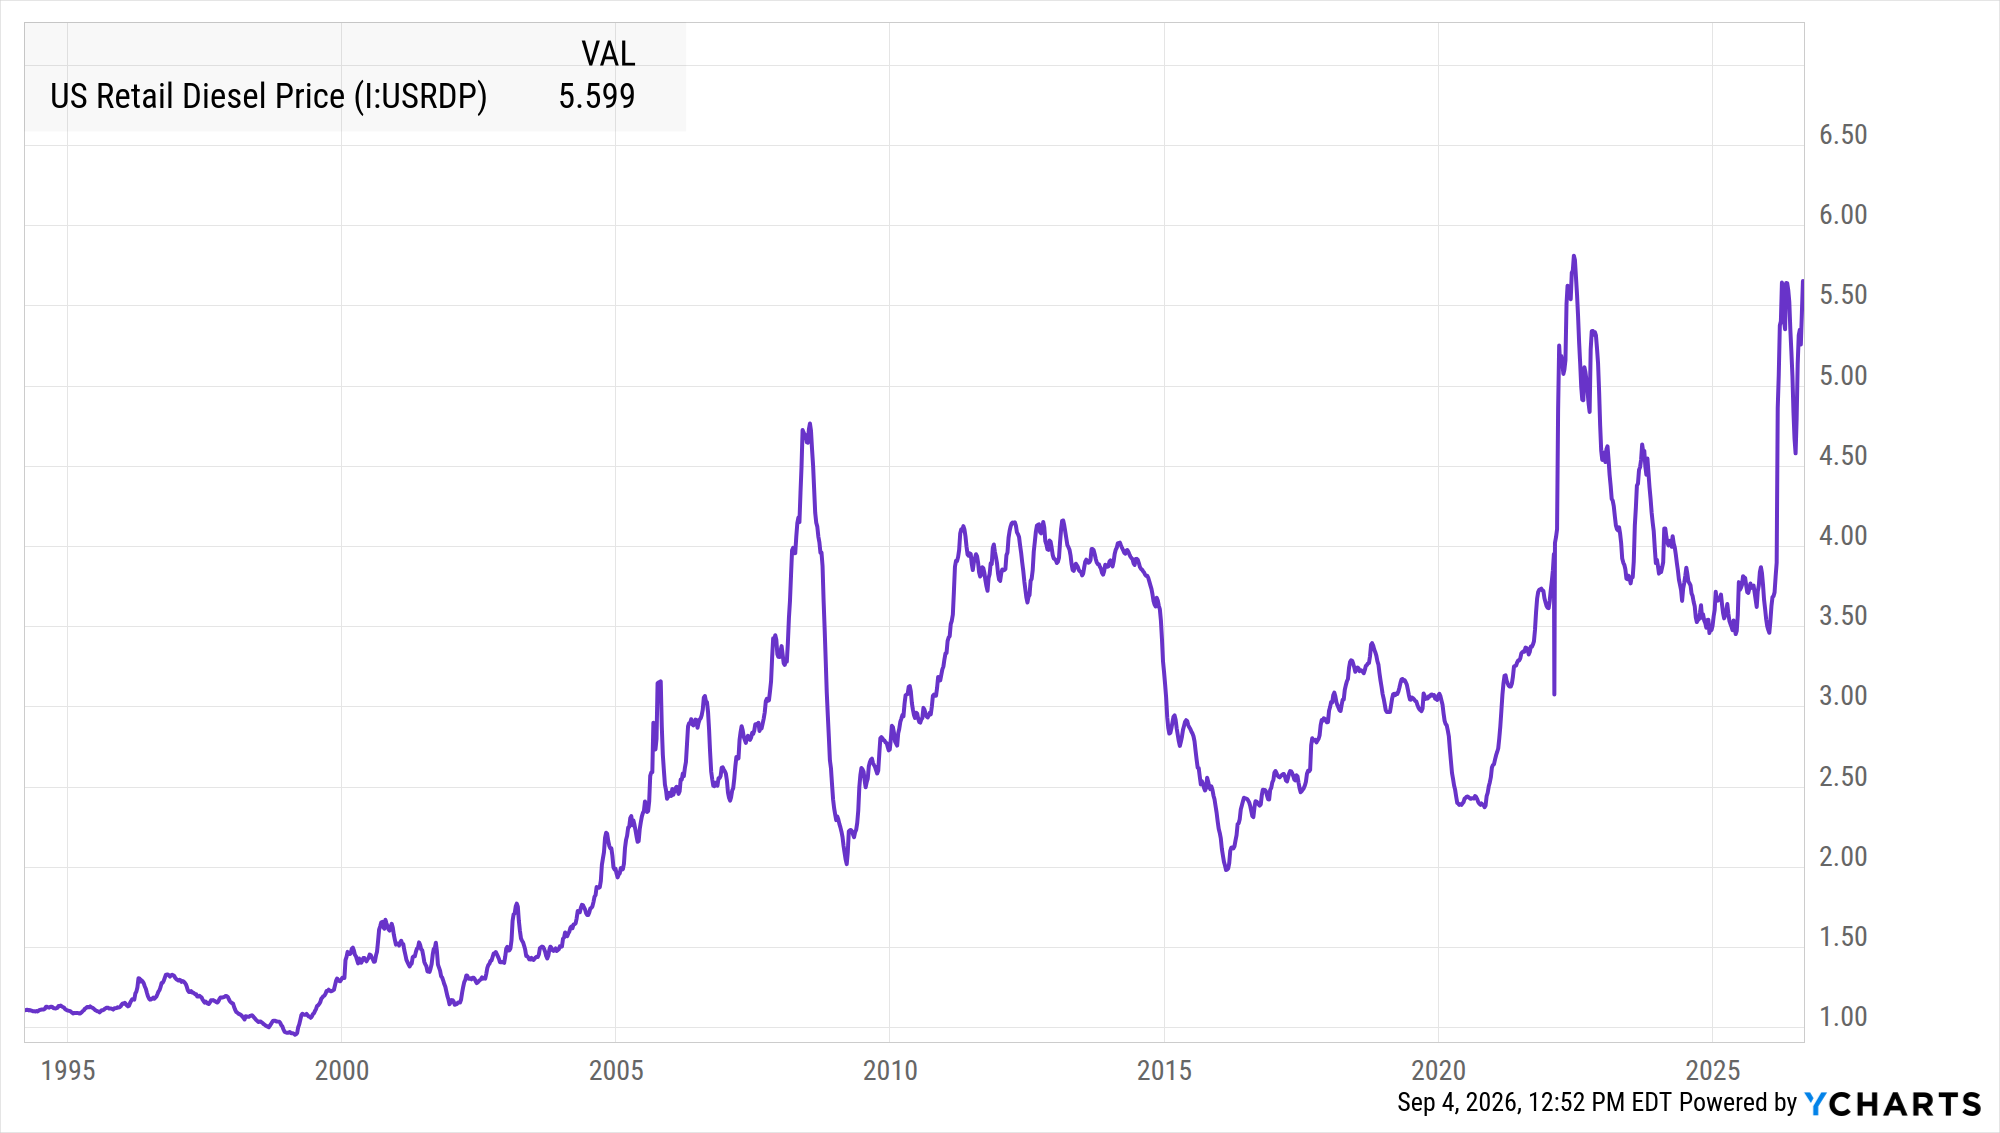
US Retail Diesel Price data by YCharts
The chart above plots the EIA weekly retail series, which prints on Mondays and runs a few days behind AAA’s daily average. On that weekly basis the current level sits just under the June 2022 peak.
The pass-through runs on a contract cycle, not a news cycle
Fuel reaches consumer prices two ways, on two clocks. Motor fuel sits inside the energy component of the CPI basket, so retail prices affect headline CPI the same month they move. That channel is fast, visible, and largely why headline inflation is more volatile than core. Headline CPI ran at 3.3% year over year in July.
Put the two series side by side and the limits of that channel show up quickly. Diesel has moved sharply since February while headline CPI has moved far less, because motor fuel is only a few percent of the basket. The direct hit is real, and it is small.
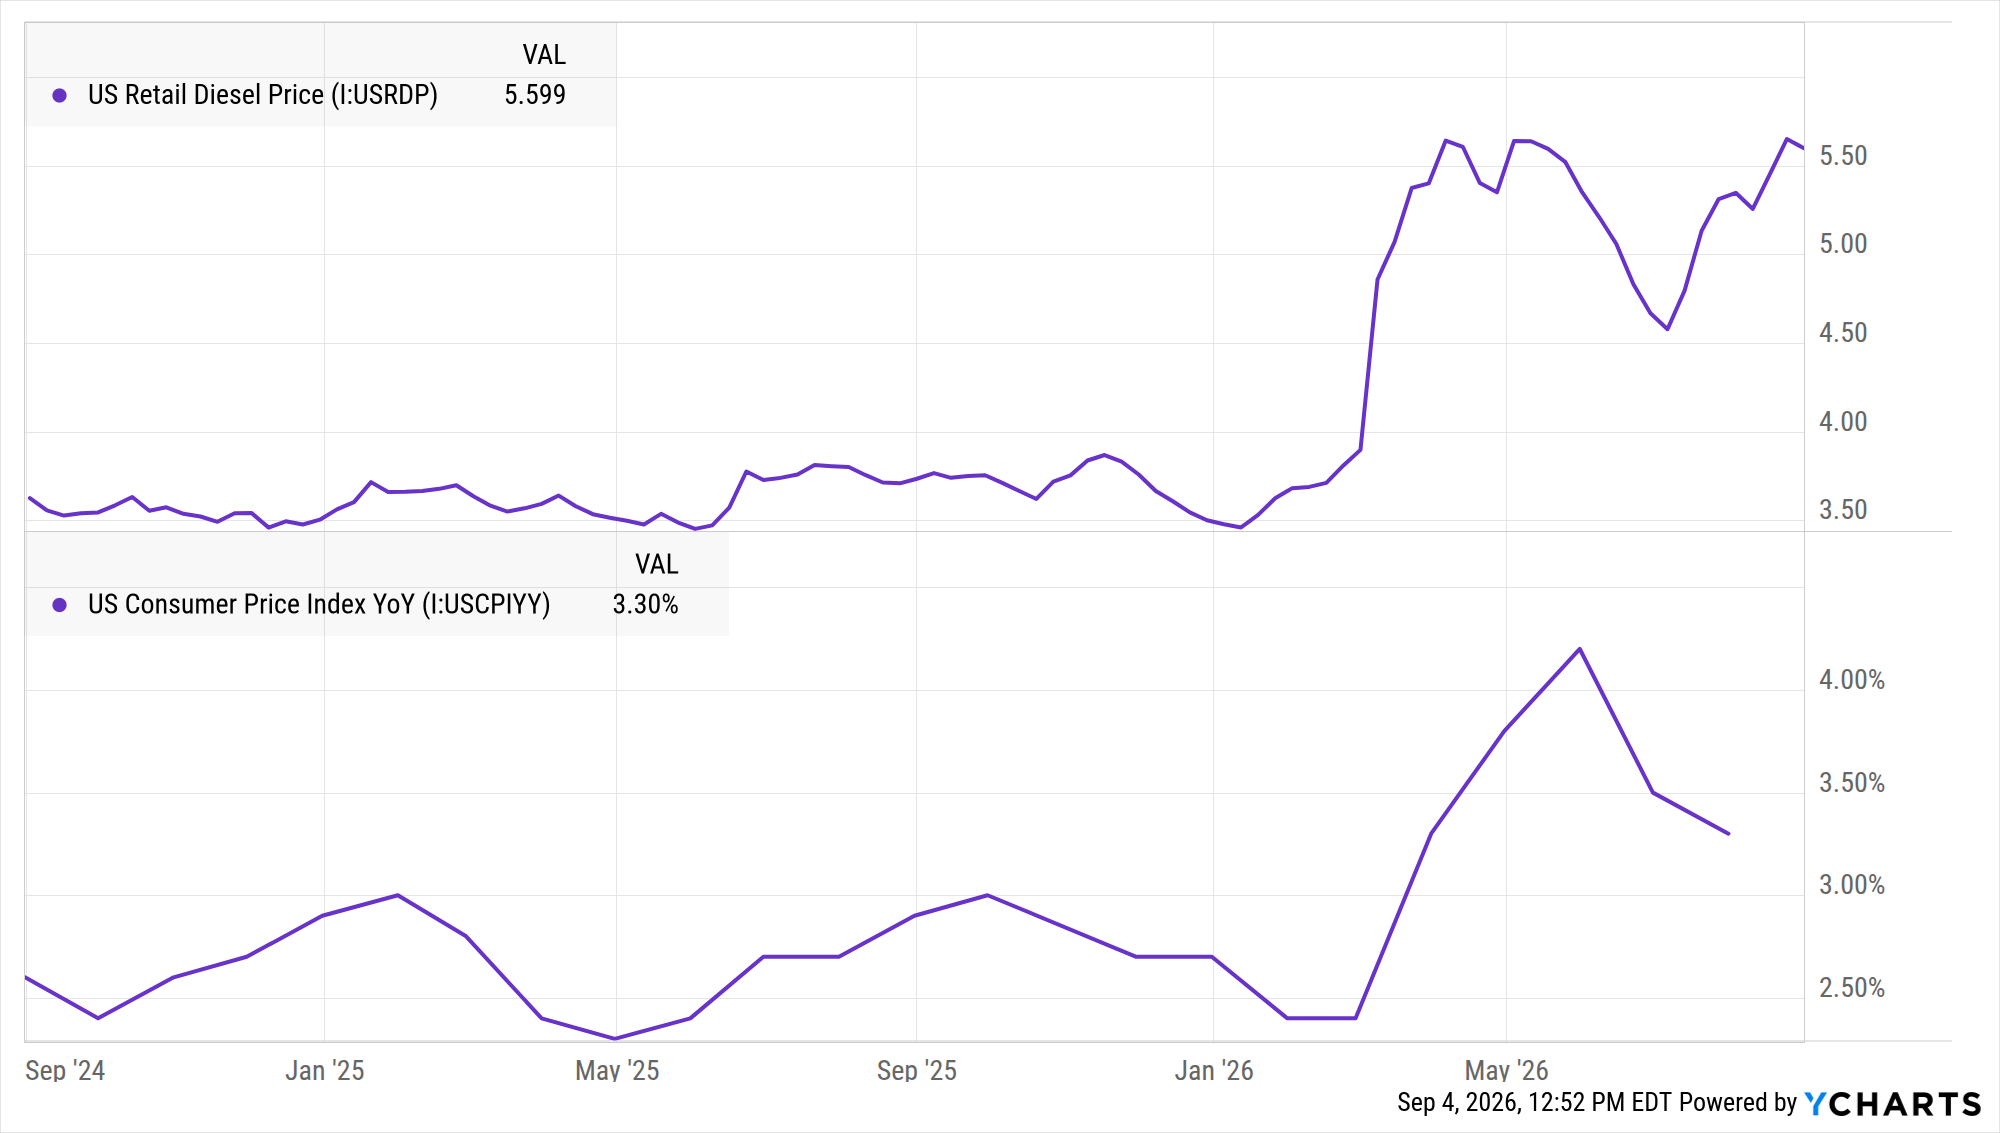
US Retail Diesel Price data by YCharts
The channel that actually matters takes longer and does not appear in the panel above. Diesel costs enter freight rates, freight rates enter the landed cost of goods, and landed cost eventually reaches shelf prices. That path lands in core goods and food rather than energy, and it runs on months.
The reason for the delay is contractual, not physical. Early in a fuel shock, existing freight agreements and retailer margins absorb most of the increase. David Ortega, a food economics professor at Michigan State University, told the Associated Press that more of the cost reaches the grocery store as contracts reprice and fuel surcharges take hold. Those surcharges are already appearing. Amazon added a temporary fuel and logistics fee on some third-party sellers in April, and UPS, FedEx, and the Postal Service have each layered fees onto certain shipments.
Food is where it shows up first, because fuel represents somewhere between 15% and 30% of total food cost by the Independent Grocers Alliance’s estimate, and because refrigerated and frequently restocked items turn over fastest. In July, US grocery prices were up 2.7% from a year earlier while seafood was up 7% and fresh fruit up 4.9%, though category-specific supply factors contribute to those gaps as well.
What this means for portfolios
The investable implication follows from the timing, not the price level. The direct fuel trade is the crowded one. Energy producers, refiners with heavy distillate yields such as Valero and Marathon Petroleum, and tanker operators benefiting from longer routes have had six months to reflect a benchmark that has moved roughly 40% since February. The cost side is equally well understood: airlines buy jet fuel out of the same barrel as diesel, and cruise operators burn marine fuel while selling a discretionary product to households already paying more at the pump.
The part still ahead sits with companies that buy transportation rather than sell it. Packaged food companies, grocers operating on thin margins, and general merchandisers are the ones still waiting for the bill, and their outcomes split on one variable: pricing power.
A retailer that passes a freight surcharge to the shelf protects its margin and adds to core goods inflation. One that absorbs it protects traffic and gives up margin. Walmart, Costco, and Target face the same fuel price and may well report very different results because of it, which is why dispersion within the sector tells you more than the sector average does.
For fixed income, the mechanism is simpler. Energy-driven inflation weakens the case for policy easing, which pressures long duration regardless of credit quality. Investors holding long Treasuries as a diversifier can find the same shock lifting inflation expectations is also lifting yields, the same math that turns a diversifier into a drag.
Duration, not magnitude
Everything downstream depends on how long this lasts rather than how high it goes. A spike that resolves within weeks largely disappears into supply chain absorption and never reaches a shelf. One that persists across a contract cycle reaches consumer prices, corporate margins, and eventually earnings estimates. Three things tell you which one you are in: the crude-to-pump spread, food-at-home CPI, and freight producer price indices. They turn in that order.
Frequently asked questions
Do gas prices affect inflation?
Yes, through two channels. Motor fuel is a component of the energy category inside the Consumer Price Index, so retail fuel prices affect headline CPI in the same month they move. Fuel costs also raise freight and production expenses, which reach consumer prices later and appear in core goods and food inflation rather than energy.
Why does diesel matter more than gasoline for inflation?
Diesel is the primary fuel for trucking, rail, marine shipping, and agricultural equipment, which places it upstream of the cost of moving and producing physical goods. A sustained rise in diesel prices raises input costs across the supply chain, while a rise in gasoline prices mainly affects household budgets directly. Diesel demand is also less elastic, since a freight network cannot easily use less of it.
What is the highest diesel price ever?
The highest nominal US average was set in September 2026 at $5.85 a gallon per AAA, edging past the June 2022 peak. In inflation-adjusted terms both levels sit below the mid-2008 high, which is worth roughly $7.20 in 2026 dollars.
How long does it take for fuel prices to show up in CPI?
The direct energy component shows up in the same monthly CPI release. The indirect path through freight and production costs takes considerably longer, generally several months, because existing freight contracts and retailer margins absorb the increase until those contracts reprice.
Which indicators track fuel prices and inflation?
Retail diesel and gas prices, Brent and WTI crude, headline and core CPI, food-at-home CPI, and producer price indices for truck freight and freight arrangement. Charting the fuel series against CPI is the fastest way to see where in the pass-through chain a given price move currently sits.
Every chart in this article was built in YCharts using economic indicator data that refreshes as new releases come in, so the same views can be pulled into a client meeting or a market commentary at any point. Request a demo to build them against your own watchlists and portfolios.
Next Article
How Advisors Can Talk to Clients About Bond LossesRead More →