
How Advisors Can Talk to Clients About Bond Losses
Your client opens a statement, sees red in the bond sleeve, and asks the only question that matters to them: why is my safe money losing money?
It is a fair question with a good answer. Most advisors do not have that answer on a screen when they need it.
Where the Market Actually Is
The chart below shows the 2-Year, 10-Year, and 30-Year Treasury Rate over the past 12 months. All three have moved higher, and the front end has climbed faster than the long end. That upward shift across the entire curve is the reason bond sleeves look the way they do on client statements right now.
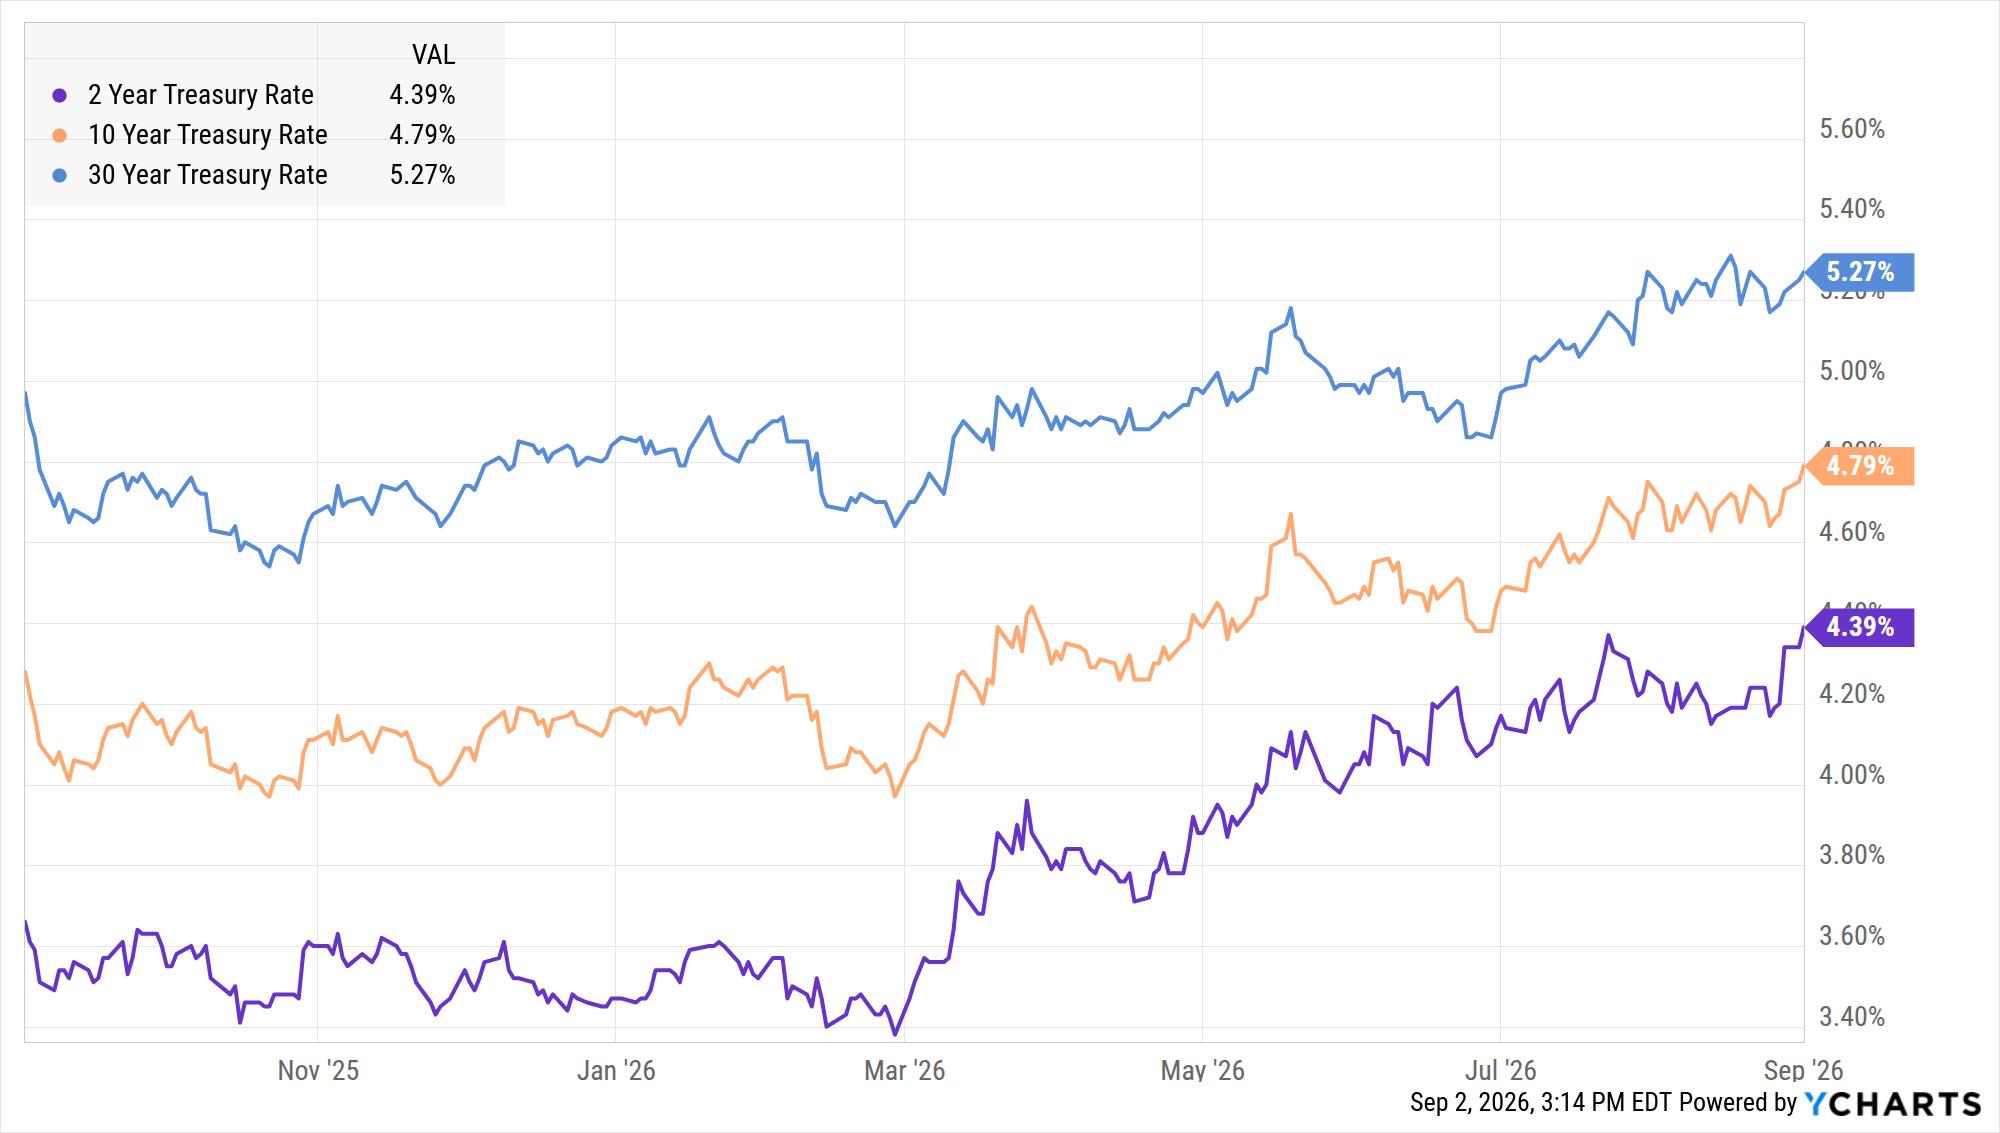
The 30-Year Treasury Rate closed September 1 at 5.27%, after printing 5.31% in mid-August, its highest level on this series in roughly 19 years. The 10-Year sits at 4.79%, a level it last touched in January 2025. The 2-Year is at 4.39%, which leaves 88 basis points between the front end and the long end, a narrower gap than a year ago.
That 12-month window is the part worth saying out loud in a client meeting. A one-year chart is not a headline. It is the entire period during which your client watched their statement turn red. Put it in front of them and the question becomes easier to answer.
Why Bonds Lose Value When Interest Rates Rise
Start here, because most clients have never had it explained cleanly.
A bond pays a fixed coupon. When newly issued bonds arrive at higher yields, the older, lower-coupon bond becomes less attractive, so its price falls until its yield matches what the market now offers. Nothing has gone wrong with the bond. It has been repriced against better alternatives.
The consequence is the whole conversation. The loss on the statement and the yield available today are two sides of one event. One is a mark-to-market hit on what the client already owns. The other is a better starting point for what they can buy.
Reframe One: Show the Entry Point, Not the Loss
How We Got Here
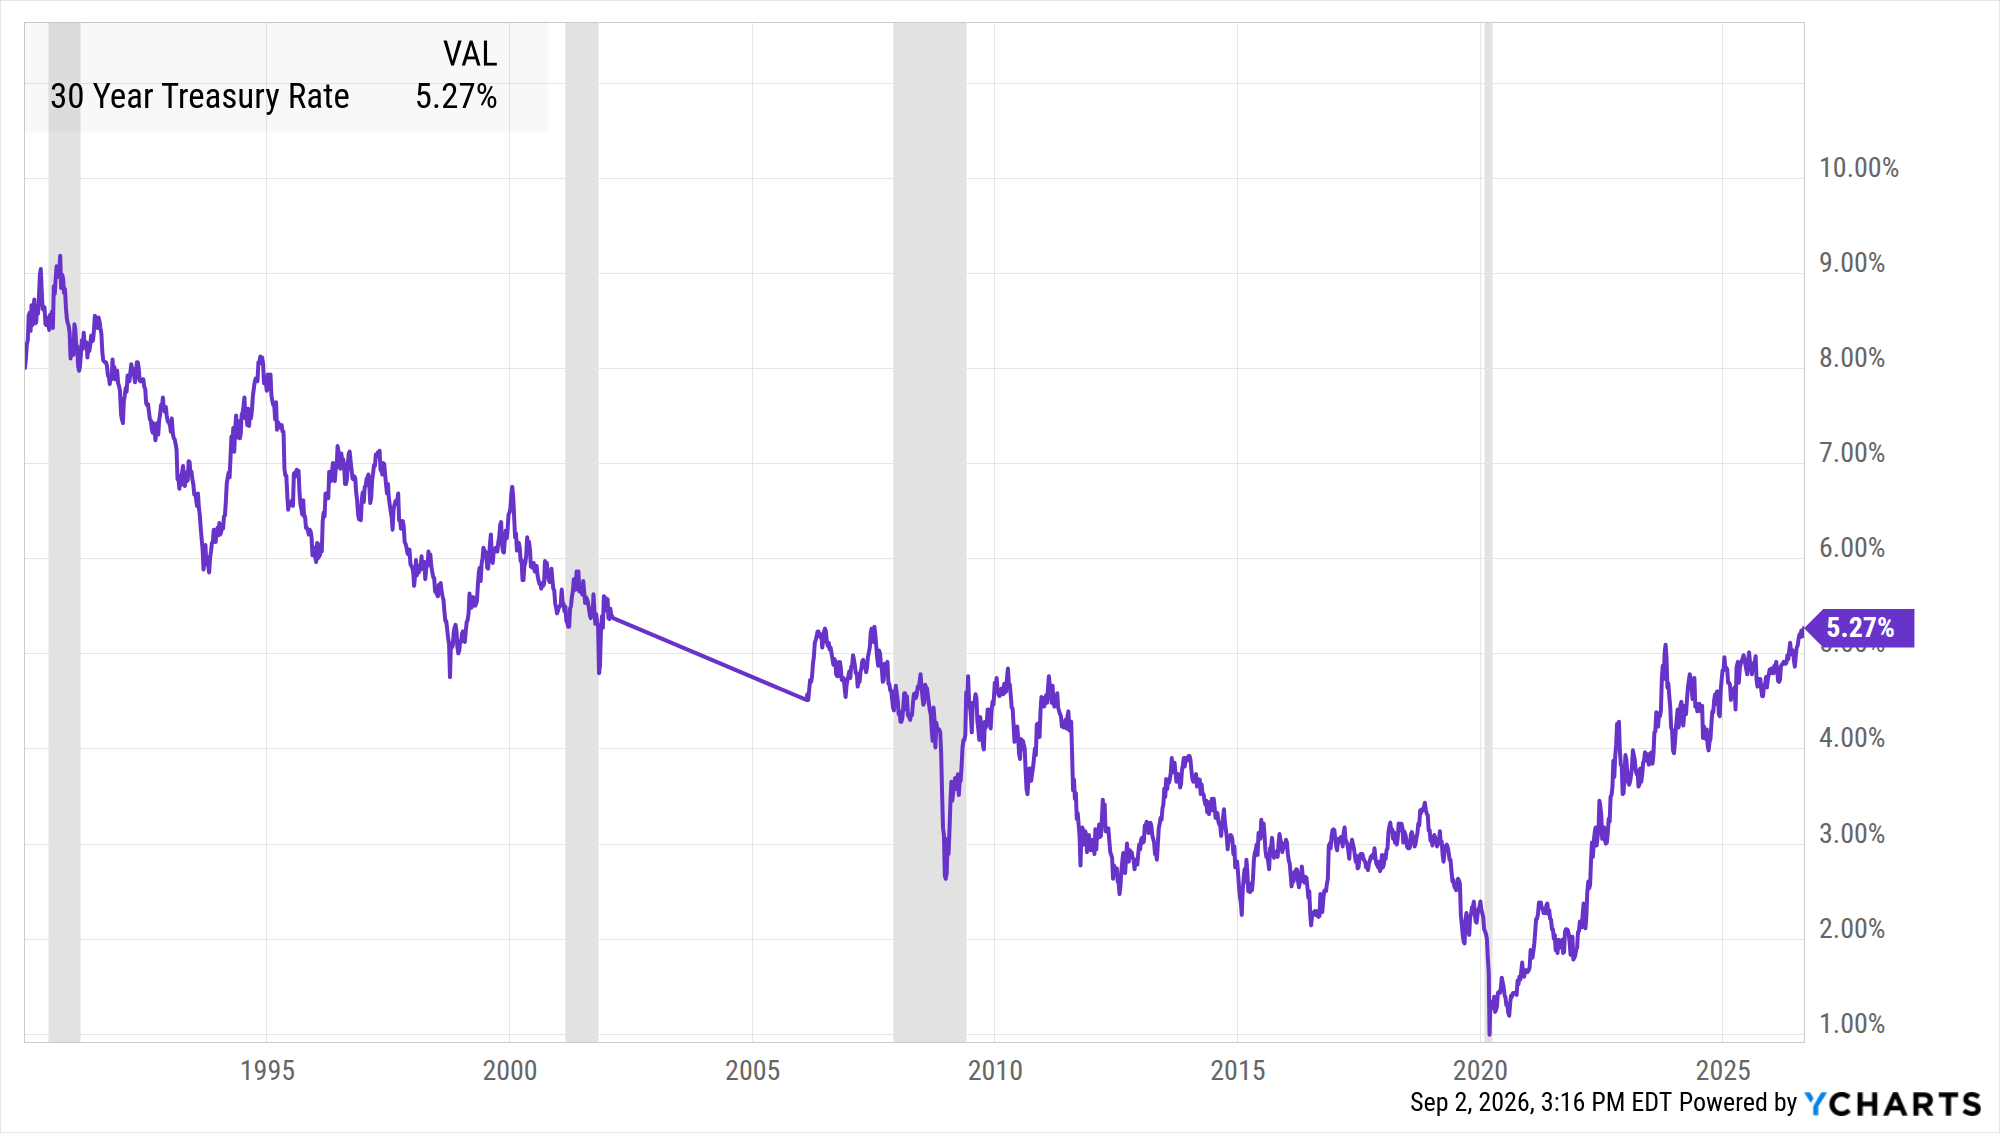
Starting from 1990 puts the current level in its proper context. The long bond peaked at 9.18% in September 1990 and never dropped below 8% that year. Its low came in March 2020 at 0.99%, the only print below 1% in this window. The whole 1990 to 1997 stretch sits above where the rate is today. Since the series resumed in 2006, the only period that reached today’s level is 2006 into 2007, and the current 5.27% sits right at the edge of it. The gap in between is not a data error: Treasury suspended 30-year issuance and the series goes dark from 2002 until 2006.
Clients who anchored their expectations during the 2010s are working from numbers that no longer exist. In high-quality fixed income the yield at purchase does most of the work in setting the return that follows, because the coupon is contractual and the price effect washes out as bonds mature. A client putting money to work today starts from 5.27% instead of 0.99%. The chart makes that argument before you say a word.
The Price Fell. The Income Did Not.
This next chart answers the client’s actual question more directly than any yield comparison can. It shows iShares Core US Aggregate Bond ETF (AGG) price return against total return over five years. That window puts 2022 fully in frame, the year AGG returned -13.03% and investment-grade bonds posted their worst calendar year in modern history.
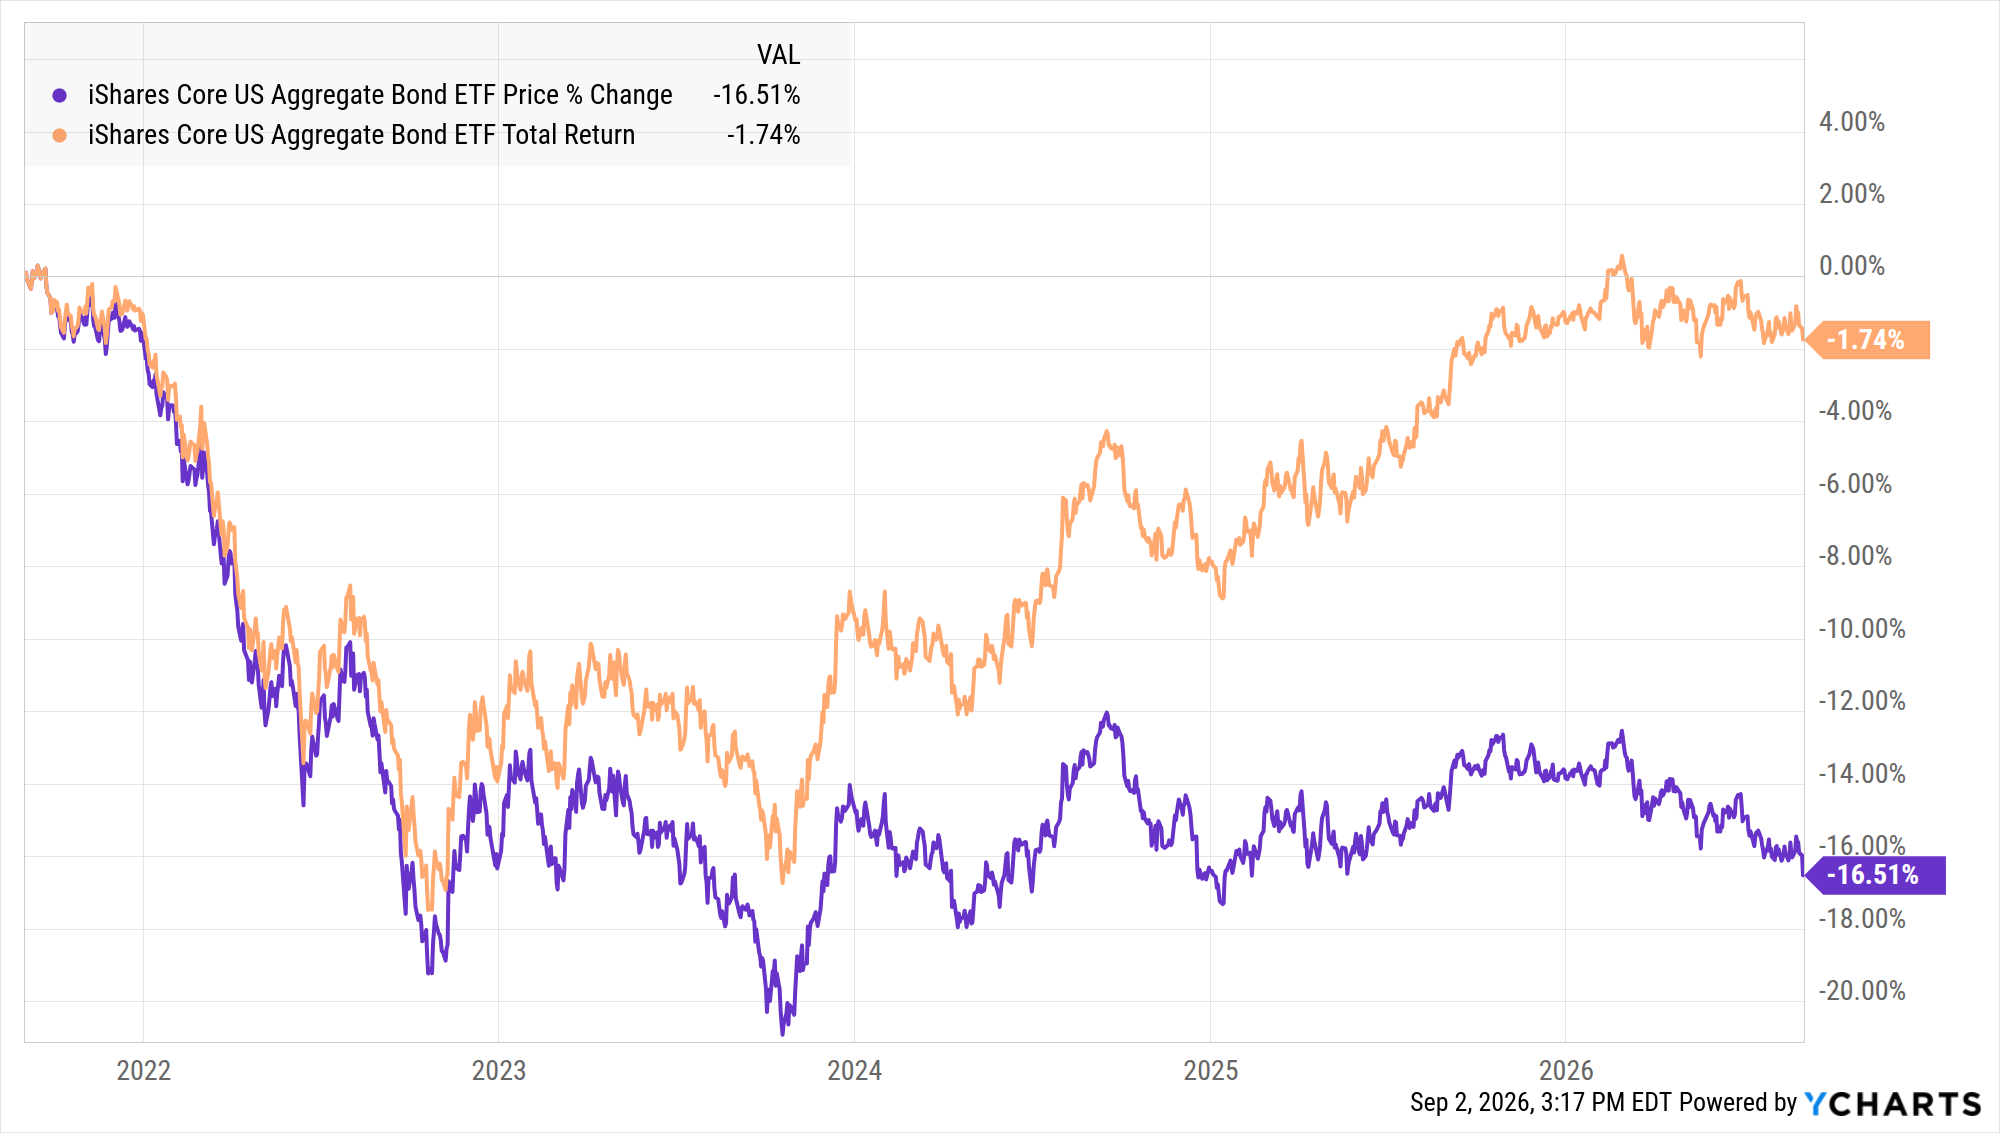
The gap between the two lines is the income. Over the past five years AGG’s price return is -16.51%. Its total return over the same period is -1.74%. Coupon payments absorbed 14.8 percentage points of that price decline. That is what income does in a rate-driven drawdown, and most clients have never seen it displayed this way.
Reframe Two: Give Them One Sentence About Duration
Clients do not want to hear that the loss is temporary. They want to know how big it can get.
Duration answers that. A bond fund with an effective duration of six loses roughly 6% of its price for every 100 basis point rise in rates, and gains roughly the same when rates fall.
That is one sentence, and it survives the drive home. It does more work than any amount of reassurance because it replaces an unbounded fear with a bounded number.
The table below shows effective duration, SEC yield, one-year total return, and expense ratio for six funds. Five of them sit between 5.57 and 6.75. One of them, TLT, sits at 14.88, which means the same 100 basis point move implies roughly 15% rather than roughly 6%. The difference between those two numbers is the entire duration lesson, visible in a single row comparison.
| Fund | Effective Duration |
SEC Yield |
1-Year Total Return |
Expense Ratio |
|---|---|---|---|---|
| AGGiShares Core US Aggregate Bond ETF | 5.75 | 4.68% | +1.59% | 0.03% |
| BNDVanguard Total Bond Market ETF | 5.80 | 4.66% | +1.56% | 0.03% |
| VCITVanguard Intermediate-Term Corp Bond ETF | 5.90 | 5.39% | +1.50% | 0.03% |
| BONDPIMCO Active Bond ETF | 6.75 | 5.07% | +2.54% | 0.54% |
| IUSBiShares Core Universal USD Bond ETF | 5.57 | 4.84% | +1.89% | 0.06% |
| TLTiShares 20+ Year Treasury Bond ETF | 14.88 | 5.16% | -0.74% | 0.15% |
Source: YCharts as of September 2, 2026. Past performance is no guarantee of future results.
The same split shows up in drawdowns. AGG is 19.10% off its all-time price high. TLT is 52.29% off its own. One rate environment, and a gap of more than 33 percentage points that duration alone accounts for.
A generic duration example is useful. The client’s own portfolio is persuasive. YCharts Hypothetical Scenarios shocks their actual holdings at their actual duration and shows both directions at once.
Build this comparison in YCharts
Reframe Three: Name What Cash Is Costing Them
Clients sitting in money market funds have been comfortable, and that comfort has a price. Put the 3-Month Treasury Bill Rate next to the 30-Year Treasury Rate over the past 10 years and the size of that price becomes visible.
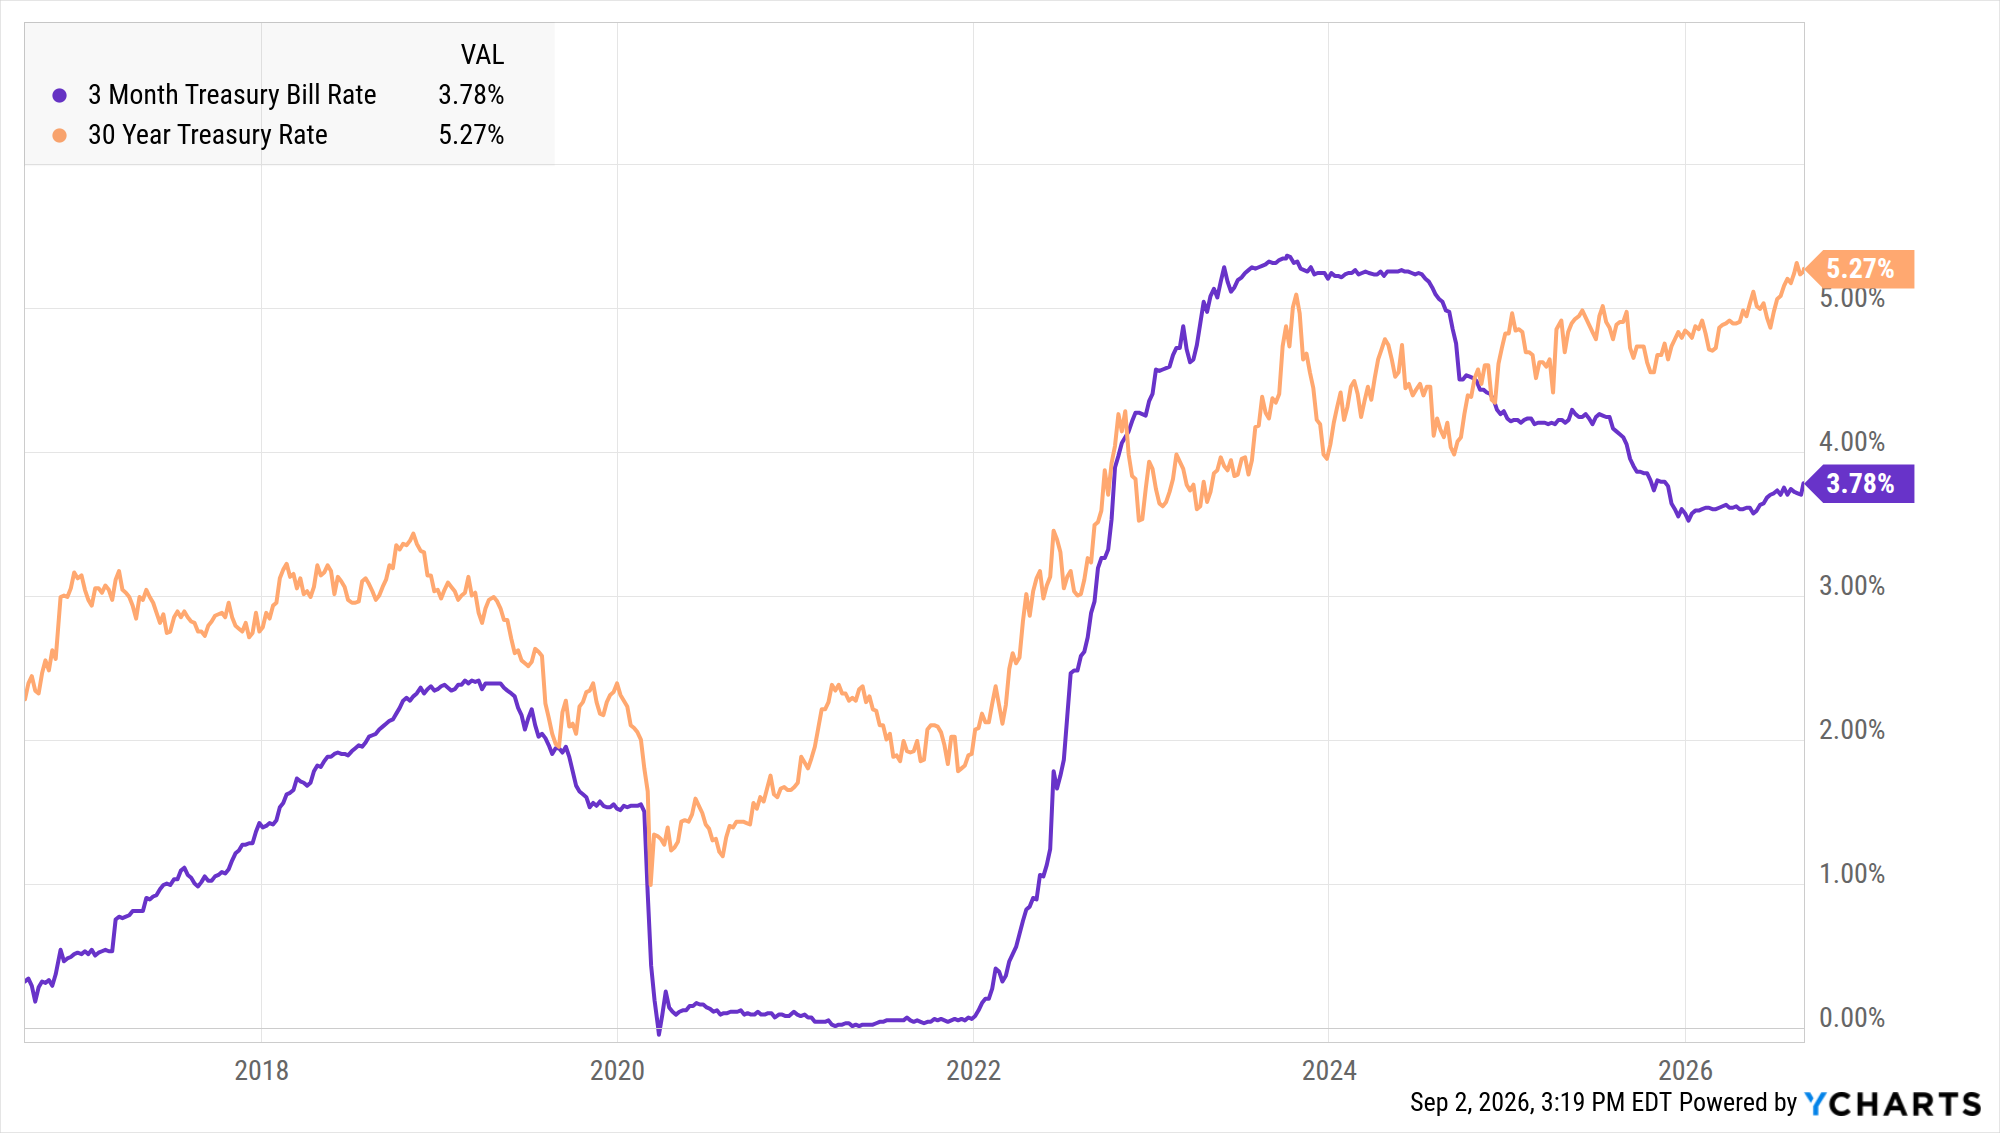
Reinvestment risk stops being theoretical here. The 3-Month Treasury Bill Rate is 3.78%, down from 5.21% in mid-2024. That is 143 basis points of yield that has already left the bill market while clients sat in it. The 30-Year is at 5.27%, a spread of 149 basis points above cash. The same chart shows 2020 and 2021, when the 3-Month sat at essentially zero for two straight years.
The client who stays in cash is giving up that spread and carrying reinvestment risk on top of it. If the Federal Reserve cuts at or after the September 15 and 16 FOMC meeting, which comes with a Summary of Economic Projections, the front end reprices again and the client has locked in nothing. Point to the 2020 and 2021 stretch on this chart and ask whether that felt comfortable at the time.
Turning the Statement Into a Meeting
- Book the review with a reason. Build the review in YCharts PDF Reports so the client leaves with a document rather than a memory.
- Reach out before the decision, not after. Every chart above is a shareable link. Send one with two sentences of context before the September 15 and 16 FOMC meeting and you have framed the move before the client has a reason to worry about it.
- Harvest losses in the bond sleeve. Screen candidates using the YCharts Fund Screener, document the comparison in a YCharts Comparison Table, and put it in the client file. Wash sale rules apply.
Frequently Asked Questions
Why do bonds lose value when interest rates rise?
A bond’s coupon is fixed. When new bonds offer higher yields, existing lower-coupon bonds must fall in price until their yield is competitive. The AGG five-year price and total return chart above shows what that repricing looks like over a full rate cycle: a price return of -16.51% against a total return of -1.74%.
What does duration mean for a bond portfolio?
Effective duration estimates price sensitivity to rate changes. A duration of six implies roughly a 6% price move for every 100 basis point change in rates. The duration comparison table above shows AGG at 5.75 and TLT at 14.88, so the same 100 basis point move implies roughly 6% for one and roughly 15% for the other.
Can you tax-loss harvest bonds?
Yes, in taxable accounts. Advisors commonly swap into a fund with comparable duration and credit quality to preserve exposure while realizing the loss. Wash sale rules apply, and the specifics belong with the client’s tax professional.
How high can bond losses get?
Multiply effective duration by the expected rate move. A duration of six against a 100 basis point rise implies roughly a 6% price decline. AGG is currently 19.10% off its all-time price high and TLT is 52.29% off its own, in the same rate environment.
What is reinvestment risk?
Reinvestment risk is the risk that when a short-term instrument matures, the rate available to reinvest has declined. The 10-year chart above shows the 3-Month Treasury Bill Rate falling from 5.21% in mid-2024 to 3.78% today, and sitting at essentially zero through 2020 and 2021.
Next Article
Are Gen Z Investors Confusing the Stock Market with the Casino?Read More →