How 3 Stocks Drove 49% of the S&P 500’s Gains in 1H 2024
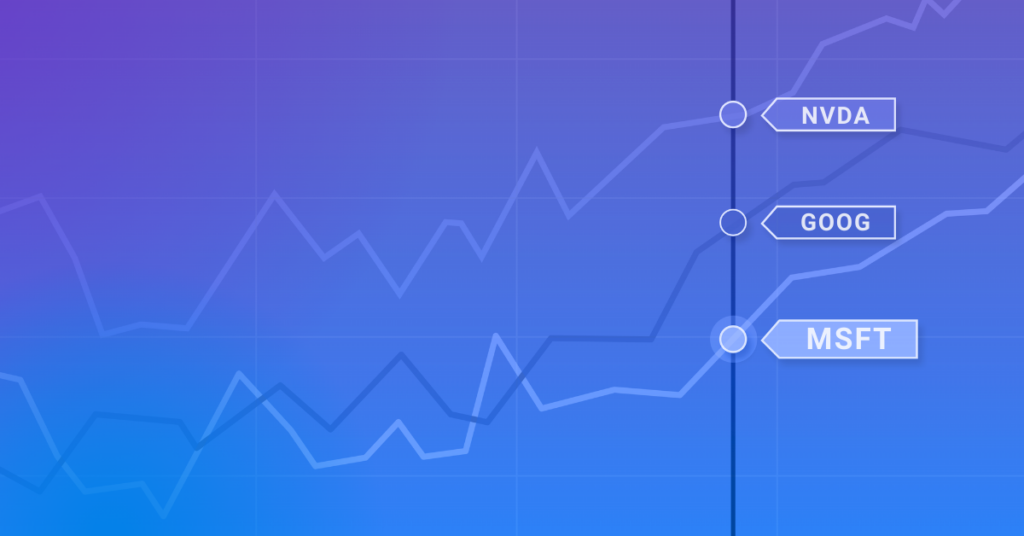
You’ve heard of the “Magnificent Seven” stocks: seven names that have carried U.S. markets to one new all-time high after another.
But what if you were told that just three of these stocks were responsible for almost half of the S&P 500’s overall gain in 2024?
These seven companies–Apple (AAPL), Amazon (AMZN), Alphabet (GOOG, GOOGL), Meta Platforms (META), Microsoft (MSFT), NVIDIA (NVDA), and Tesla (TSLA)–are up a collective 31% in the first six months of 2024, compared to 7.4% for the rest of the index (the “S&P 493”). The overall S&P 500 has risen 14.5%.
However, NVIDIA, Alphabet, and Microsoft collectively posted a 49.3% gain between January and June 2024, adding around $2.85 trillion in market cap. The S&P 500 overall gained $5.8 trillion of market cap in the first six months of the year, meaning these three companies drove 49% of the index’s total gains. (All seven “Magnificent Seven” stocks as a collective accounted for 64.3% of S&P 500 market cap growth for the first half of the year.)
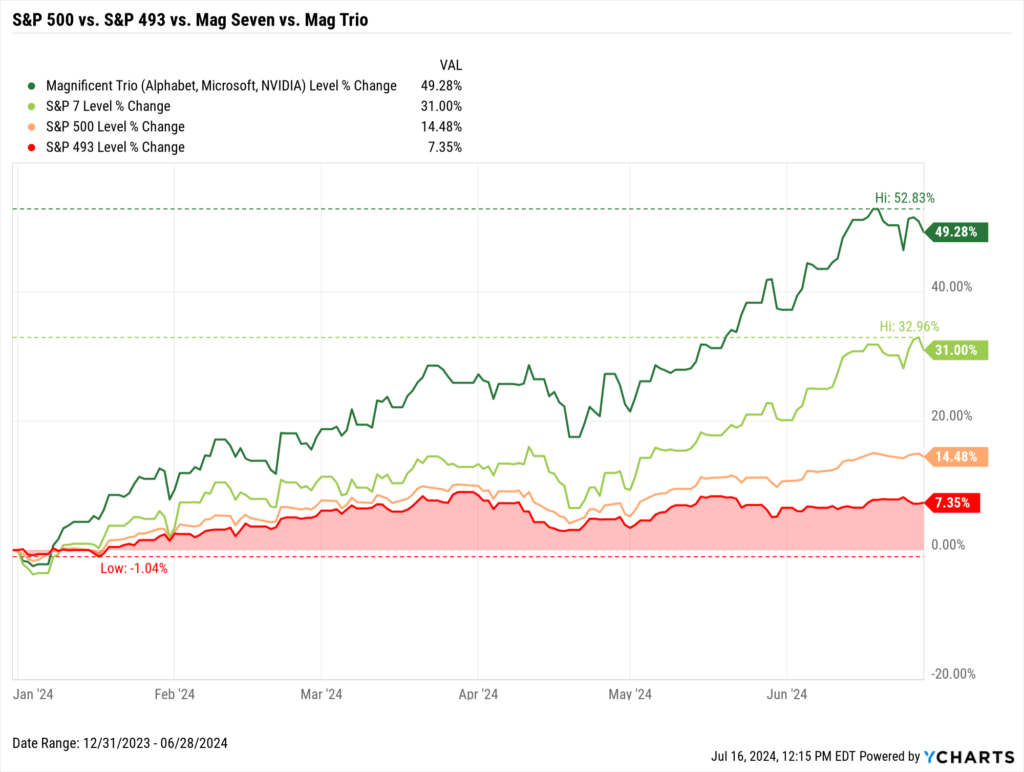
Download Visual | Modify in YCharts | Get in Touch to Access
With large-caps growing larger and more trillion-dollar companies being minted, it begs the question: how concentrated is the U.S. stock market? How concentrated has it become over time, and will this handful of names continue to dominate broader indices?
Individual Magnificent Seven Stock Performance
Below is a Scatter Plot and table showing the first half of 2024 returns for each of the Magnificent Seven stocks, along with the S&P 500, in addition to their respective market capitalizations as of the end of Q2.
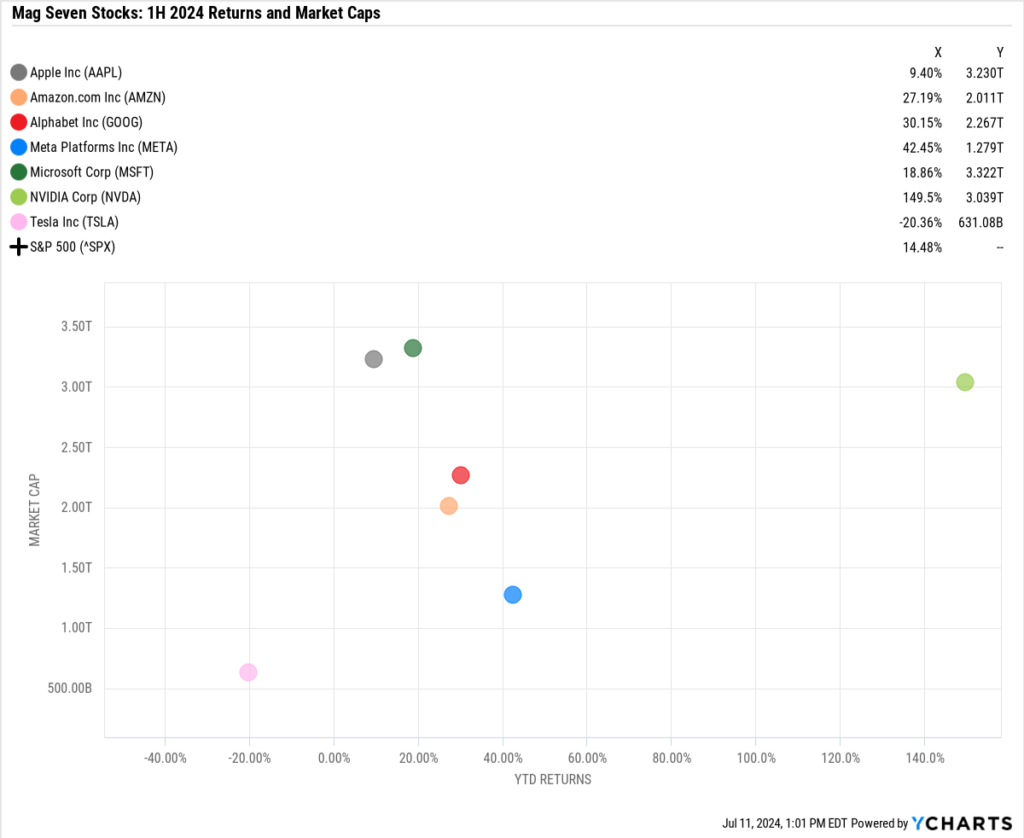
Download Visual | Modify in YCharts
The biggest gainer was NVIDIA, soaring 150% in the first six months of 2024 and above a $3 trillion market cap for the first time. NVIDIA joined Apple and Microsoft as the third member of the $3 trillion club on June 5th, 2024.
Tesla was the only negative performer of the Mag Seven cohort. The electric vehicle maker slumped 20.4% in the first half of 2024, shedding $159 billion of market capitalization in the process.
How Concentrated is the U.S. Stock Market?
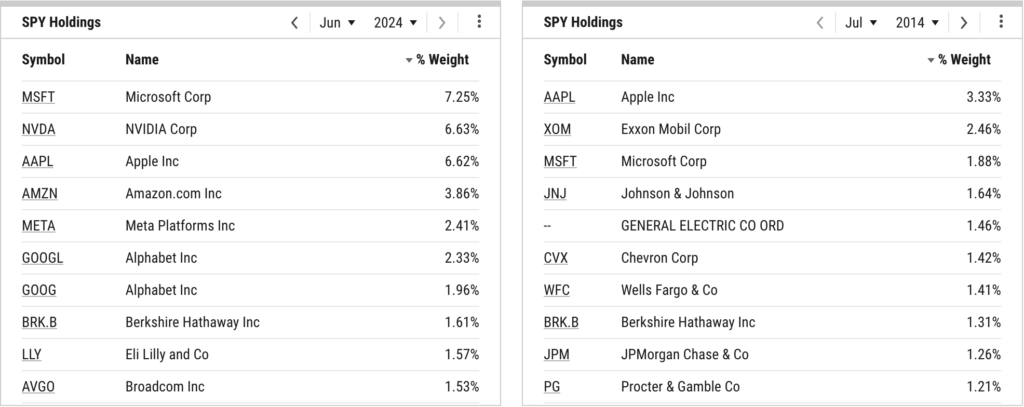
As of June 2024, the top 10 stocks account for 35.8% of the entire U.S. stock market.
Using the Holdings Overlap feature on YCharts, the S&P 500 has become more concentrated in the top names in just the last five years. Represented by SPY, the SPDR S&P 500 ETF, the top 10 stocks comprised 21.6% of the index as of June 2019. Six names have been in the top 10 for the last five years.
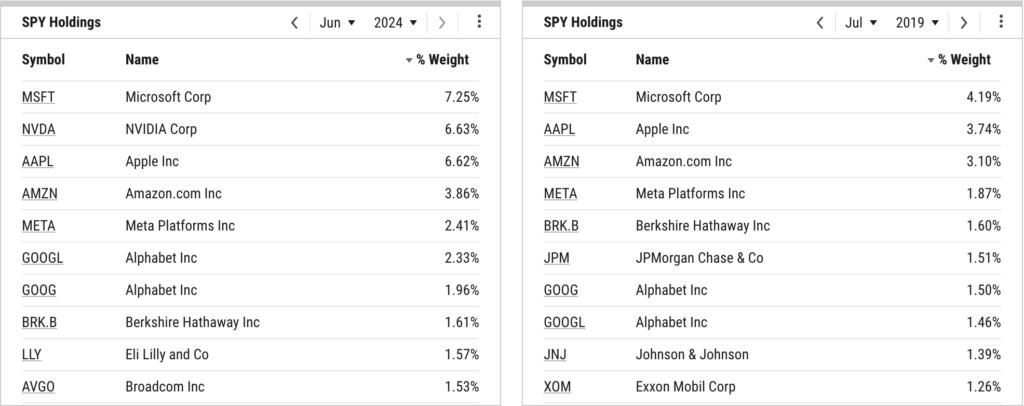
Download Visual | View Historical Holdings Data in YCharts
In the last decade, the U.S. stock market has become twice as concentrated in the top 10 stocks. Ten years ago, 17.4% of the index was concentrated in the top 10 stocks.
Download Visual | View Historical Holdings Data in YCharts
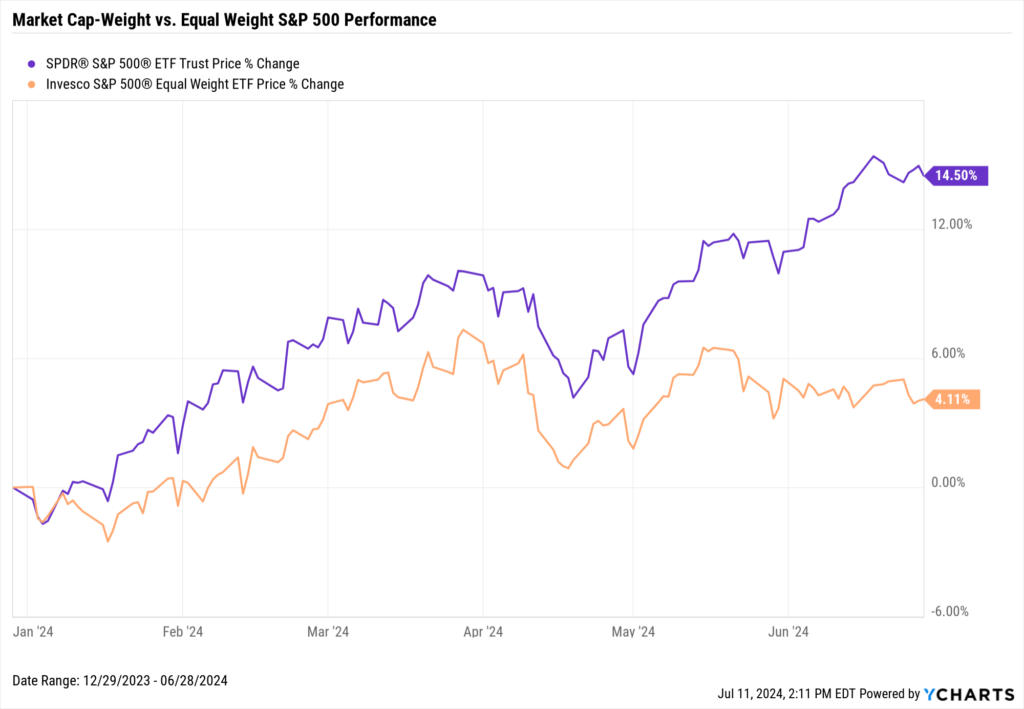
Market Cap-Weighted vs. Equal-Weighted Index Implications
The concentration of the U.S. stock market is especially apparent when comparing market cap-weighted indices to equal-weighted ones.
The S&P 500 is a market cap-weighted index, meaning each of the 500 constituent stocks is weighted according to its total market capitalization.
Advantages of a Market Cap-Weighted Index:
- Reflects the market: A market-cap weighted index mirrors the overall market movements and investor sentiment. Most index funds follow this “mirror” approach, tracking their respective index based on individual constituent weight.
- Less frequent rebalancing: As the market naturally adjusts the weights through price changes, less manual intervention is required.
Disadvantages of a Market Cap-Weighted Index:
- Concentration risk: A few large companies can dominate the index, reducing diversification. There might not be a more perfect example of concentration risk than the present day’s Magnificent Seven storyline.
- Momentum bias: The index tends to allocate more to stocks that have increased in value, potentially buying high and selling low.
There are certain investment vehicles that provide an alternative to investing in a market cap-weighted index. One example is the Invesco S&P 500 Equal Weight ETF (RSP). The chart below is RSP vs. SPY, which illustrates market cap-weighted vs. equal-weight S&P 500 performance for the first six months of 2024:
Download Visual | Modify in YCharts
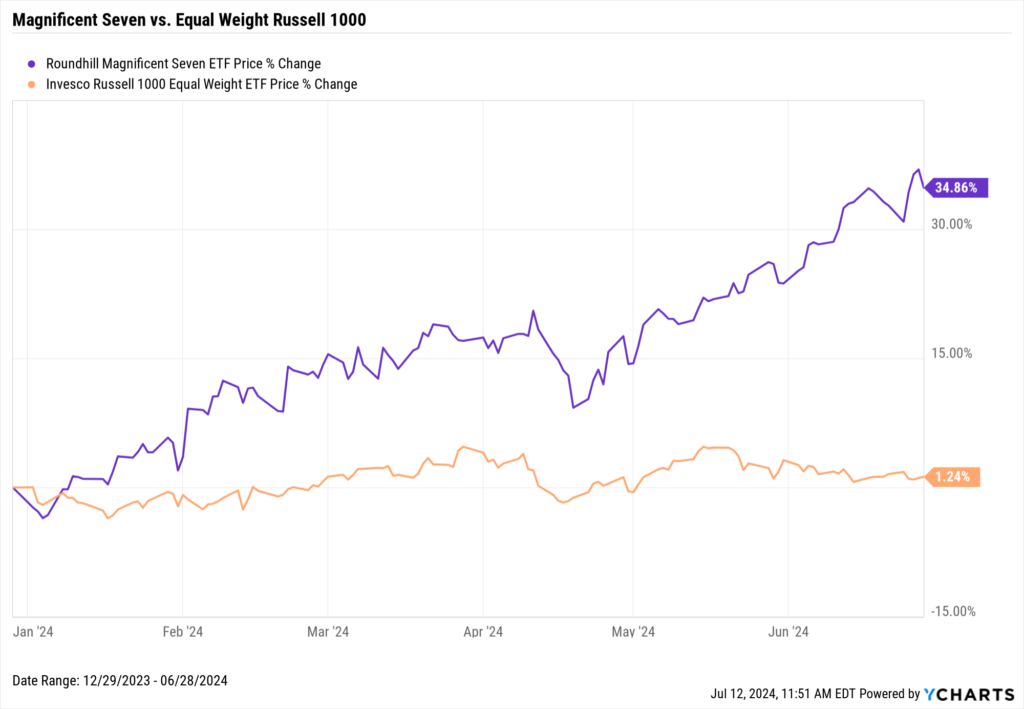
Another example is the Roundhill Magnificent Seven ETF (MAGS) compared to the Russell 1000 Equal Weight ETF (EQAL):
Download Visual | Modify in YCharts
Much like the “S&P 493”, investors who limited exposure to the Magnificent Seven stocks by choosing an equal-weight fund have capped their upside so far in 2024.
And yet, an equal-weight fund only did a mixed job at limiting downside in the last five years.
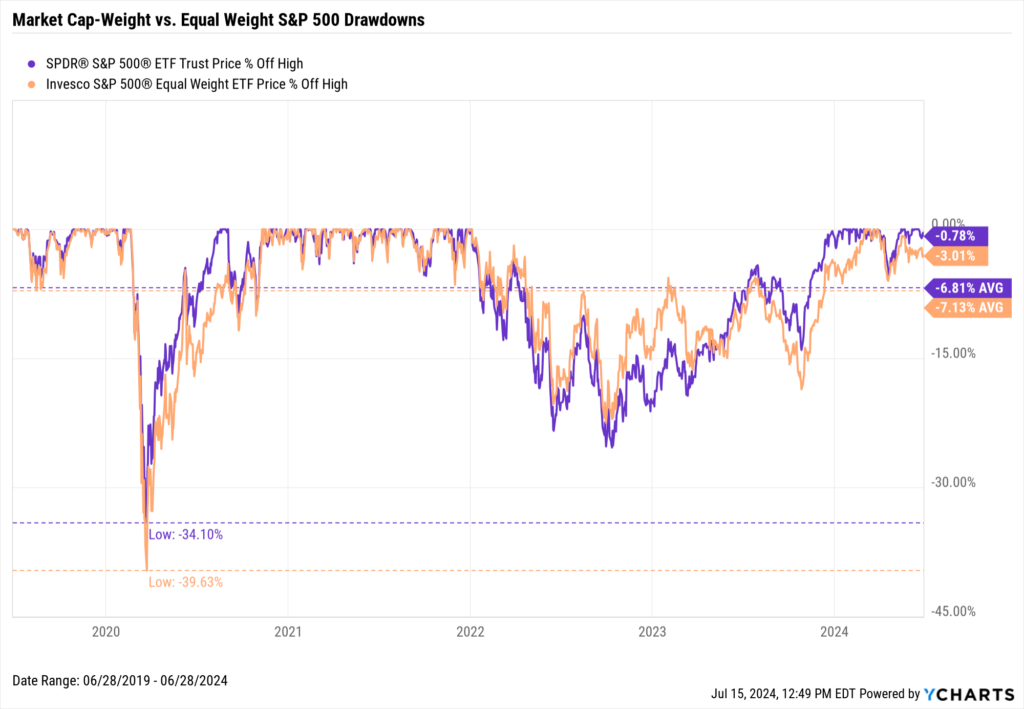
Download Visual | Modify in YCharts
Will the U.S. Stock Market Become More Concentrated?
Based on historical trends, one ought not to rule out the possibility that the market will become more heavily weighted toward a handful of names. The S&P 500 doubled its concentration among the top 10 names in the last 10 years, and that figure accelerated heavily in just the last few years.
One way to increase diversification and mitigate against concentrated company risk is to consider an equal-weight fund or index fund with reduced exposure to mega-cap names. Despite lackluster performance so far this year, adopting one of these strategies would help protect against “putting all eggs in one basket” in case any of these mega-caps falter.
Whenever you’re ready, there are 3 ways YCharts can help you:
1. Looking for a tool that communicates the importance of diversification to clients?
Send us an email at hello@ycharts.com or call (866) 965-7552. You’ll be directly in touch with one of our Chicago-based team members.
2. Want to test out YCharts for free?
Start a no-risk 7-Day Free Trial.
3. Download a copy of The Top 10 Visuals for Client and Prospect Meetings slide deck:
Disclaimer
©2024 YCharts, Inc. All Rights Reserved. YCharts, Inc. (“YCharts”) is not registered with the U.S. Securities and Exchange Commission (or with the securities regulatory authority or body of any state or any other jurisdiction) as an investment adviser, broker-dealer or in any other capacity, and does not purport to provide investment advice or make investment recommendations. This report has been generated through application of the analytical tools and data provided through ycharts.com and is intended solely to assist you or your investment or other adviser(s) in conducting
Next Article
New Broadridge Integration on YCharts: Streamline Your Portfolio Management WorkflowsRead More →