How Oil and Gas Prices Impact the Economy
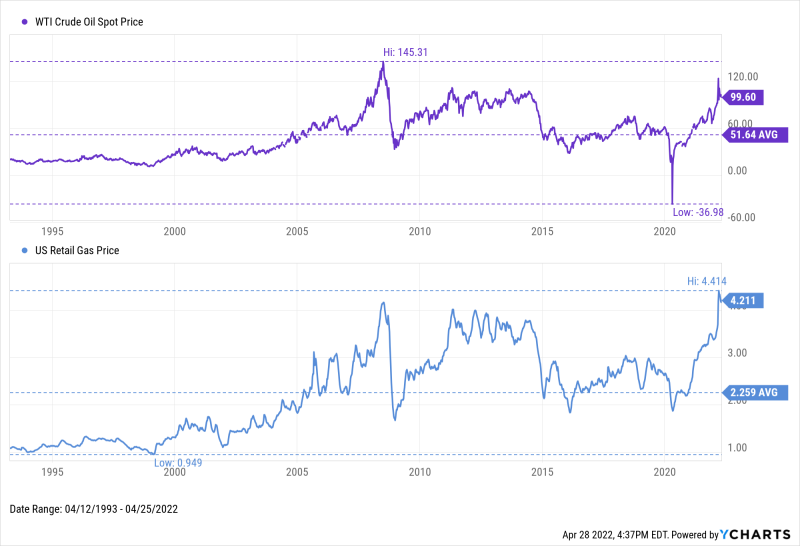
Since 2000, gas prices have exhibited a generally upward trend, with a few major pullbacks, and have also become increasingly volatile. It begs the question: why are gas prices going up all of a sudden? Lately, the conflict between Russia & Ukraine, rising inflation, and a global economic rebound are all combining to drive oil & gas prices to all-time (or at least relative) highs.
On the flip side: when oil prices fall, gas becomes cheaper and it becomes less expensive to operate a manufacturing plant, ship goods around the world, or just fill up the tank.
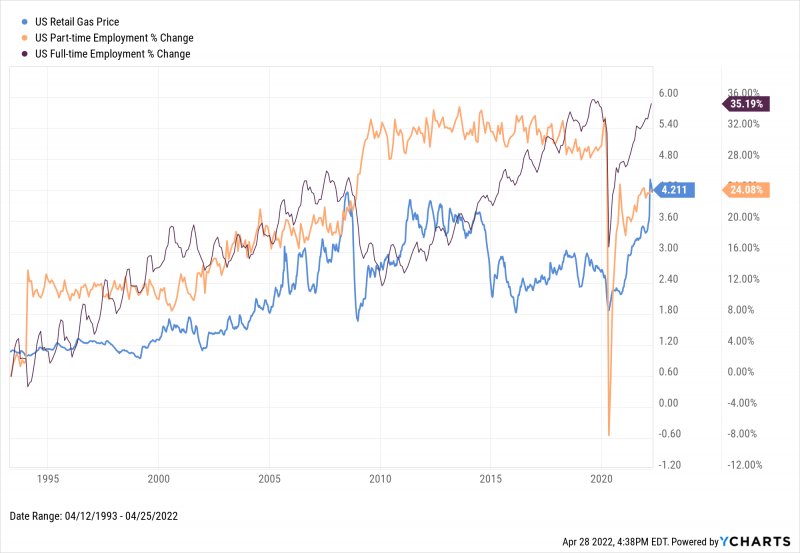
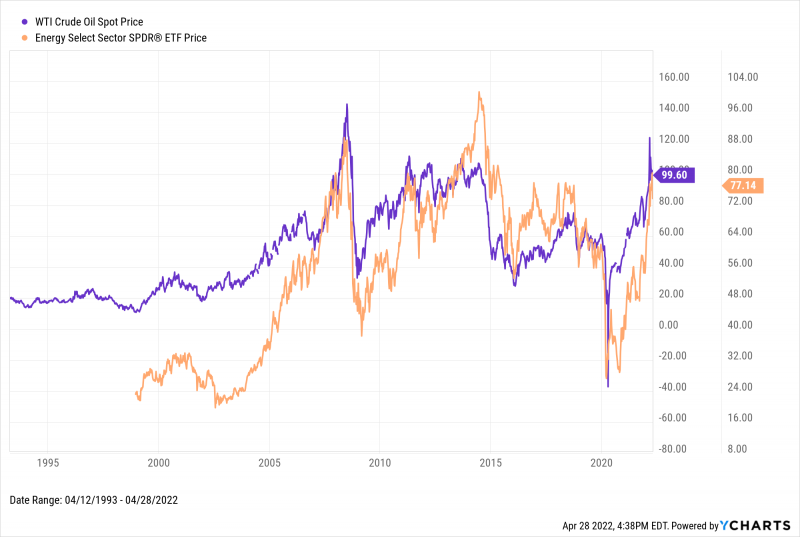
Currently, the price of WTI Crude Oil is hovering above $100 per barrel, which is more than double its 30-year average. The average US Retail Gas Price is also firmly above $4.00 per gallon—a mark it has passed before, but only briefly.
Download Visual | Modify in YCharts
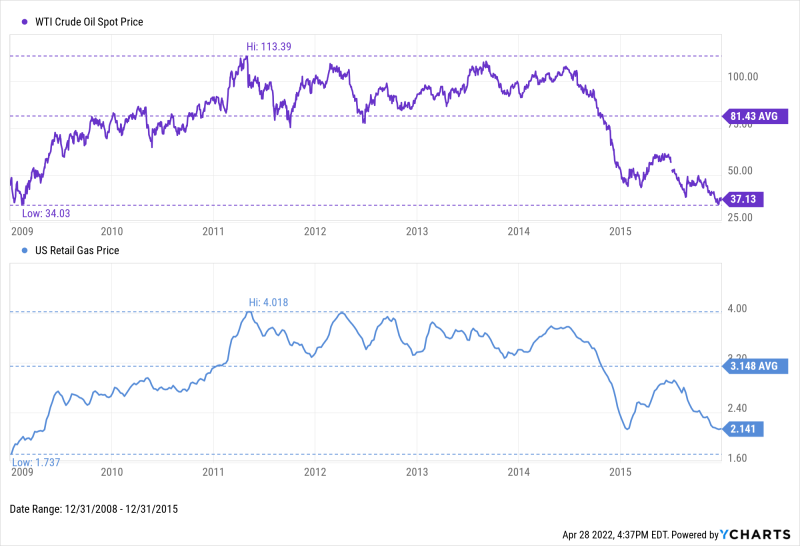
The last time a barrel of oil cost more than $100/barrel and gas stations were charging $4 per gallon was back in 2011, lasting through 2014. In the seven years between 2009 and 2015 when WTI was at $35, the average price of a barrel was $81. That’s $30 higher than oil’s 30-year average price. (And trust us, we won’t be making a 30-for-30 film based on that coincidence.)
Download Visual | Modify in YCharts
With the price of oil over $100 and the average gas price hovering around all-time highs, there are many similarities between 2022 and both 2008 and 2011-2014. We’ll look at several key indicators to explain what happens to certain areas of the economy when gas prices go up.
Inflation
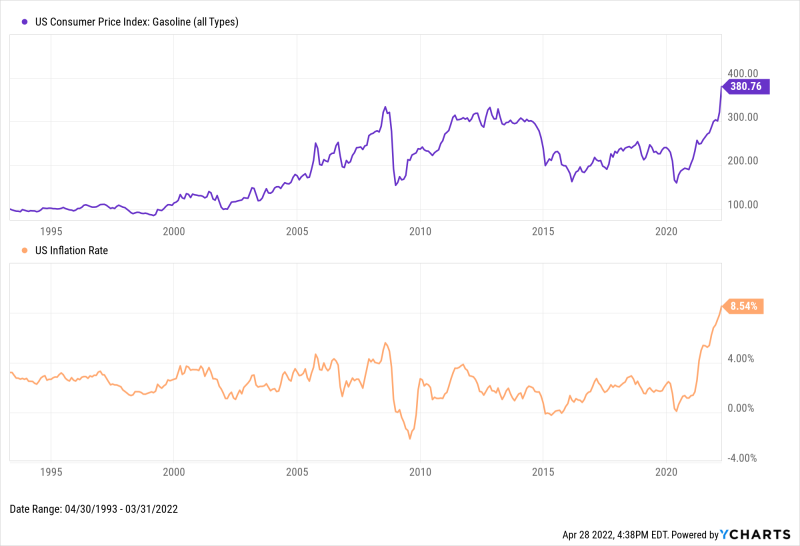
As noted in our Economic Summary Deck for Q1 2022, the biggest driver behind the rising Consumer Price Index is none other than energy prices. The most popular measure of inflation is comprised of a combined 11% energy and gasoline for motor vehicles. Illustrated in the chart below, as goes the price of oil, so goes inflation.
Interestingly, the period from 2010 to 2015 is an exception to this trend. While inflation was cooling down post-Financial Crisis, crude oil prices moved higher than $100 per barrel on several occasions. Now, oil has skyrocketed back into $100/barrel territory, and inflation is moving higher in turn.
Download Visual | Modify in YCharts
Retail Sales
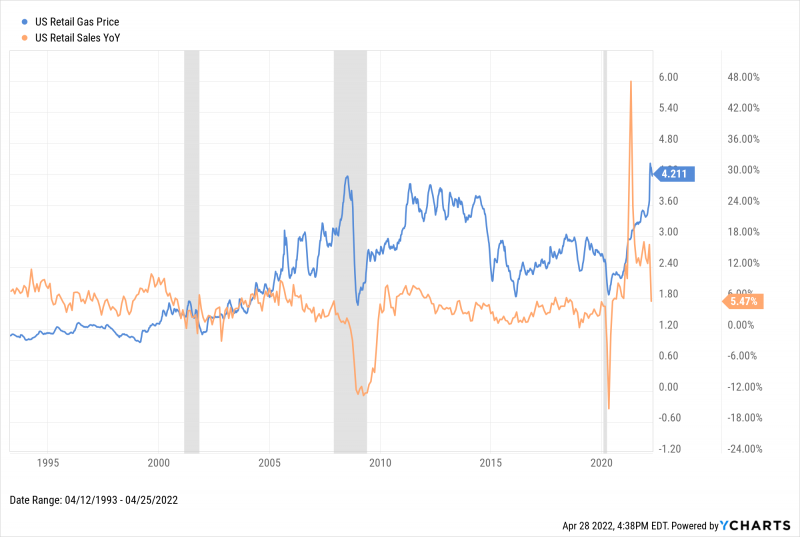
Bigger credit card transactions at the pump have historically meant consumers spend less on retail goods, such as clothes. Not only that, but as seen with the trends in road travel, higher gas prices can lead to foregoing driving to the shopping mall altogether.
When gas prices started taking off in 2005, year-over-year US Retail Sales stumbled, then tumbled all the way through the Financial Crisis of 2008. Even when year-over-year retail sales surged post-recession, gas prices responded quickly and the average American pumped the brakes on discretionary spending. In 2022, gas prices are at new all-time-highs and retail sales are showing signs of weakening.
Download Visual | Modify in YCharts
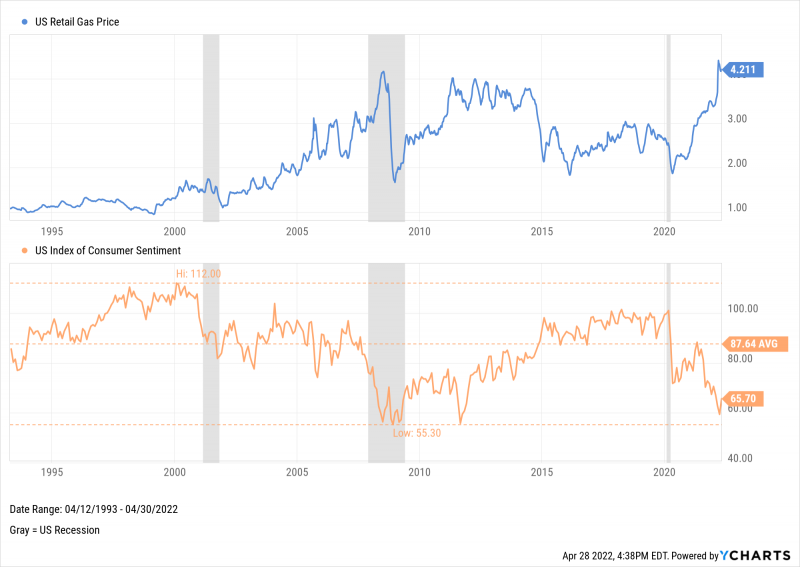
Consumer Sentiment
Like any recession tends to, the economic fallout from the dot-com bubble of 2000 caused US Consumer Sentiment to plummet. But as gas prices rose in the years following that recession, US Consumer Sentiment failed to improve in any meaningful way. The bottom of the 2008 financial crisis corresponded with a bottoming-out of US Consumer Sentiment—at a time when gas prices topped $4.00 per gallon for the first time ever, consumer sentiment was less than half its own all-time high. That low was tested again when gas prices rose in 2011.
In 2022, with gas prices above $4.00 per gallon for the first time in several years, US Consumer Sentiment is once again moving toward its lows.
Download Visual | Modify in YCharts
Airlines
Airline Fuel Consumption
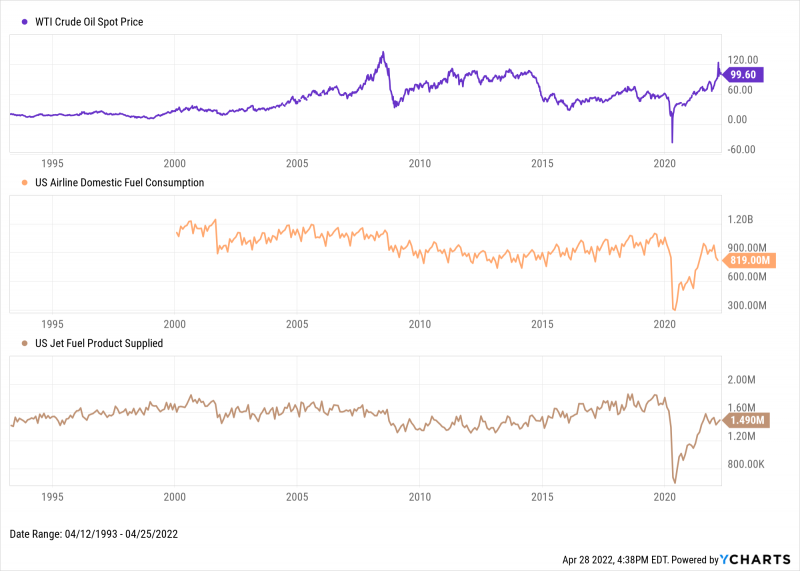
The number one cost that airlines face is not unruly passengers, but fuel prices. Fuel costs account for 10%-12% of an airline’s operating expenses, making it more difficult to fly full schedules and offer affordable fares to travelers.
In 2005, oil prices trended higher and caused airlines to throttle back on the amount of fuel they purchased for domestic flights. The same trend occurred again starting in 2009, when the price of oil shot up over $100 and remained at those levels through 2014. Only in 2015 did airlines start ramping up oil purchases, in response to plummeting prices.
Airline fuel consumption is surging back to pre-pandemic numbers, albeit with a very recent setback, but oil once again costs more than $100 per barrel. This could stunt airlines’ recovery plans, and cause even more headaches for travelers in the future.
Download Visual | Modify in YCharts
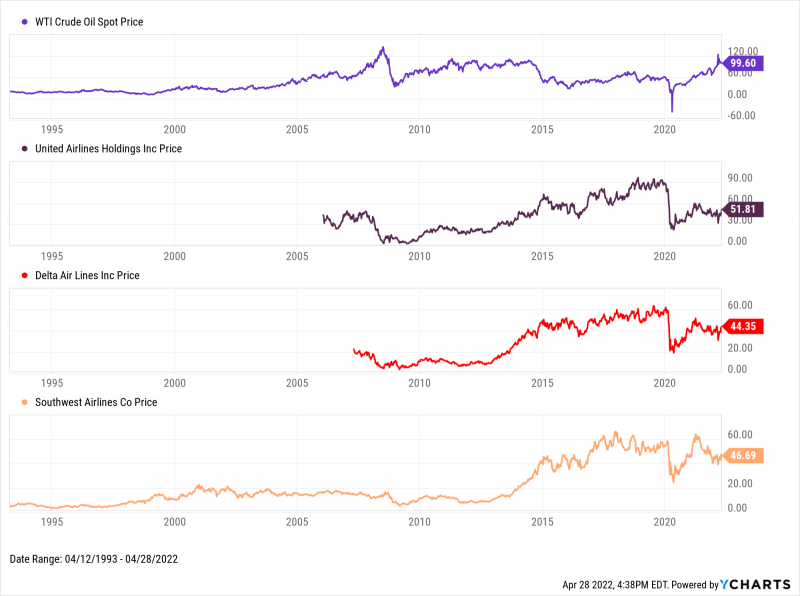
Airline Stocks
Airline stocks are also susceptible to increased oil prices. Just as airlines thought they were recovering post-2008, shares of United Airlines (UAL), Delta Air Lines (DAL) and Southwest Airlines (LUV) all had their growth stunted by high fuel costs in the early 2010s.
Download Visual | Modify in YCharts
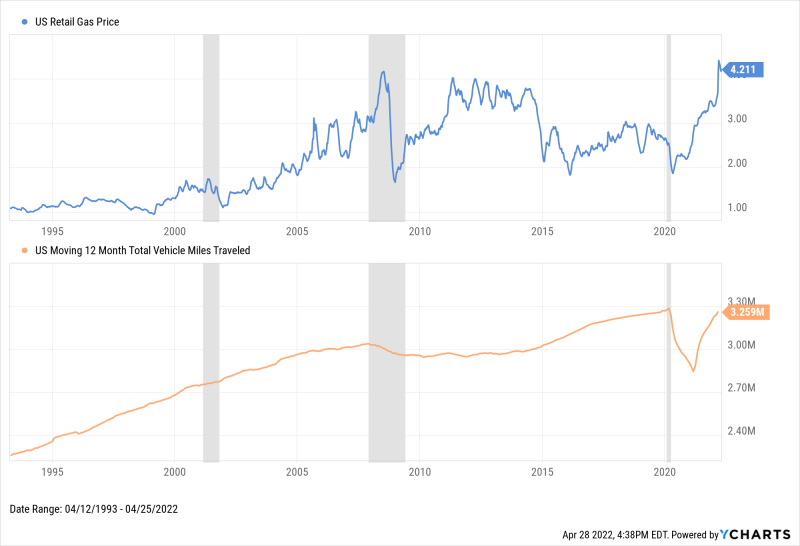
Road Travel
Naturally, higher gas prices mean more expensive road trips and fewer drives to visit the in-laws (bummer!). As evidenced by the average amount of vehicle miles traveled, fewer motorists were willing to pour money into their gas tanks while prices first broke through $4 per gallon in 2011.
It wasn’t until 2015, when both gas prices had tumbled and the US had exited an economic recession, that more drivers got back out on the road. Since 2020, the slowdown (and recovery) in road miles traveled has been much more drastic. As the US attempts to fully recover from the pandemic, but also grappling with all-time high gas prices, will more drivers choose to remain parked at home?
Download Visual | Modify in YCharts
Part-Time Employment
Job creation is one of the most important indicators of an economy’s health.
However, one potential sign of economic tepidness is an increase to Part-Time Employment which stems from rising oil & gas prices. Higher gas prices can lead more people to opt for part-time or seasonal jobs, given the increased costs of both living, and commuting to work. More generally, belt tightening might also force commuters to forego that morning coffee and downtown lunch date, which also have knock-on effects for discretionary sectors of the economy.
Download Visual | Modify in YCharts
Energy Stocks
Needless to say, rising oil & gas prices are a boon for energy stocks. The chart below shows the energy sector, represented by the SPDR Energy Select ETF (XLE), rising and falling in nearly perfect tandem with gas prices.
Notably, energy companies can benefit even more from consistently high oil prices—but sudden drops in the price per barrel leads to an equally quick reaction from energy stocks. XLE investors enjoyed a 165.7% trough-to-peak run (18.4% annualized) from 2009 to 2014 while oil remained above $80 per barrel for the majority of that timeframe.
Download Visual | Modify in YCharts
Conclusion
Given that day-to-day travel plays a big role in our lives, and how we are reminded of rising gas prices by the large plastic numbers displayed on every major intersection, higher prices can directly affect consumer behavior in major ways.
Consumer sentiment, retailers, and the workforce are negatively impacted, as are transportation companies. Fewer drivers hit the road, and airlines are forced to operate under costly conditions. One of the few beneficiaries of higher oil & gas prices is the energy sector, which in the past has proven to be a bright spot for investors, looking to rotate out of cyclically sensitive sectors and combat inflation.
Connect with YCharts
To get in touch, contact YCharts via email at hello@ycharts.com or by phone at (866) 965-7552
Interested in adding YCharts to your technology stack? Sign up for a 7-Day Free Trial.
Disclaimer
©2022 YCharts, Inc. All Rights Reserved. YCharts, Inc. (“YCharts”) is not registered with the U.S. Securities and Exchange Commission (or with the securities regulatory authority or body of any state or any other jurisdiction) as an investment adviser, broker-dealer or in any other capacity, and does not purport to provide investment advice or make investment recommendations. This report has been generated through application of the analytical tools and data provided through ycharts.com and is intended solely to assist you or your investment or other adviser(s) in conducting investment research. You should not construe this report as an offer to buy or sell, as a solicitation of an offer to buy or sell, or as a recommendation to buy, sell, hold or trade, any security or other financial instrument. For further information regarding your use of this report, please go to: ycharts.com/about/disclosure
Next Article
Inverted Yield Curve, Chinese Stocks, Bond ETF Yields | What's Trending on YCharts?Read More →