How to Effectively Communicate Tax Savings to Your Clients
As the year winds down, advisors are gearing up to perform critical end-of-year tasks for their clients. These include identifying tax-loss harvesting opportunities, generating client portfolio statements, and testing model strategies ahead of the new year.
To help advisors optimize tax-efficient investment strategies and communicate tax savings to their clients, YCharts put together our latest guide: How Advisors Use YCharts to Save Clients Money on Taxes. This guide aims to help save advisors time and make more impactful communication when it comes to tax-efficient investing.
Download the Guide for more tips:Illustrate Long-Term Impacts of Tax Burdens with Scenarios
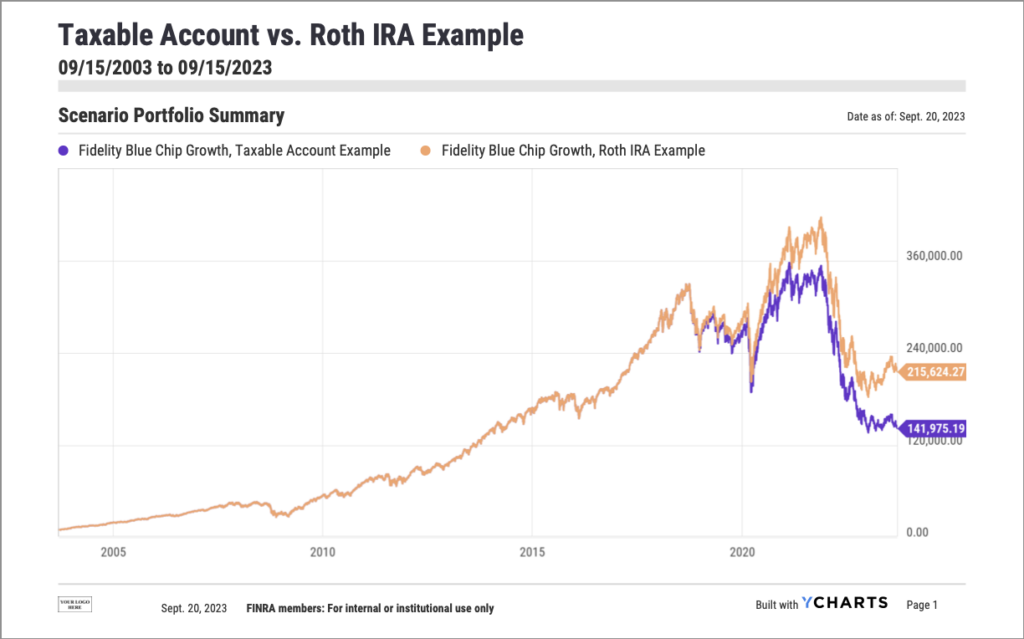
We used YCharts Scenarios to visualize the following hypothetical investment lifecycle scenario.
Suppose you had a client named Mary who was 15 years away from retirement in September 2003. Mary invested $10,000 in Fidelity’s Blue Chip Growth (FBGRX) fund and contributed $500 monthly for the next 15 years. By September 2018, Mary would have contributed $100,000, and that investment would have grown to $328,961.
Then Mary, who pays an effective tax rate of 15%, entered retirement and sought to withdraw $5,000 monthly for the first five years.
If Mary contributed to a Roth IRA for those 15 years, she could simply withdraw $5,000 each month tax-free. However, if Mary had used a taxable brokerage account instead, she would need to withdraw $5,882 monthly to cover the tax liability and still meet that $5,000 monthly income goal.

By choosing a taxable investment vehicle such as a brokerage account, Mary would have an account balance of nearly $74,000 lower at the end of the 20 years versus the tax savings from a Roth IRA.
This is where visually illustrating the power of compounding returns combined with tax management strategies to clients is so critical. You are doing the hard work to invest wisely for clients like Mary; Scenarios enable you to effectively communicate the value you provide as an advisor by modeling future expected outcomes to ensure your clients achieve their financial aspirations.
Visualize Tax-loss Harvesting Opportunities
Tax-loss harvesting offers a way to salvage some value from losing positions by using capital losses to offset gains and ordinary income. This strategy can ultimately lead to a lower tax bill for a client like Mary during tax season.
YCharts makes it easy to take advantage of tax-loss harvesting opportunities all year round. For example, opening a Watchlist, Comp Table, or Model Portfolio onto a Fundamental Chart shows individual holding performance over time. The Fundamental Charts tool makes it quick and easy to visually identify which holdings are the most ripe for tax-loss harvesting.

Whenever you’re ready, there are 3 ways YCharts can help you:
1. Have questions about how YCharts can help you prepare for client meetings?
Send us an email at hello@ycharts.com or call (866) 965-7552. You’ll be directly in touch with one of our Chicago-based team members.
2. Want to test out YCharts for free?
Start a no-risk 7-Day Free Trial.
3. Download a copy of How Advisors Use YCharts to Save Clients Money on Taxes:
Disclaimer
©2023 YCharts, Inc. All Rights Reserved. YCharts, Inc. (“YCharts”) is not registered with the U.S. Securities and Exchange Commission (or with the securities regulatory authority or body of any state or any other jurisdiction) as an investment adviser, broker-dealer, or in any other capacity, and does not purport to provide investment advice or make investment recommendations. This report has been generated through application of the analytical tools and data provided through ycharts.com and is intended solely to assist you or your investment or other adviser(s) in conducting investment research. You should not construe this report as an offer to buy or sell, as a solicitation of an offer to buy or sell, or as a recommendation to buy, sell, hold or trade, any security or other financial instrument. For further information regarding your use of this report, please go to: ycharts.com/about/disclosure
Next Article
Q3 2023 Fund Flows: The Biggest Inflows and Outflows of the QuarterRead More →
