How to Tailor Financial Advice with the Scenarios Tool
Picture this: You’re sitting across from Jane and John Doe, a young couple with a new baby, with ample earnings but limited financial knowledge. They’re eager to secure a future for their child, yet they’re apprehensive about investment risks and market fluctuations.
In another meeting, you’re discussing with the Robinsons, a middle-aged couple anxious about retirement and also the prospect of financing college for their two kids. They’re wondering how these future expenditures could impact their own financial stability and if they’ll be able to meet their retirement goals amidst these added financial obligations.
Then there’s Mr. Thompson, a soon-to-be single retiree who’s unsure about his withdrawal rates and the sustainability of his retirement fund.
These are everyday situations to find yourself in as a financial advisor, where your most significant challenge is effectively communicating financial concepts and strategies to clients across various stages of their investment lifecycle.
How do you guide them effectively through their unique journeys? How do you convince your clients to start investing early, stay the course during market fluctuations, and plan their retirement effectively?
Enter YCharts’ Scenarios – a powerful tool designed to transform these intricate discussions into simple, visual, and compelling narratives. Let’s explore how this tool can revolutionize your advisory practice and enable you to better navigate the impact of financial decisions made by those like the Does, the Robinsons, and Mr. Thompson.
Unfolding the Impact of Starting to Invest Early
Convincing clients like the Doe couple to stay invested or kick-start their investment journey in 2022 was no small feat. Yet, as Nick Magulli, COO of Ritholtz Wealth Management highlighted, those who used dollar cost-averaging during 2022 would have experienced a considerably cushioned downturn.
Start a Free Trial to Build Scenarios
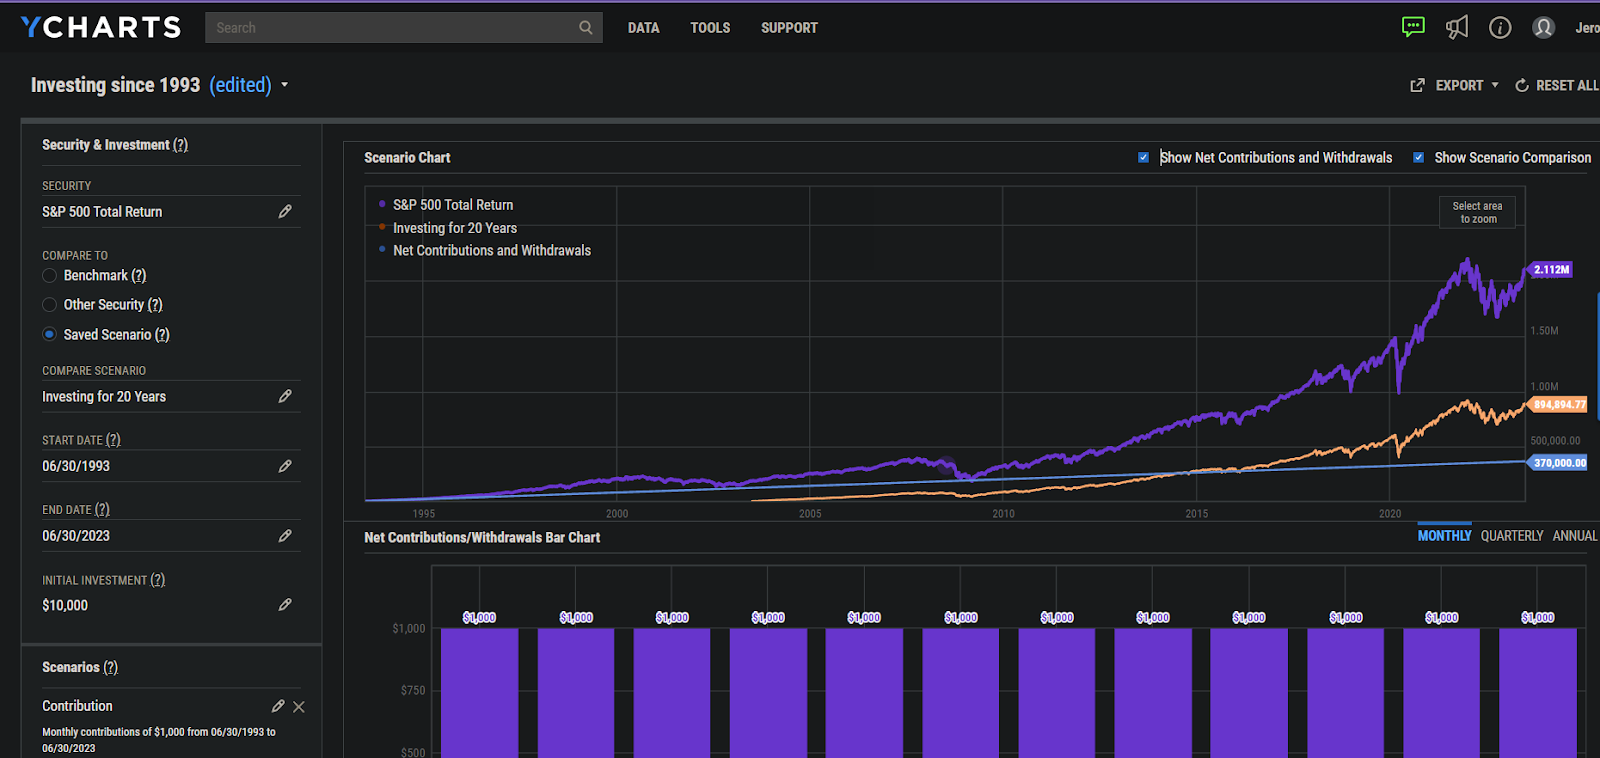
The Scenarios tool visually stresses the importance of early investing. Imagine two investors: one who invested $10,000 in 1993 and consistently contributed $1,000 monthly. Fast forward to today, and their portfolio value exceeds $2 million. If another investor adopted the same strategy but began a decade later, their portfolio wouldn’t reach a million. This scenario illustrates the challenge of playing catch-up.
Start a Free Trial to Build Scenarios
Showcase the Power of Consistent Investment during the Accumulation Stage
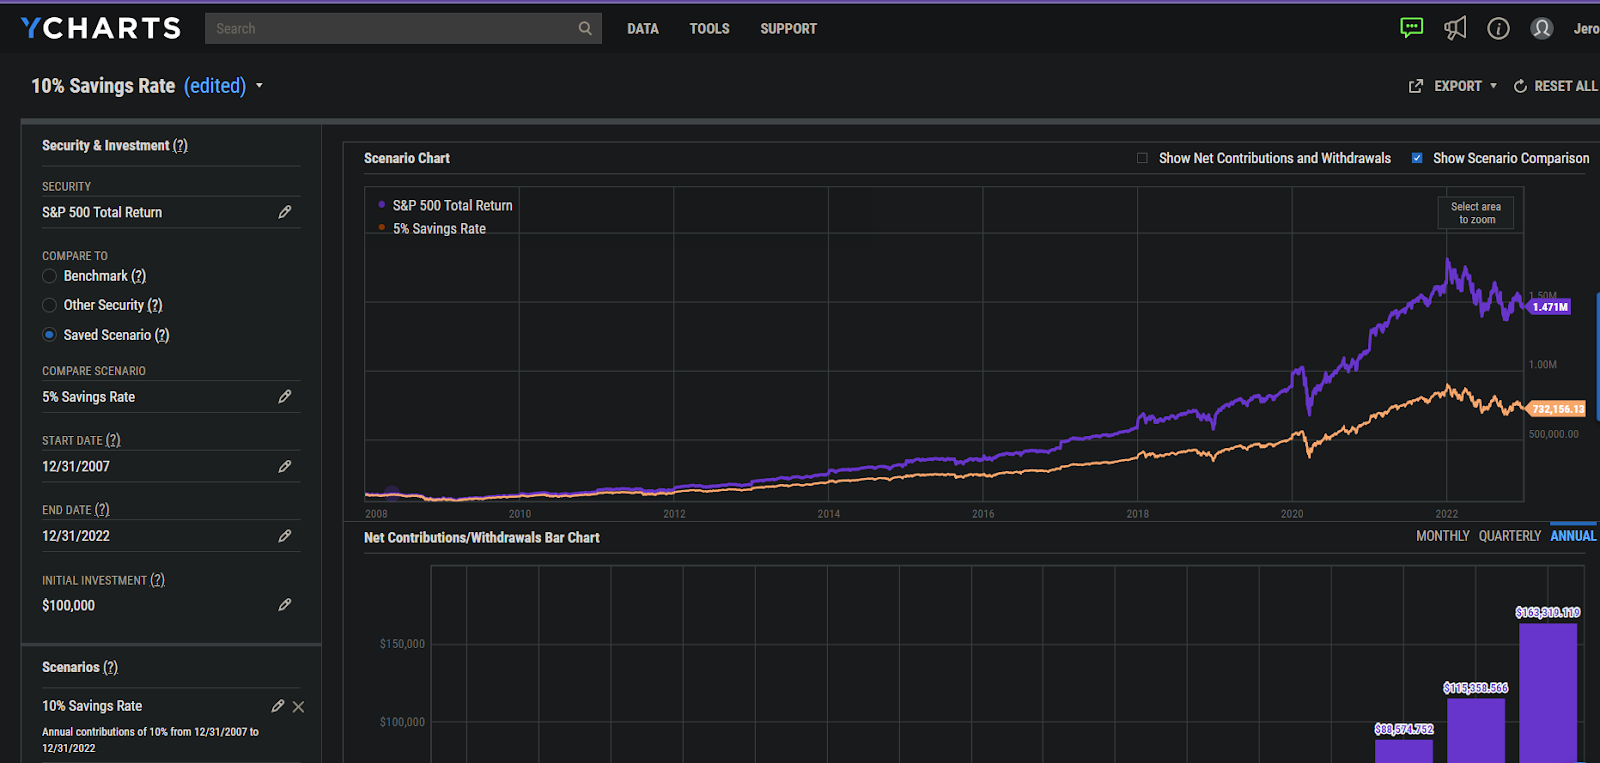
The Robinsons aim to accumulate $1 million for their retirement, but they also need to put aside funds for their children’s college education. If they continue to save at a rate of 10% annually, tracking the S&P 500 from the end of 2007 to 2022, they’ll meet their retirement goal in just under 15 years.
Start a Free Trial to Build Scenarios
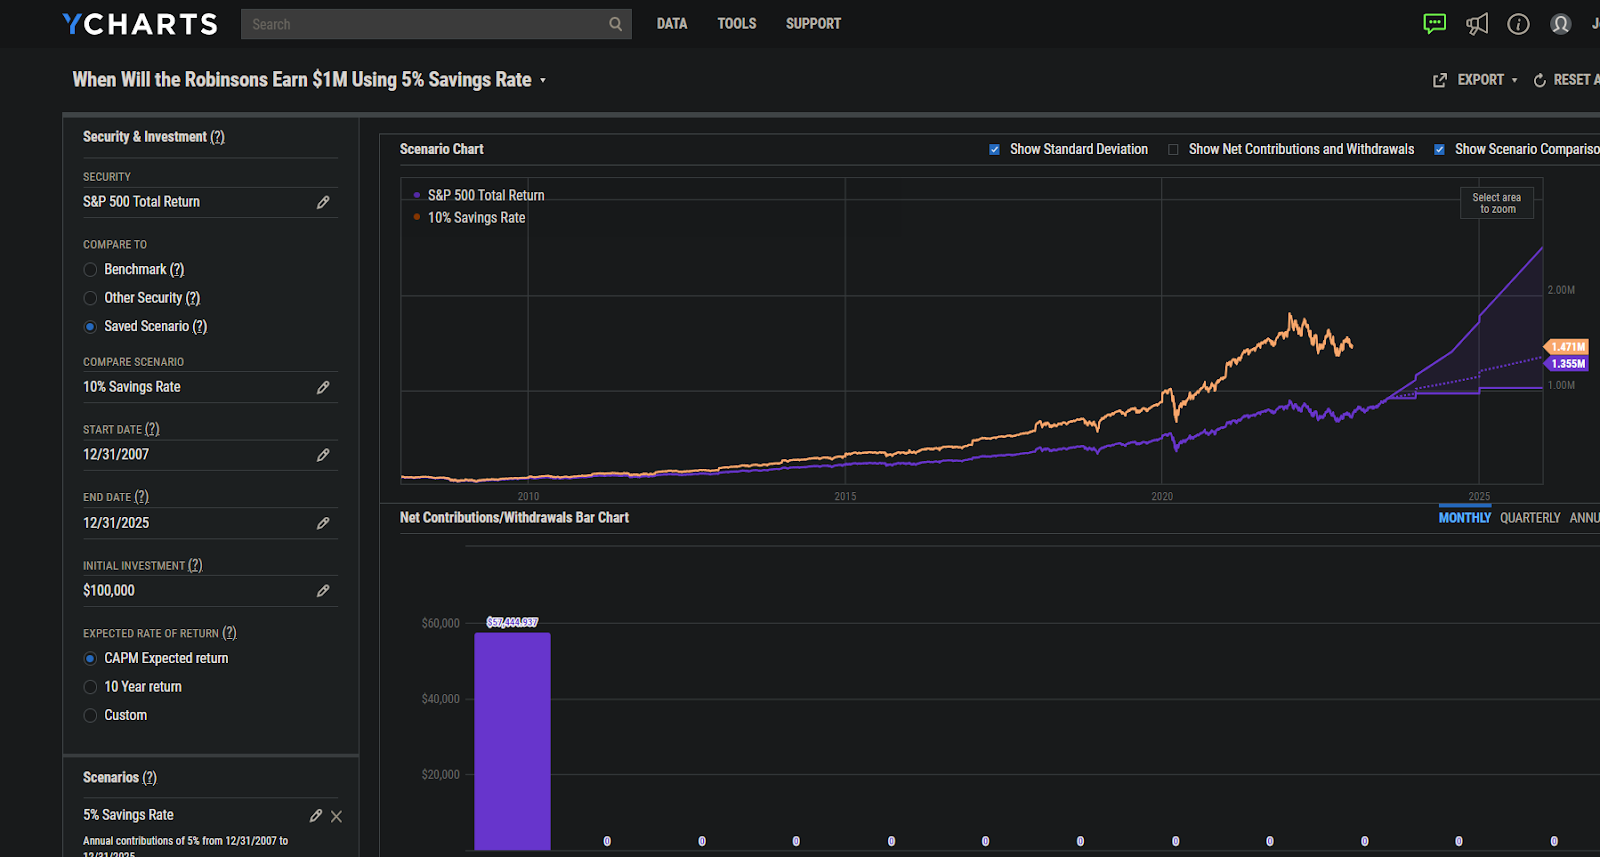
However, what happens when they decide to divert some of these savings towards saving for their children’s college tuition, and bring their retirement savings rate down to 5%? The Scenarios tool can do more than just illustrate historical growth of their investments. It can also project the timeline for when they may achieve that sought-after million-dollar mark in the future.
Start a Free Trial to Build Scenarios
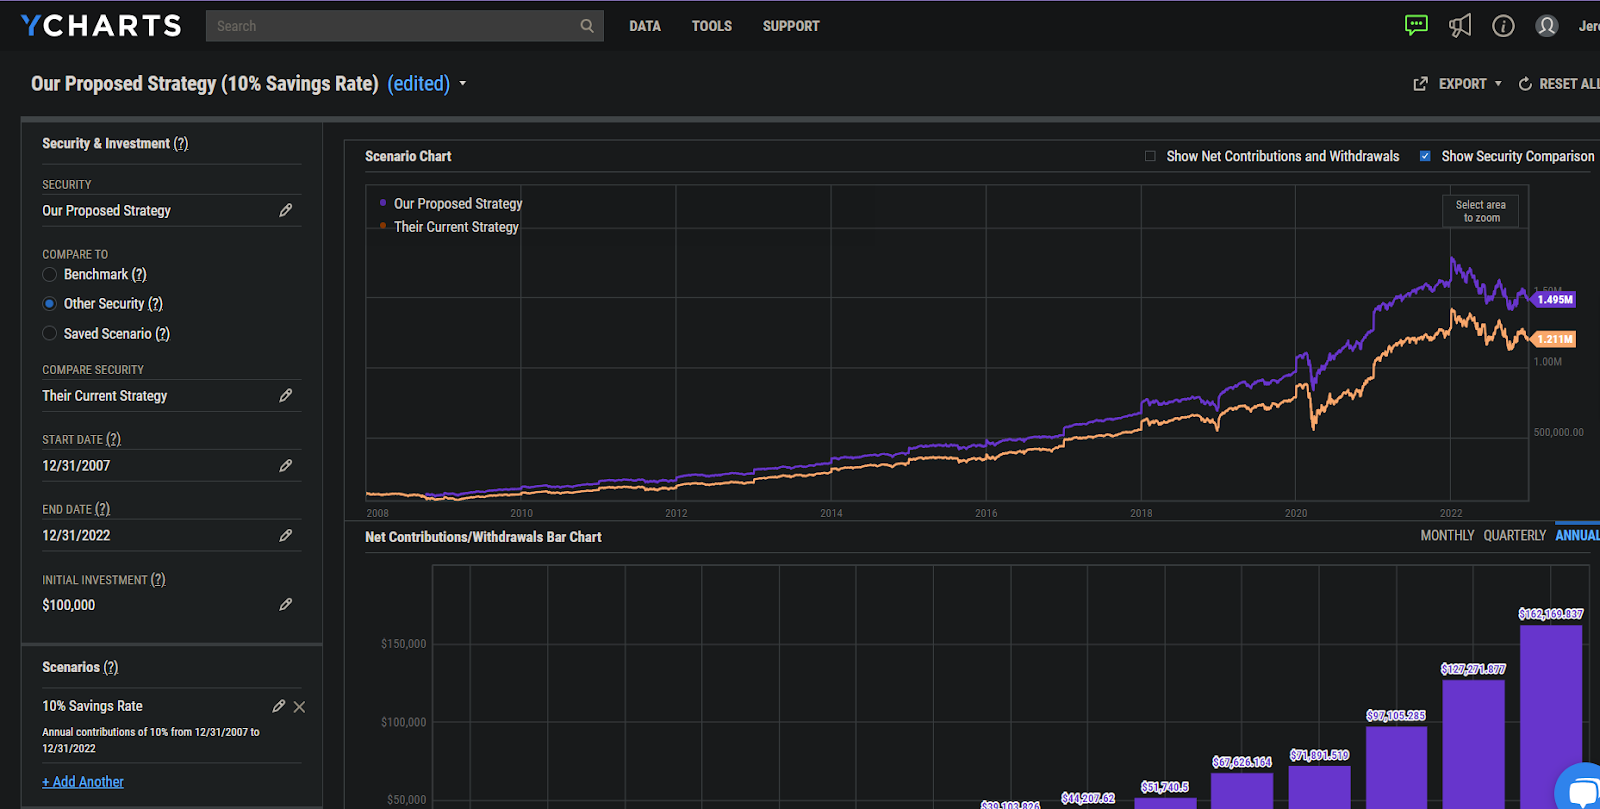
The visuals you create in Scenarios can also serve as a formidable prospecting tool. By contrasting a proposed portfolio and a prospect’s existing portfolio using the same savings rates, you can clearly illustrate the hypothetical improvement in returns had they been under your guidance.
Start a Free Trial to Build Scenarios
Consider a client who’s contemplating a large purchase soon, such as a down payment on a house. Using a one-time withdrawal scenario, you can illustrate the historical impact of a $100k down payment.
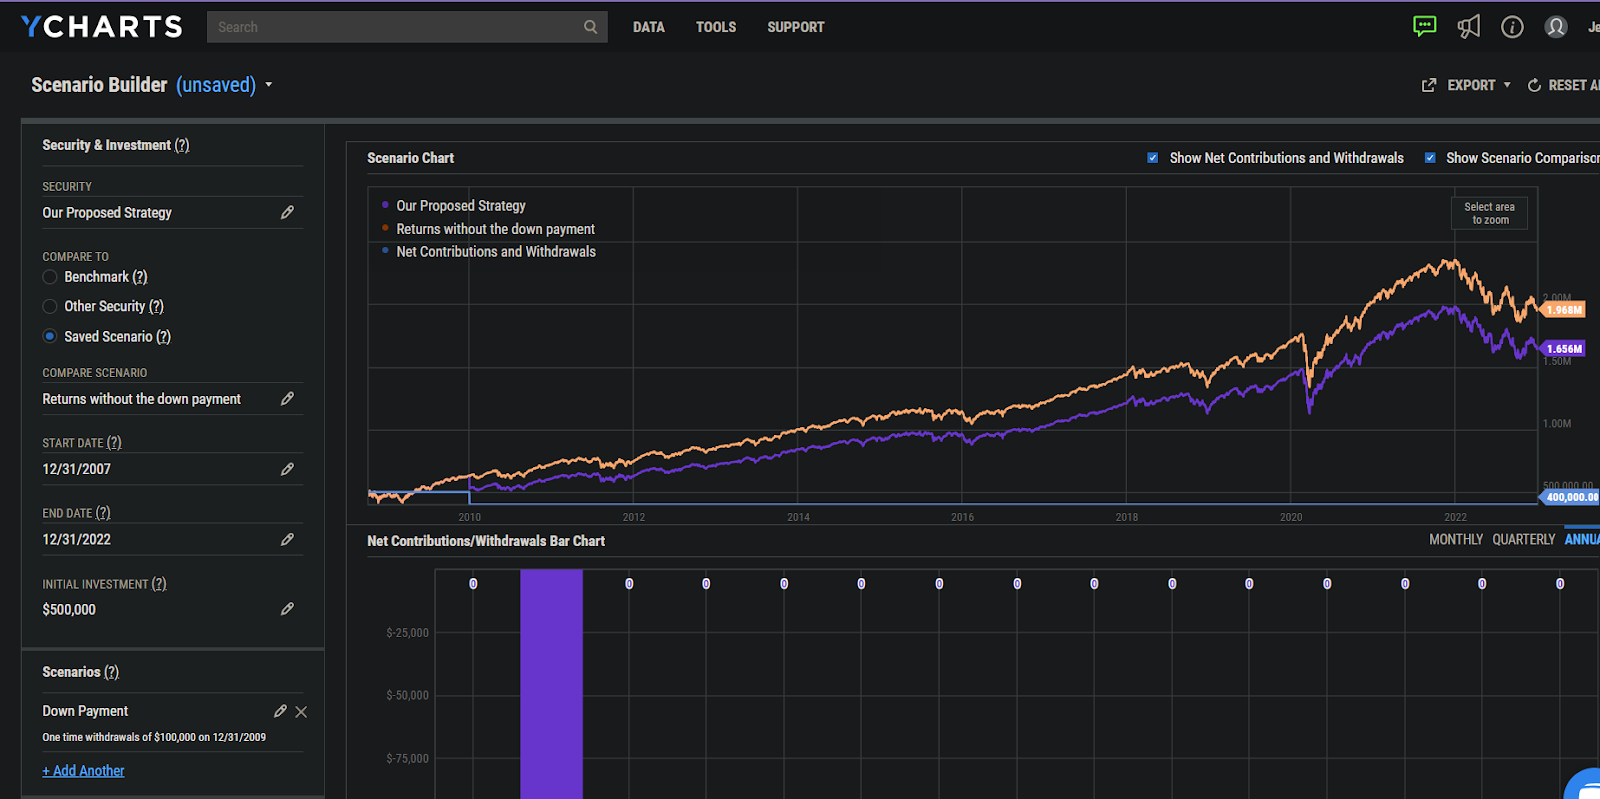
Start a Free Trial to Build Scenarios
Scenarios for the Retirement Phase
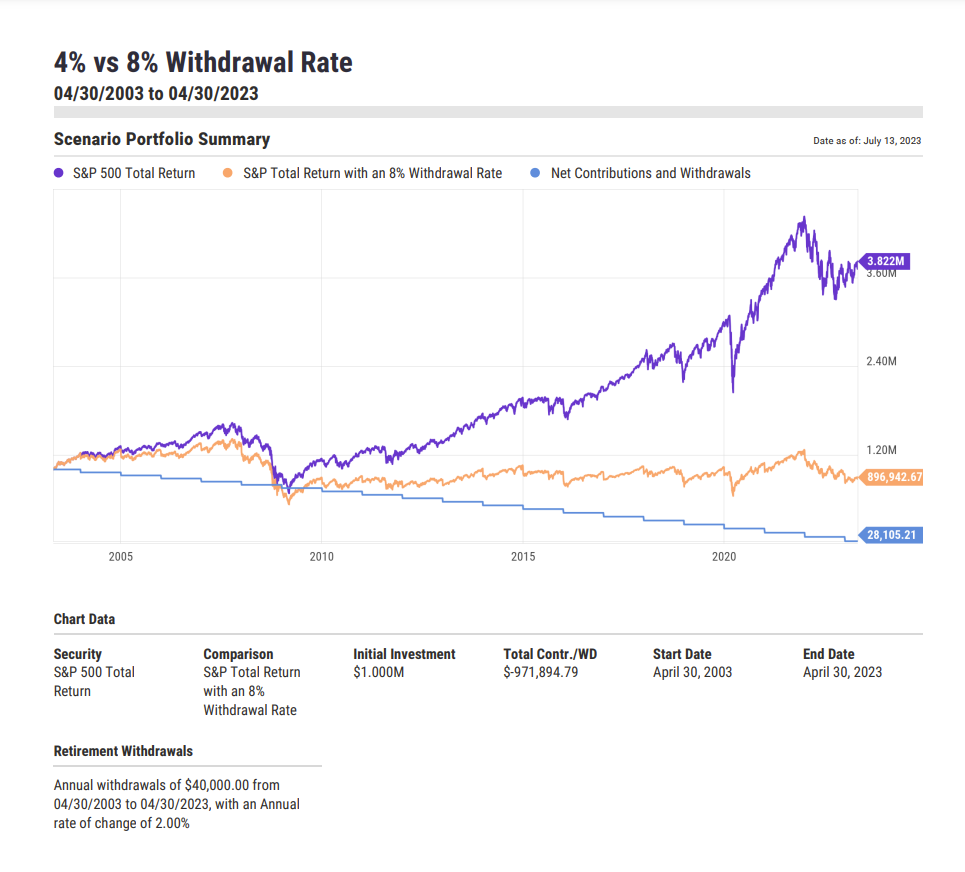
Finally, let’s focus on clients nearing retirement, such as Mr. Thompson. During this crucial stage, the Scenarios tool is invaluable as it showcases the effects of various withdrawal rates on a client’s wealth. For instance, it can provide insights into the impact of choosing a 4% or 8% withdrawal rate.
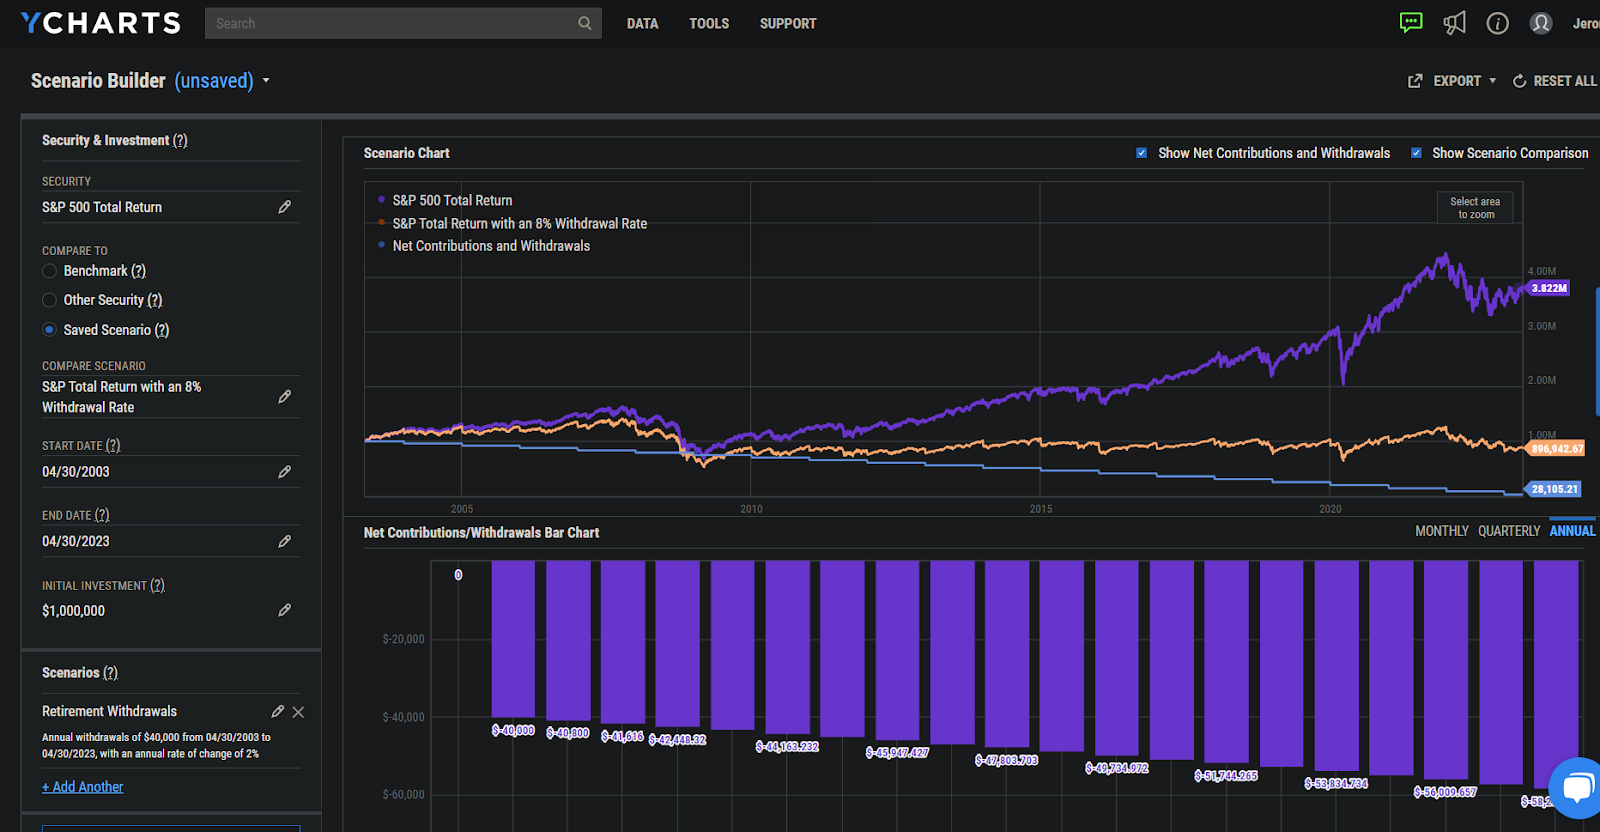
Start a Free Trial to Build Scenarios
Sharing these scenarios with your clients is simple. You can export a PDF directly from the Scenarios tool or integrate it into an extensive report using the Scenarios module in the Report Builder. In both cases, you can add your firm’s custom colors and make your compliance director happy by implementing custom disclosures, ensuring compliance readiness for client communication.
Start a Free Trial to Build Scenarios
By leveraging the Scenarios tool, you effortlessly help clients visualize their financial future, reinforce the importance of early and consistent investing, and guide them toward informed decisions. Whether they are young couples, like the Does, embarking on their journey, mid-career accumulators, like the Robinsons, or those on the brink of retirement, like Mr. Thompson, Scenarios assists in securing their financial future, nurturing trust, and reaffirming your invaluable role in their lives.
Connect with YCharts
To get in touch, contact YCharts via email at hello@ycharts.com or by phone at (866) 965-7552
Interested in adding YCharts to your technology stack? Sign up for a 7-Day Free Trial.
Disclaimer
©2023 YCharts, Inc. All Rights Reserved. YCharts, Inc. (“YCharts”) is not registered with the U.S. Securities and Exchange Commission (or with the securities regulatory authority or body of any state or any other jurisdiction) as an investment adviser, broker-dealer, or in any other capacity, and does not purport to provide investment advice or make investment recommendations. This report has been generated through application of the analytical tools and data provided through ycharts.com and is intended solely to assist you or your investment or other adviser(s) in conducting investment research. You should not construe this report as an offer to buy or sell, as a solicitation of an offer to buy or sell, or as a recommendation to buy, sell, hold or trade, any security or other financial instrument. For further information regarding your use of this report, please go to: ycharts.com/about/disclosure
Next Article
Could You Have Hedged Inflation in the 2000s with an ETF?Read More →