Could You Have Hedged Inflation in the 2000s with an ETF?
Like a Justin Timberlake chart-topper, inflation is still in investors’ heads. Even though the Consumer Price Index (CPI) fell to 2.97% in June from its 9.1% peak at this point last year, inflation remains in major headlines. Many investors may still wonder about the potential hedging opportunities available.
In our Can You Hedge It With an ETF? white paper, we took a sample 60/40 model portfolio and incorporated gradually increasing weights of Invesco DB Commodity Tracking (DBC), iShares TIPS Bond ETF (TIP), iShares 1-3 Year Treasury Bond ETF (SHY), and Bitcoin. We then put these portfolios through the ringer across three inflationary periods: 2006-2008, 2015-2018, and 2020-2021.
So dust off your Blackberry, pull out your iPod and read on to find out how inflation-hedging strategies performed during the market’s mid-2000s jam with inflation.
Download the free White Paper to see our full findings:The Role of Commodities in Hedging Inflation in 2006-2008
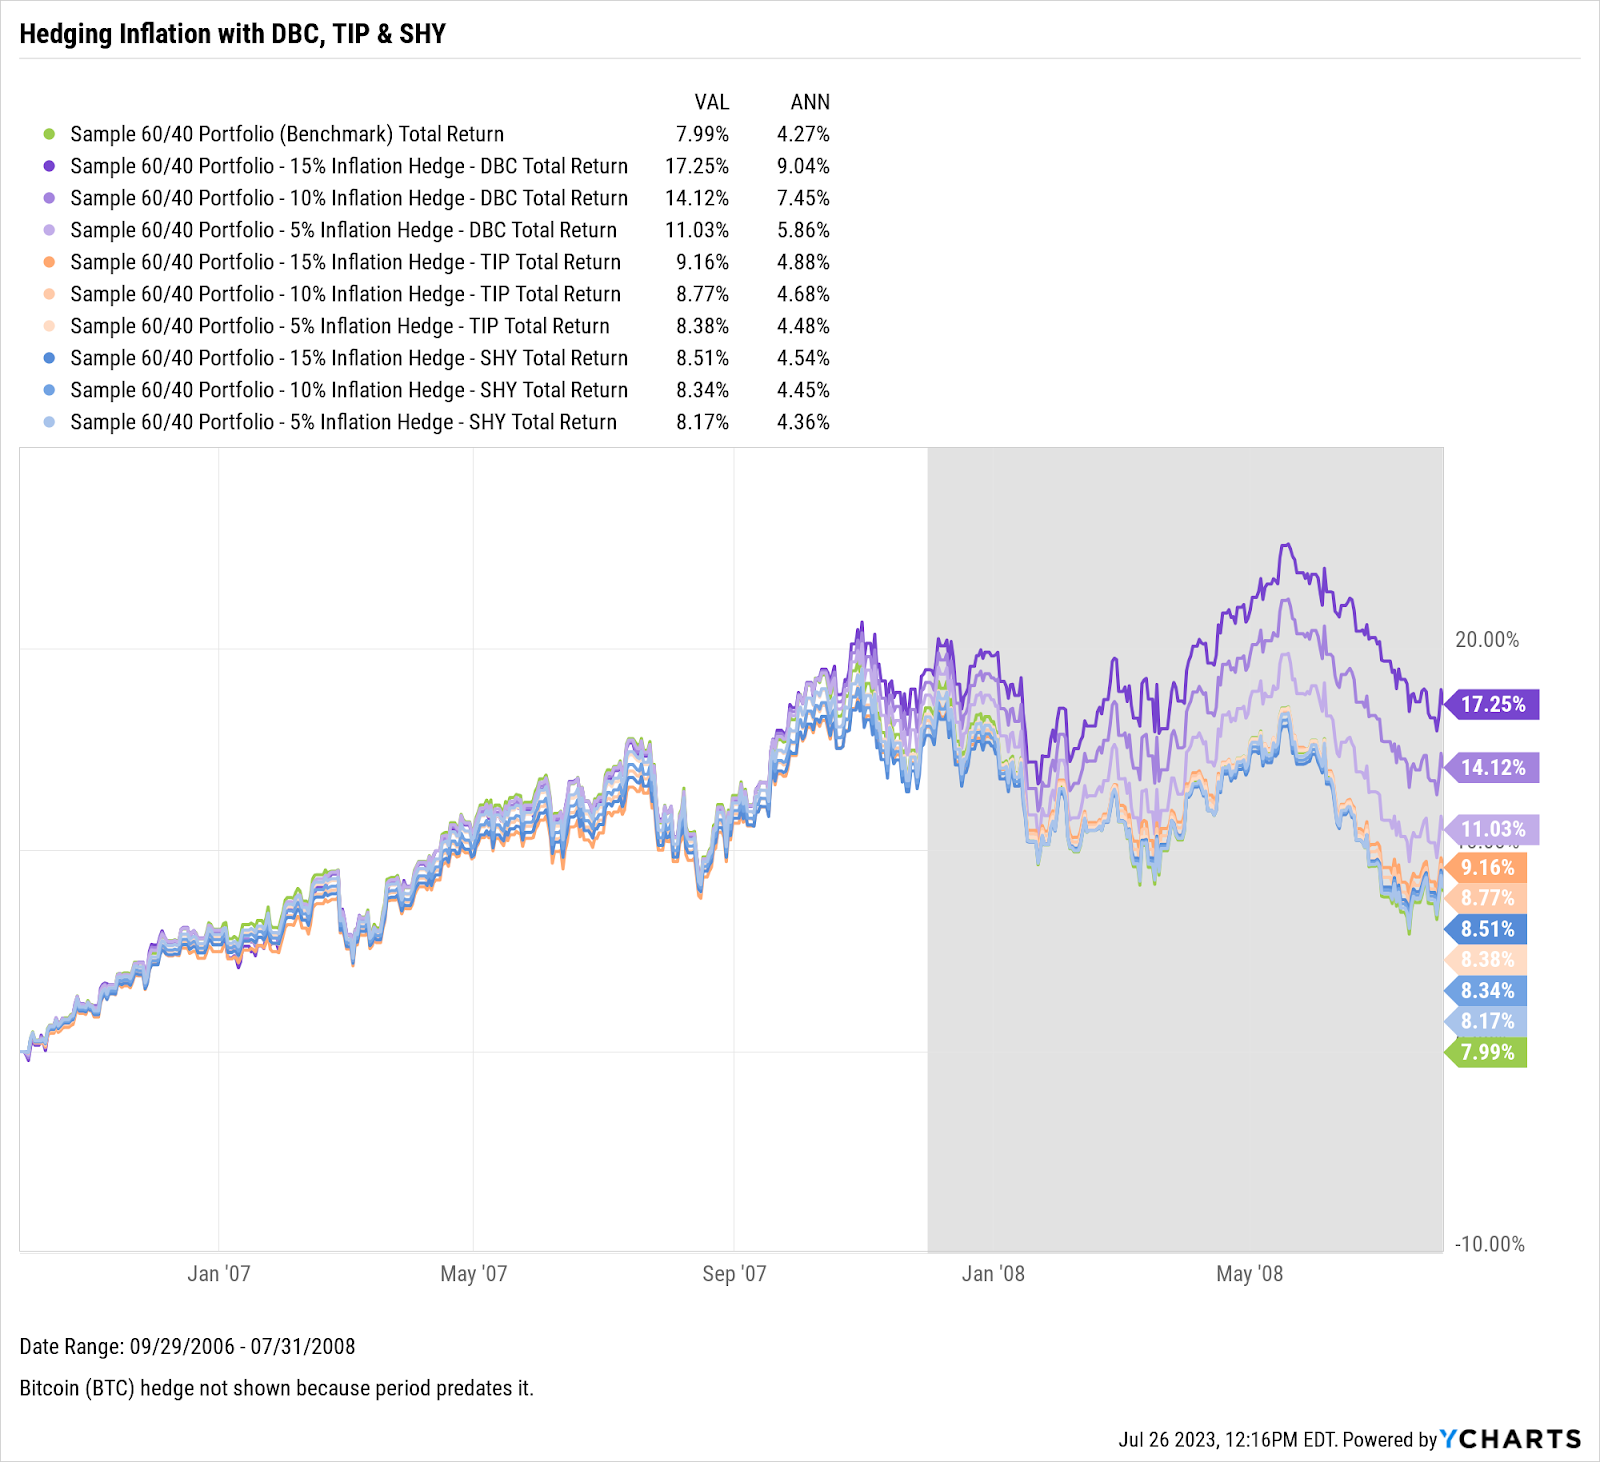
Between October 2006 and July 2008, inflation escalated to 5.6% from a decade low of 1.3%. A variety of hedging strategies outperformed the 60/40 benchmark during this period, but models that used commodities as a hedge exhibited the most pronounced outperformance among the three hedges.
Notably, the outperformance was directly proportional to the degree of exposure to DBC. This ETF, backed by various commodities, provided a tangible hedge against inflation.
Download the White Paper For Full Findings
The superior performance of commodities can be attributed to their inherent value. These tangible assets typically experience price increases during periods of inflation. This was particularly true during this period as agricultural commodities faced price hikes due to droughts and other adverse weather conditions in key producing regions, leading to supply shortages.
The combined effect of these factors—increased commodity prices due to high demand and supply disruptions—made commodities an even more effective hedge against inflation.
Steering Through Financial Uncertainties: A Closer Look at TIPs and SHY
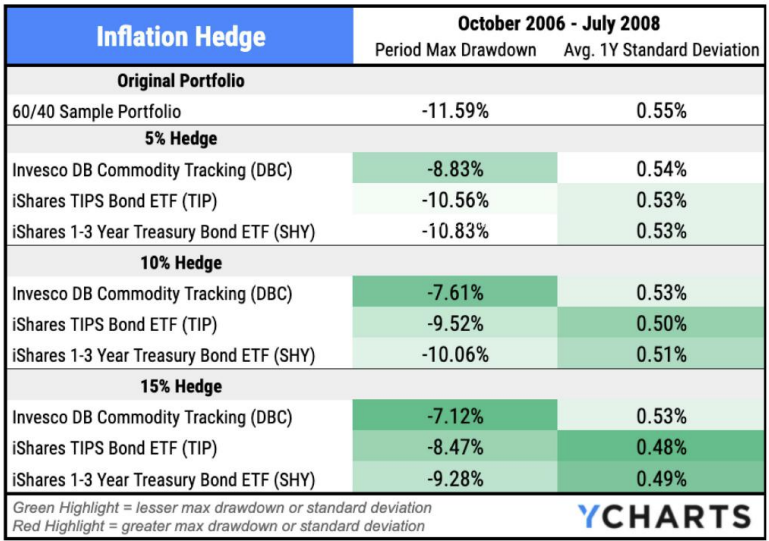
An investor’s risk tolerance is crucial when selecting a suitable inflation hedge. Our analysis revealed that all tested models provided enhanced protection during market downturns and offered a smoother investment journey, exhibiting a lower standard deviation than the base 60/40 model.
Models that included 15% allocations to Treasury Inflation-Protected Securities (TIP) and iShares 1-3 Year Treasury Bond ETF (SHY) demonstrated particularly effective volatility reduction, highlighted by their lower standard deviations of 0.48% and 0.49%, respectively.
Download the White Paper For Full Findings
TIPs, backed by the full faith and credit of the U.S. government, offer inherent protection against inflation, with their principal value adjusted according to changes in the Consumer Price Index (CPI). This dual benefit of safety and inflation protection positions TIPs as a potent asset in an inflationary environment.
On the other hand, SHY’s resilience in the face of fluctuating interest rates reinforces its importance as part of an inflation-hedging strategy. Notably, the Federal Reserve raised interest rates steadily until mid-2006 before reducing them rapidly in 2007 and 2008 in response to the emerging financial crisis. Short-term bonds like those held by SHY are less sensitive to these interest rate changes, making them a strategic addition to portfolios during uncertain periods.
Download the free White Paper to see our full findings:Connect with YCharts
To get in touch, contact YCharts via email at hello@ycharts.com or by phone at (866) 965-7552
Interested in adding YCharts to your technology stack? Sign up for a 7-Day Free Trial.
Disclaimer
©2023 YCharts, Inc. All Rights Reserved. YCharts, Inc. (“YCharts”) is not registered with the U.S. Securities and Exchange Commission (or with the securities regulatory authority or body of any state or any other jurisdiction) as an investment adviser, broker-dealer, or in any other capacity, and does not purport to provide investment advice or make investment recommendations. This report has been generated through application of the analytical tools and data provided through ycharts.com and is intended solely to assist you or your investment or other adviser(s) in conducting investment research. You should not construe this report as an offer to buy or sell, as a solicitation of an offer to buy or sell, or as a recommendation to buy, sell, hold or trade, any security or other financial instrument. For further information regarding your use of this report, please go to: ycharts.com/about/disclosure
Next Article
New on YCharts: Portfolio OptimizerRead More →