Income-Centric Equity ETFs: A YCharts Guide to Put Cash Back to Work

Investors are sitting on trillions, and with short-term rates expected to fall, advisors are seeking productive avenues for their clients’ cash holdings. YCharts provides an in-depth look into transitioning from cash-like investments to dividend-focused or income-centric equity ETFs. Our analysis covers 78 ETFs with “equity-income” as their prospectus objective (excluding leveraged funds), highlighting leaders in this category, including Vanguard Dividend Appreciation ETF (VIG), Vanguard High Dividend Yield ETF (VYM), and Schwab US Dividend Equity ETF™ (SCHD).
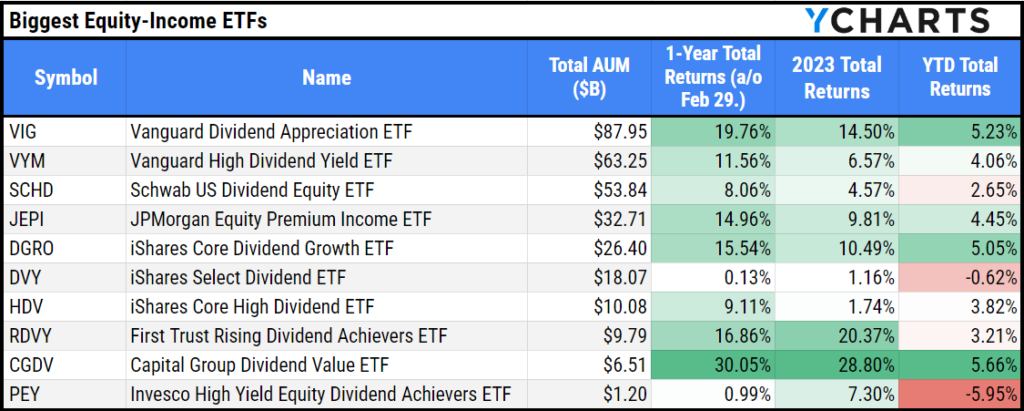
Download Visual | Modify in YCharts
Advisors can weigh potential income generation and capital appreciation with strategies like these. Discussions with clients will revolve around finding ways to generate income in their portfolios, the opportunity cost of staying out of the market in 2023, and the future opportunity cost for staying out of the market any longer.
Highlight Income Potential and Historic Capital Appreciation with YCharts Tools
Regarding the costs of staying out of the market, with the Fund Screener, YCharts can assist advisors in discovering and employing strategies that balance potential income generation and capital appreciation. ETFs like the Nationwide Nasdaq-100® Risk-Managed Income ETF (NUSI), Capital Group Dividend Value ETF (CGDV), and Franklin U.S. Core Dividend Tilt Index ETF (UDIV) stood out in our review for their one-year returns, showcasing the effectiveness of YCharts’ screening tools in identifying top performers.
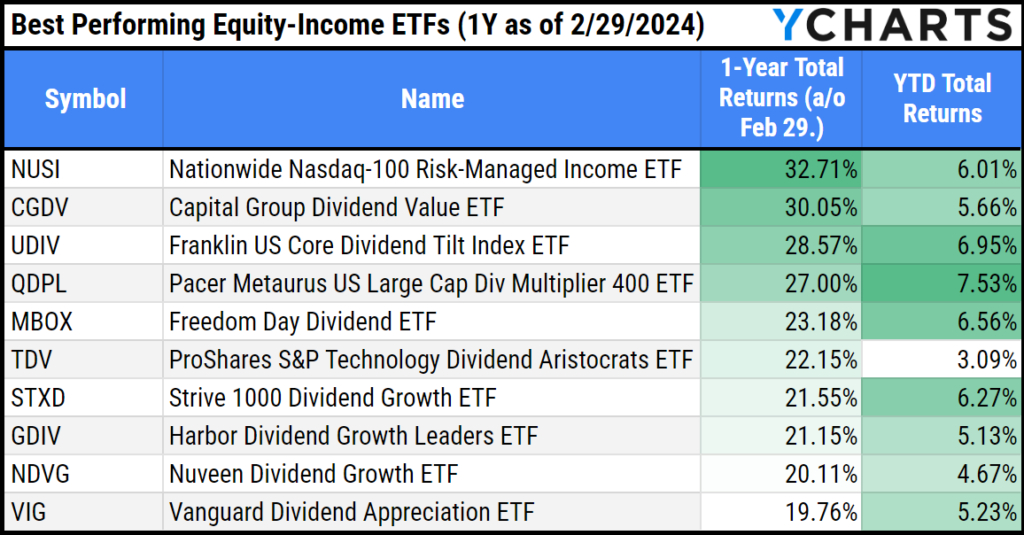
Download Visual | Modify in YCharts
All three of the best-performing funds have a higher dividend yield than SPY’s 1.29%.
However, the top three funds in terms of dividend yield are Global X SuperDividend™ ETF (SDIV) with a yield of 12.2%, InfraCap Equity Income ETF (ICAP) with a yield of 8.99%, and FT Vest Rising Dividend Achievers Target Income ETF (RDVI) with a yield of 8.33%.
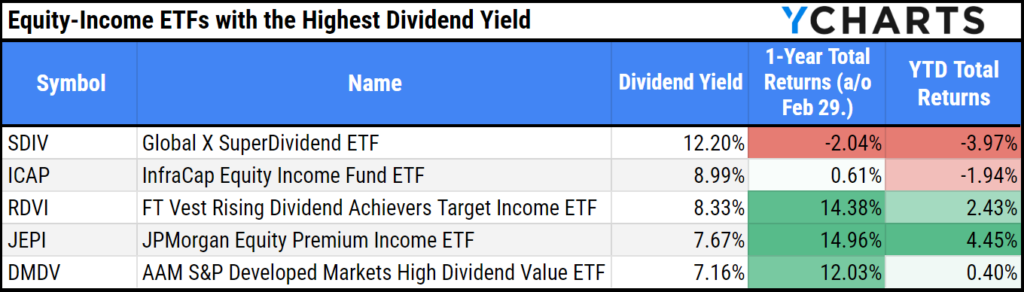
Download Visual | Modify in YCharts
Risk Considerations for Income-Centric Equity ETFs
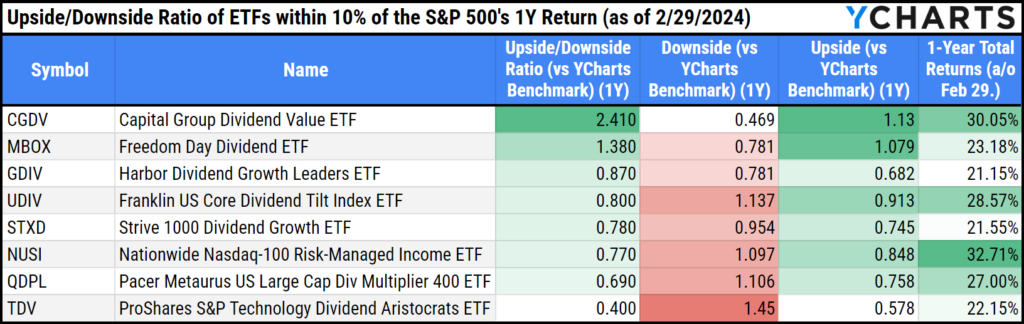
YCharts’ comprehensive analysis spotlights the performance and risk profile of “equity-income” ETFs, crucial for investors in their wealth preservation stage, with a lower risk tolerance but still looking towards equity markets for potential capital appreciation. Our findings reveal that a select group of equity-income ETFs closely align with the S&P 500’s returns, mitigating risk while maintaining competitive performance.
Specifically, only eight equity-income ETFs have produced returns within 10% of the S&P 500’s total return over the past year as of February 29th. Of those funds, the Harbor Dividend Growth Leaders ETF (GDIV), Capital Group Dividend Value ETF (CGDV), and Strive 1000 Dividend Growth ETF (STXD) stand out for their lower one-year maximum drawdowns at 7.95%, 9.46%, and 9.87%, respectively. This data underscores the importance of strategic investment choices in navigating market volatility and emphasizes the potential of equity-income ETFs in achieving a well-balanced portfolio.
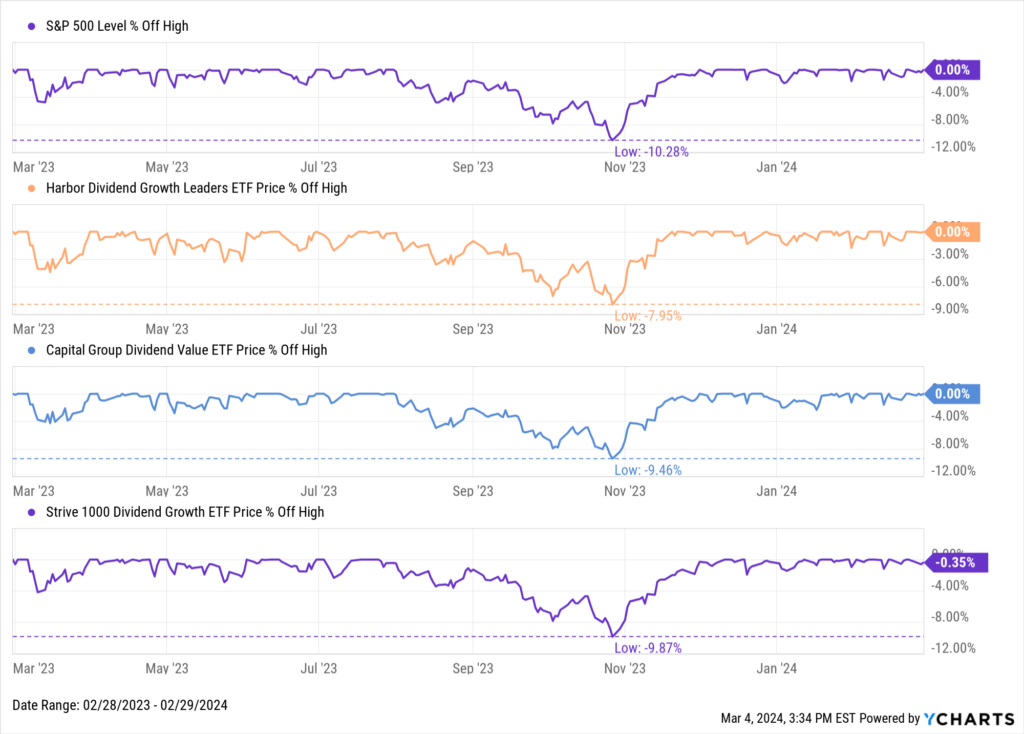
Download Visual | Modify in YCharts
Of those strategies, CGDV produced the highest Upside/Downside ratio against its benchmark (Russell 1000 Value) over one year at 2.41.
Download Visual | Modify in YCharts
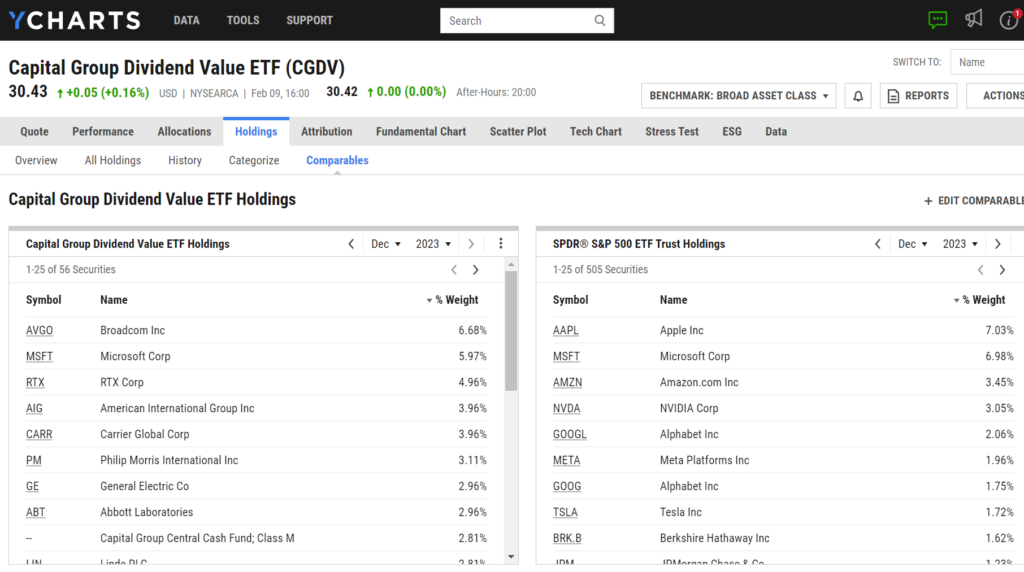
Considering today’s market, it seems relevant to note that only one of CGDV’s top ten holdings (Microsoft) overlapped with SPY’s top ten as of December 2023.
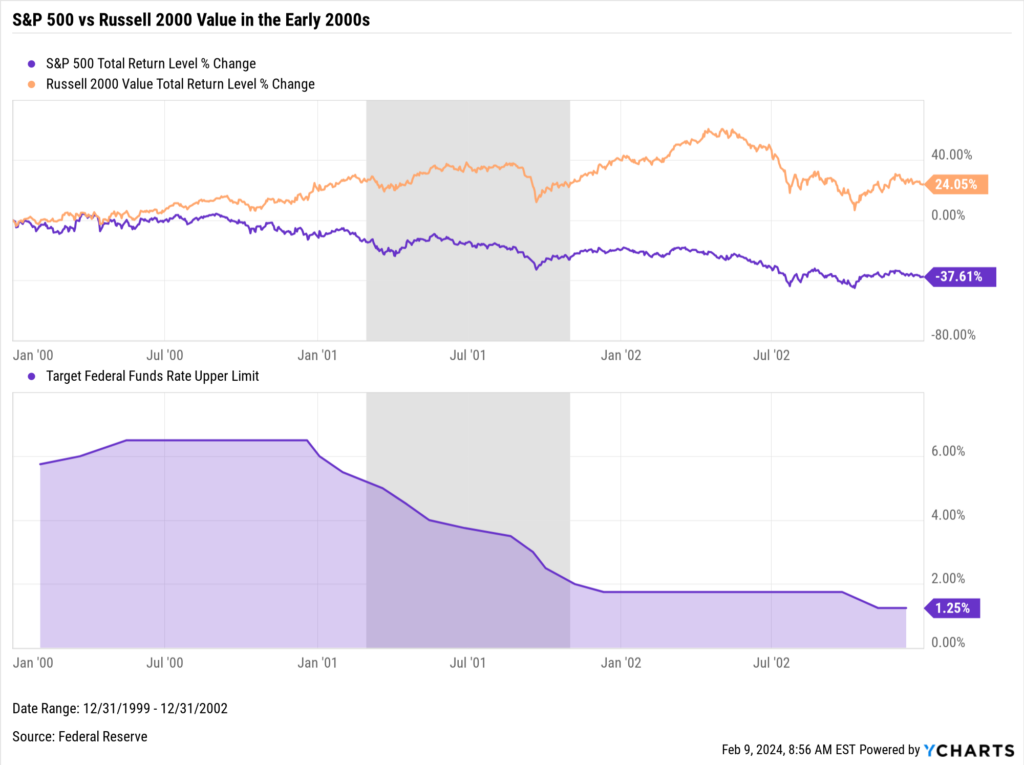
For advisors or clients who feel that AI has driven the market into a tech bubble similar to the early 2000s, the divergence in performance between the S&P 500 and Russell 2000 Value Index from 2000 to 2002 presents an interesting case for finding opportunities outside of the biggest names.
Download Visual | Modify in YCharts
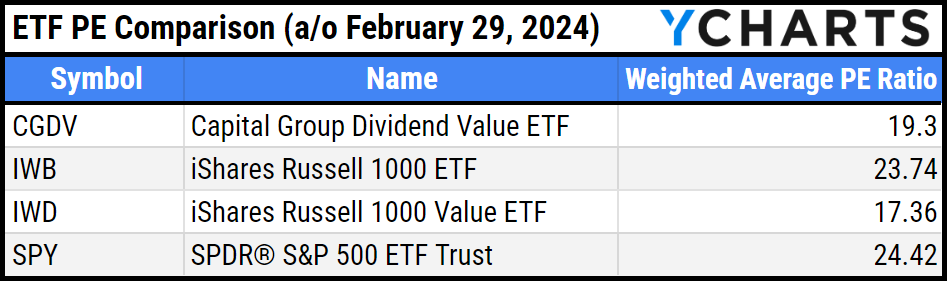
The lack of Magnificent Seven stocks in CGDV’s top 10 holdings may explain CGDV’s weighted P/E of 19.3, which is lower than SPY (24.42) and IWB (23.74) as of February 29, 2024.
Download Visual | Modify in YCharts
This is an example of why active ETFs are increasing in popularity. The potential value of an active manager is that they can scour the market to increase the breadth of returns in a client’s portfolio. With the current concentration of returns in major indices, finding performance outside of the “Magnificent Seven” is a growing consideration for investors already in the market and those who are hesitant to put their cash back to work due to recent stock market highs.
Navigating Investment Opportunities with YCharts
Income-centric equity ETFs offer investors an opportunity to shift their cash holdings into more productive investments amid falling short-term rates. By adopting a thoughtful investment strategy, investors may enjoy the dual benefits of income generation and portfolio appreciation, making these ETFs an ideal choice for those looking to broaden their investment horizon and minimize the missed opportunities of staying out of an advancing market.
As the investment landscape transforms, active and income-centric equity ETFs emerge as pivotal elements for diversifying and enhancing portfolio strategies.
YCharts stands at the forefront, offering unparalleled analytical capabilities and comprehensive insights, empowering investors and advisors to navigate these shifts confidently. These ETFs not only open avenues for potential income and growth but also align with the modern investor’s quest for broader market engagement. YCharts is dedicated to equipping its users with the tools and knowledge to successfully adapt to and capitalize on the evolving market dynamics.
Whenever you’re ready, there are 3 ways YCharts can help you:
Interested in doing further ETF research with YCharts?
Email us at hello@ycharts.com or call (866) 965-7552. You’ll get a response from one of our Chicago-based team members.
Want to test out YCharts for free?
Start a no-risk 7-Day Free Trial.
Download The Best Performing ETFs of 2023 for more comparative ETF analysis:
Get your copy of The Best Performing ETFs of 2023 here:Disclaimer
©2024 YCharts, Inc. All Rights Reserved. YCharts, Inc. (“YCharts”) is not registered with the U.S. Securities and Exchange Commission (or with the securities regulatory authority or body of any state or any other jurisdiction) as an investment adviser, broker-dealer or in any other capacity, and does not purport to provide investment advice or make investment recommendations. This report has been generated through application of the analytical tools and data provided through ycharts.com and is intended solely to assist you or your investment or other adviser(s) in conducting investment research. You should not construe this report as an offer to buy or sell, as a solicitation of an offer to buy or sell, or as a recommendation to buy, sell, hold or trade, any security or other financial instrument. For further information regarding your use of this report, please go to: ycharts.com/about/disclosure
Next Article
Monthly Market Wrap: February 2024 - Unveiling Key Financial TrendsRead More →