Monthly Market Wrap: February 2024 – Unveiling Key Financial Trends

Welcome back to the Monthly Market Wrap from YCharts, where we dissect crucial market trends for advisors and their clients. This February, we witnessed equities rallying notably, with NASDAQ and S&P 500 showing significant gains. Notably, the S&P 500 crossed an unprecedented milestone, closing above 5,000 for the first time.
Want to use these visuals in your own presentations? Download our free Monthly Market Wrap slide deck, containing all charts featured in the Market Wrap and more in a shareable, presentation-ready format.
February 2024 Market Highlights: Equities, Inflation, and Milestones
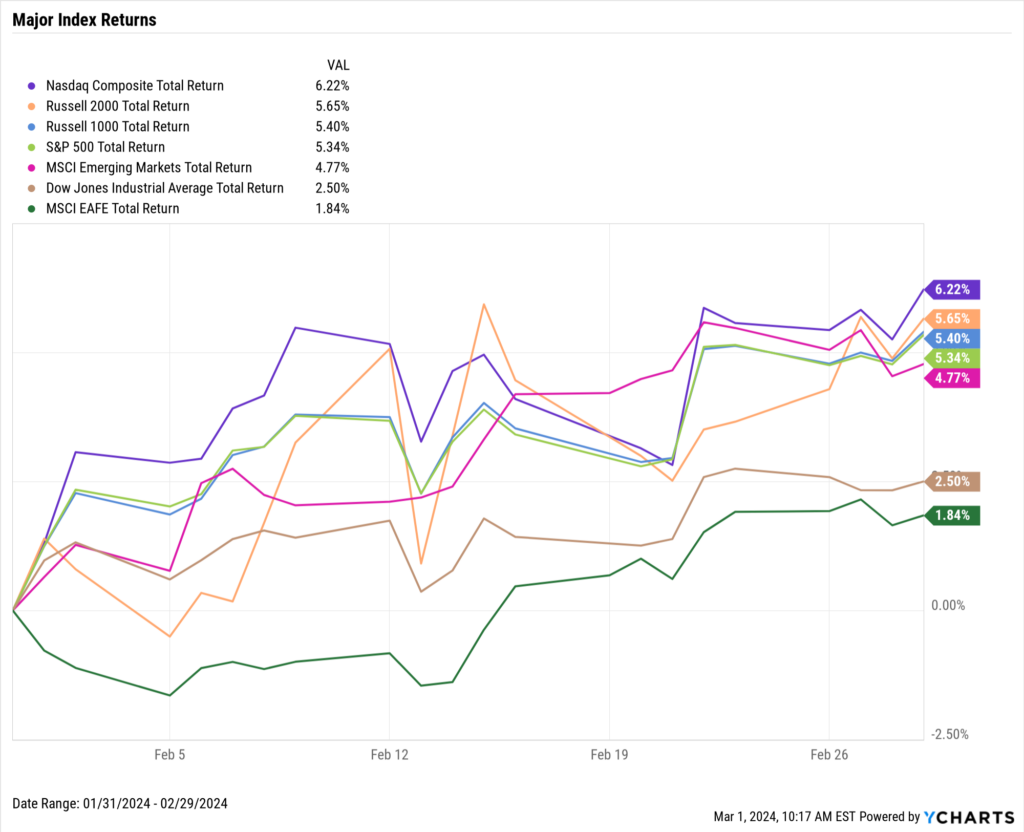
Equities rallied across the board as the NASDAQ led the way with a 6.2% gain. Both the Russell 2000 and Russell 1000 posted gains of around 5.5%, and the S&P 500 advanced 5.3%. The Dow Jones Industrial Average was the relative laggard but still rose 2.5%.
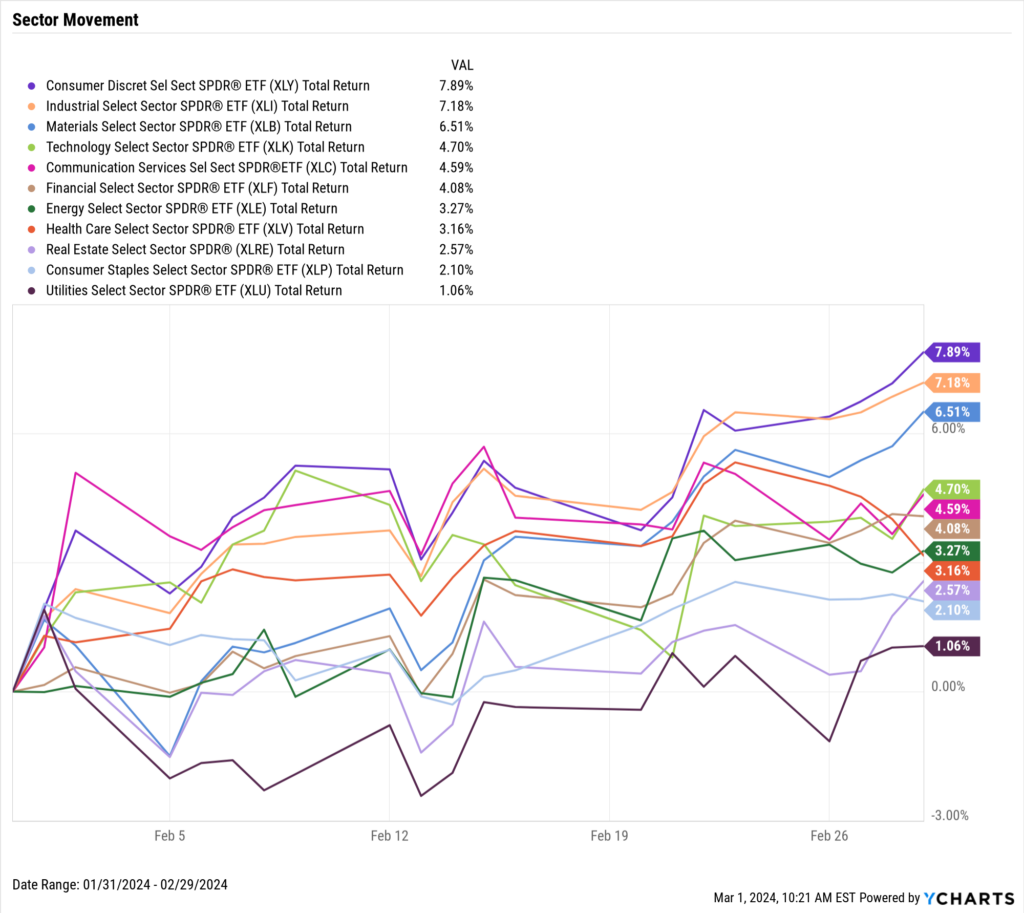
All eleven sectors advanced higher in February. Consumer Discretionary led the way with a 7.9% gain, followed by Industrials at 7.2% and Materials which charged 6.5% higher.
Core inflation has gradually decelerated over the last 10 months, down to 3.86% in January. Crude oil rose in February, causing the average price of gas to increase 13 cents to $3.37/g. After a flat January, Bitcoin and Ethereum logged respective gains of 45.9% and 44.2% in February, spurred by ETF inflows and ahead of March’s Bitcoin halving event.
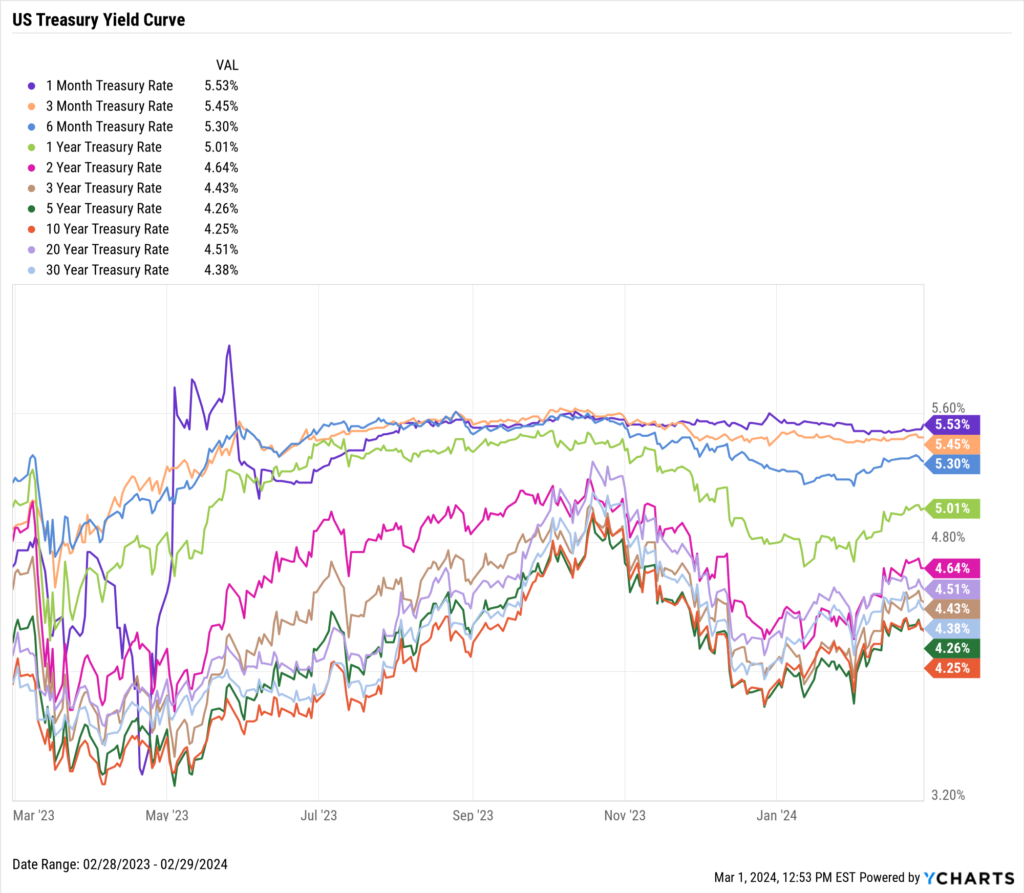
Treasury yields rose across the board even as equities rallied. Intermediate duration instruments posted the largest increases; the 2-year, 3-year, and 5-year all increased by 35 bps or more.
Bond ETFs largely mimicked their January performances in February. The short-term SPDR Bloomberg 1-3 Month T-Bill ETF (BIL) and iShares Boxx High Yield Corporate Bond (HYG) both inched higher. In long-term bonds, the iShares 20+ Year Treasury Bond ETF (TLT) fell 2.3% for the second straight month.
Jump to Fixed Income Performance
Want to create your own monthly recap, complete with these charts in a presentation deck that contains your firm’s branding? Start a Free Trial →
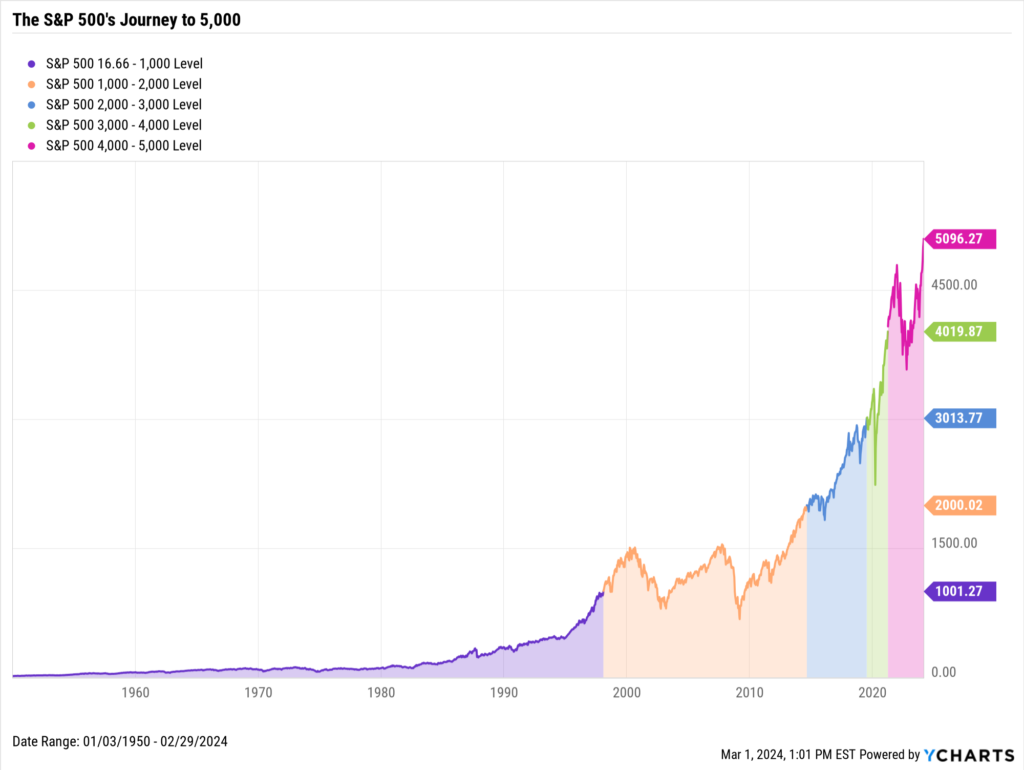
Off the YCharts! A Closer Look at S&P 500 Crossing 5,000
The S&P 500 reached a major milestone on February 9th when it closed above 5,000 for the first time.
It took the index 48 years to reach 1,000. The time it has taken for the S&P 500 to reach incremental 1,000-point levels has reduced dramatically in recent decades. The S&P 500 increased from 4,000 to 5,000 in just 2 years, 10 months, and 9 days.
For a deep dive on the S&P 500’s journey to 5,000 and what the index might do next, check out our recent blog post.
Download Visual | Modify in YCharts | Contact Us to Access This Chart
Equity Performance: Broad Gains Across Major Indexes
Major Indexes
Download Visual | Modify in YCharts | View Below Table in YCharts
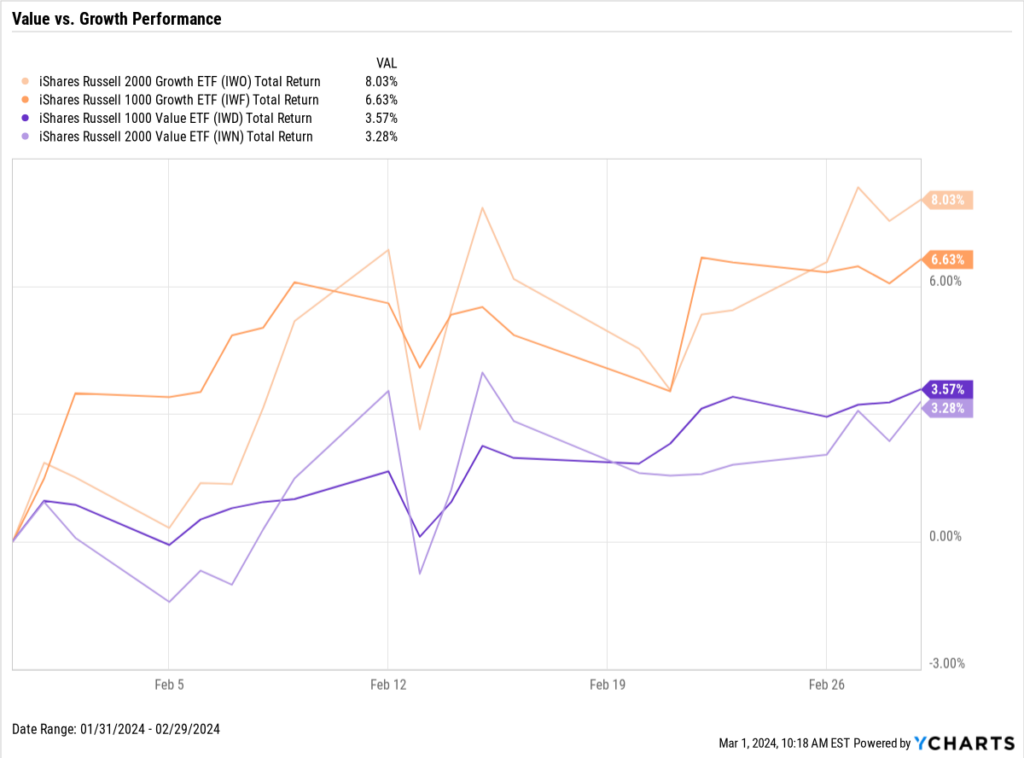
Value vs. Growth Performance
Download Visual | Modify in YCharts | View Below Table in YCharts
US Sector Movement
Download Visual | Modify in YCharts | View Below Table in YCharts
Hot Stocks: Top 10 S&P 500 Performers of February 2024
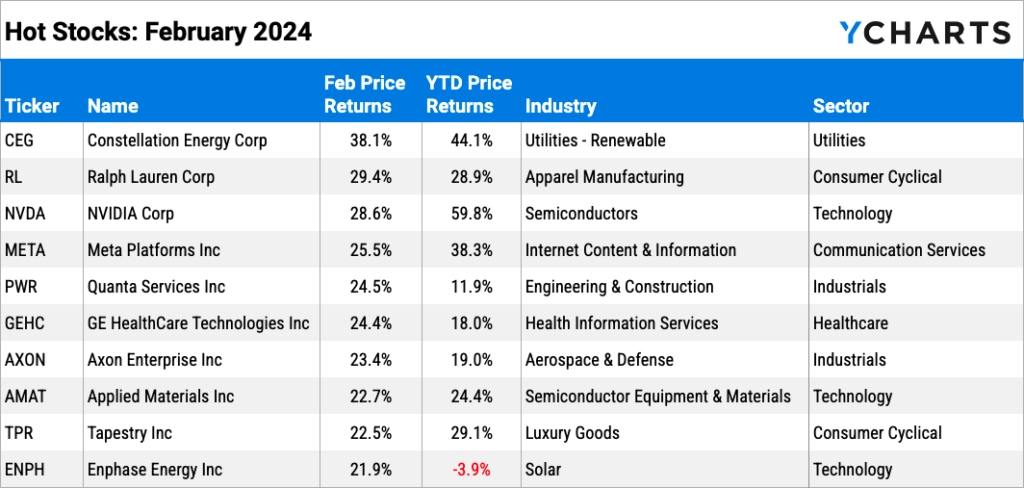
Download Visual | Modify in YCharts
Laggards & Losers: 10 Worst S&P 500 Performers of February 2024
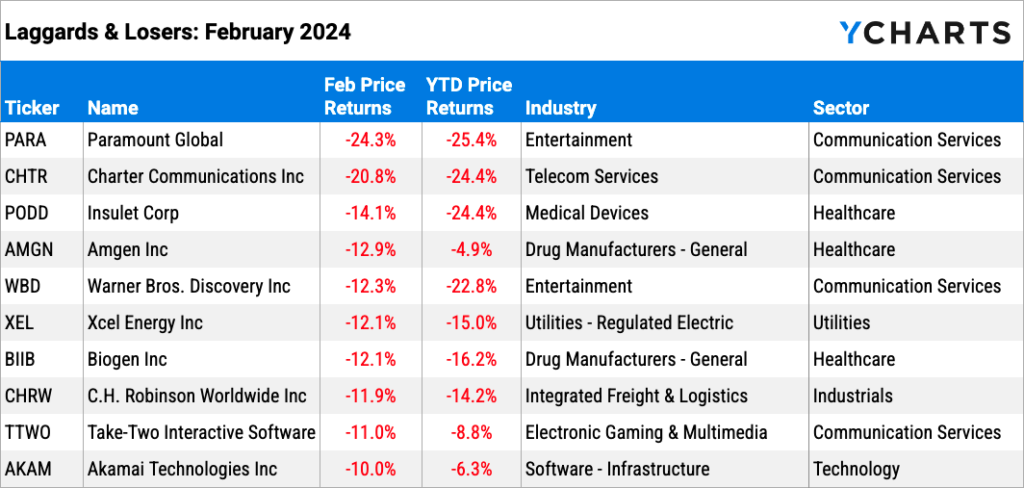
Download Visual | Modify in YCharts
Featured Market News and YCharts Insights
Millennial And Gen Z Wealth Jumped 40% In 3 Years, Nearing $6T (FA-Mag)
The S&P 500 Just Crossed 5,000. What’s Next? (YCharts)
Just three hours can improve retirement readiness: Study (InvestmentNews)
A Closer Look at January Fund Flows: Active ETFs, Bitcoin, and Beyond (YCharts)
Advisors See a Split Between the Economy and the Markets (WealthManagement.com)
YCharts Proposals & Reports: Enhancing Virtual Client Meetings for Wealth Management (YCharts)
Economic Data Overview: Inflation Trends and Commodity Prices
Employment
January’s unemployment rate stayed unchanged at 3.7%, as did the labor force participation rate at 62.5%. The US unemployment rate has now come in at 3.7% for three consecutive months. According to nonfarm payroll data, 353,000 new jobs were added in January, far surpassing the expected increase of 185,000.
Consumers and Inflation
The US inflation rate for January increased slightly to start the year, to 3.09%. Inflation has hovered in the 3 percent range since July, though it just logged its lowest YoY level since then. Core Inflation decreased slightly to 3.86% in January, nonetheless logging its 10th consecutive monthly decline. The monthly US Consumer Price Index rose 0.3% in January, and monthly US Personal Spending inched up 0.2%. The Federal Reserve held its key Fed Funds Rate at 5.50% at its January 31st, 2024 meeting, marking the Fed’s fourth consecutive meeting in which rates were left unchanged.
Production and Sales
The US ISM Manufacturing PMI failed to break into expansion territory, falling by 1.3 points in February to 47.8. December US Retail and Food Services Sales contracted by 0.8% MoM, while the YoY US Producer Price Index increased by 0.9%.
Housing
MoM US New Single-Family Home Sales increased 1.5% in January, and MoM US Existing Home Sales increased by 3.1% to 4.00M in January. The Median Sales Price of Existing Homes fell 0.6% to $379,100 in January, a seventh straight monthly decline putting it 7.6% below its all-time high set in June 2023. Mortgage rates increased slightly in February; the 15-year Mortgage Rate rose to 5.94% as of February 29th, and the 30-year ended the month at 6.94%.
Commodities
The price of Gold went largely unchanged in January to end the month at $2,048.10 per ounce. Crude oil prices continued higher in February; the price of WTI was 3% higher at $78.53 per barrel while Brent rose 1.2% to $84.01 both as of February 26th. Higher oil prices led the average price of gas to increase 13 cents per gallon in February, closing the month at $3.37 per gallon.
Cryptocurrencies
The price of Bitcoin is up 46.9% through the first two months of the year thanks to a 45.9% surge in February alone. Ethereum is 44.2% higher in 2024, logging all of that gain in February. Since the end of 2022, Bitcoin has jumped 275.9% and Ethereum has risen 181.4%.
Fixed Income Performance: Insights into Bond ETFs and Treasury Yields
US Treasury Yield Curve
1 Month Treasury Rate: 5.53%
3 Month Treasury Rate: 5.45%
6 Month Treasury Rate: 5.30%
1 Year Treasury Rate: 5.01%
2 Year Treasury Rate: 4.64%
3 Year Treasury Rate: 4.43%
5 Year Treasury Rate: 4.26%
10 Year Treasury Rate: 4.25%
20 Year Treasury Rate: 4.51%
30 Year Treasury Rate: 4.38%
Download Visual | Modify in YCharts
Bond Fund Performance
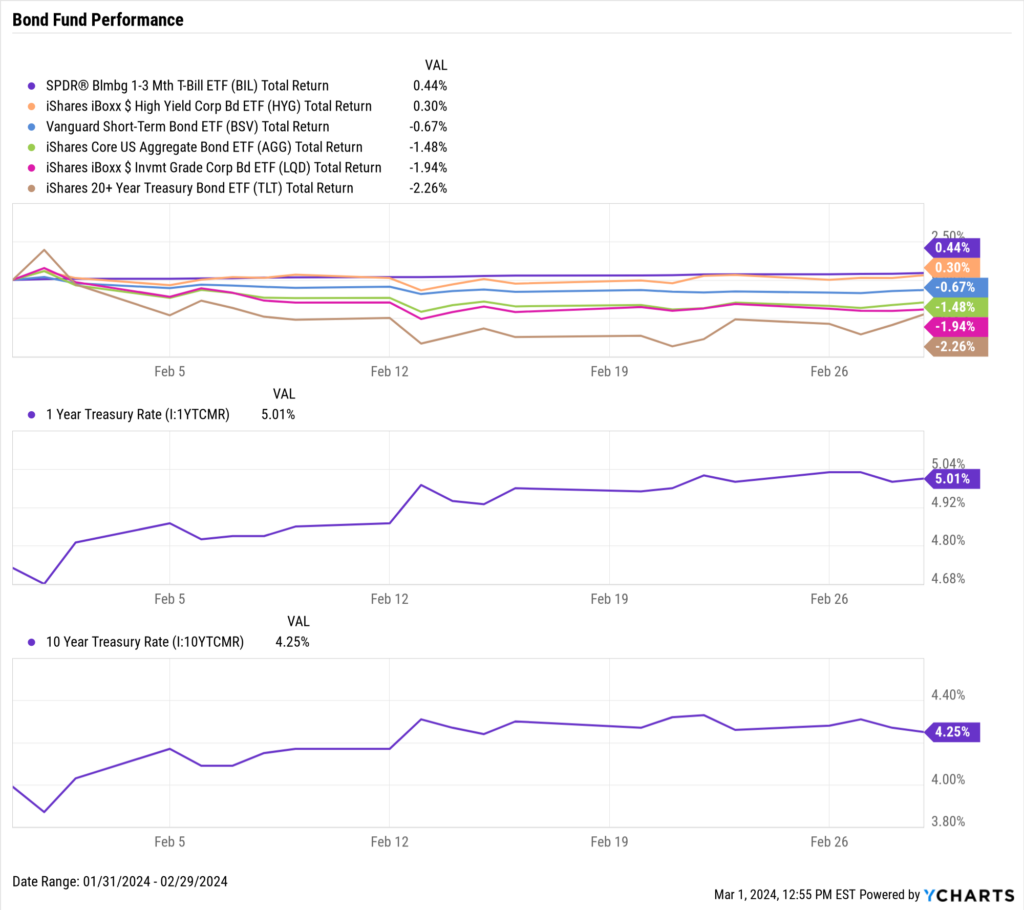
Download Visual | Modify in YCharts | View Below Table in YCharts
Stay updated with the latest market trends, economic data, and financial analysis with YCharts, your go-to source for financial insights and advisor tools. Download the visual aids directly from YCharts, and contact us for customized access to these charts.
Have a great March! 📈
Whenever you’re ready, there are 3 ways YCharts can help you:
1. Looking for a communication tool to show the impact of monthly market events?
Send us an email at hello@ycharts.com or call (866) 965-7552. You’ll be directly in touch with one of our Chicago-based team members.
2. Want to test out YCharts for free?
Start a no-risk 7-Day Free Trial.
3. Download a copy of the Monthly Market Wrap slide deck:
Disclaimer
©2024 YCharts, Inc. All Rights Reserved. YCharts, Inc. (“YCharts”) is not registered with the U.S. Securities and Exchange Commission (or with the securities regulatory authority or body of any state or any other jurisdiction) as an investment adviser, broker-dealer or in any other capacity, and does not purport to provide investment advice or make investment recommendations. This report has been generated through application of the analytical tools and data provided through ycharts.com and is intended solely to assist you or your investment or other adviser(s) in conducting investment research. You should not construe this report as an offer to buy or sell, as a solicitation of an offer to buy or sell, or as a recommendation to buy, sell, hold or trade, any security or other financial instrument. For further information regarding your use of this report, please go to: ycharts.com/about/disclosure
Next Article
YCharts Proposals & Reports: Enhancing Virtual Client Meetings for Wealth ManagementRead More →