YCharts Proposals & Reports: Enhancing Virtual Client Meetings for Wealth Management

In today’s virtual-centric world, wealth management professionals face the challenge of maintaining meaningful connections with teams and clients through virtual meetings, conversations, and proposals. YCharts addresses this shift with innovative proposal and report tools, designed to streamline and enhance virtual interactions, ensuring advisors can effectively communicate, engage, and grow their business in a digital-first landscape.
YCharts’ latest proposal and report innovations streamline virtual meeting prep for wealth management professionals. These tools empower advisors to personalize client engagements and maintain team alignment, freeing up time for strategic pursuits in an increasingly digital landscape.
Maximize Virtual Client Engagements with YCharts’ Report Builder
Virtual meeting communication has become a cornerstone of modern wealth management strategies, and savvy advisors understand the importance of leveraging effective tools and a variety of client engagement strategies. While traditional slide decks remain a staple, personalizing them for each client can be time-consuming and inefficient.
Enter YCharts’ Report Builder, a powerful tool tailored to the needs of wealth management professionals. Originally designed to help advisors customize portfolio strategies’ narratives, this tool has evolved to incorporate insights from YCharts’ suite of wealth management tools, such as Fundamental Charts, Attribution Analysis, and the Portfolio Optimizer, catering to various use cases for wholesalers and advisor home offices alike.
The latest update to Report Builder introduces landscape reports tailored for virtual meetings, streamlining the creation of personalized proposal decks and client review materials, perfect for screen sharing. The new feature assists professionals in seamlessly aligning PDF reports with their existing slide decks and other sales collateral, while also providing more spaced-out modules for improved readability and presentation clarity.

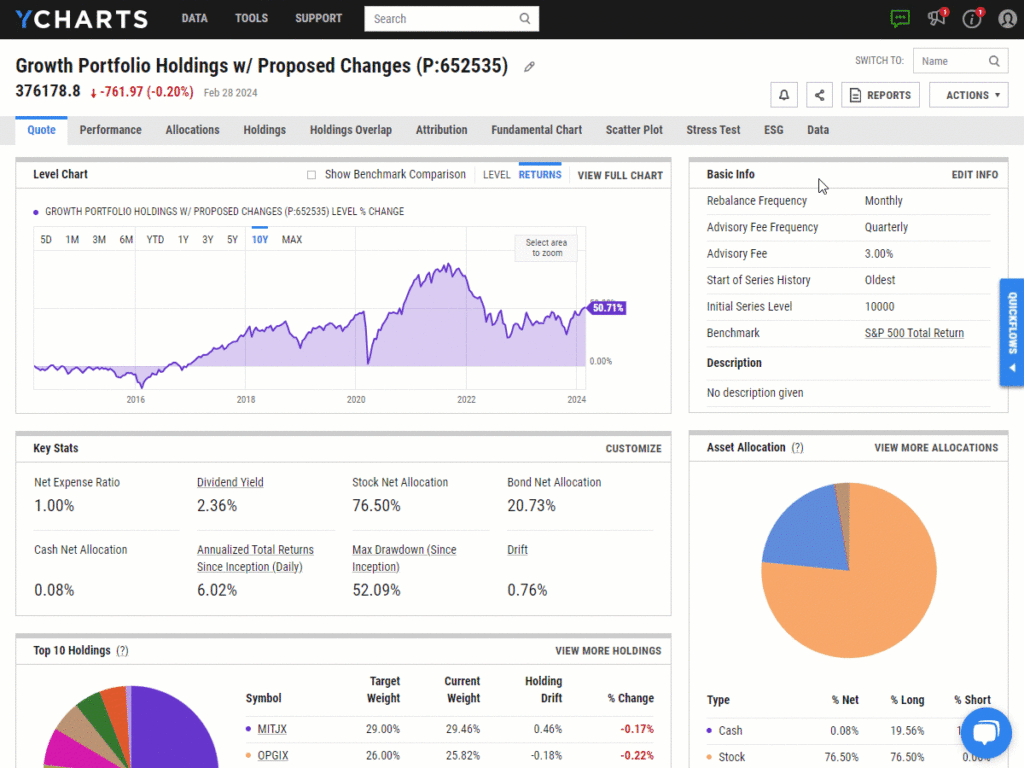
Alternatively, advisors can effortlessly generate a comprehensive one-page tearsheet overview of a portfolio with just a few clicks. This overview covers performance, risk, fundamentals, asset allocation, sector & region exposure, and more — making it perfect for your next client review meeting.
By leveraging YCharts’ Proposal templates and customizable modules, advisors can optimize their proposal generation workflow, enhancing virtual meeting communication and efficiency across their practice for accelerated AUM growth.
Streamlining Team Communication and Strategy Alignment in Virtual Settings with YCharts
While working in a virtual environment has its obvious advantages (goodbye commute times!), it also comes with challenges, particularly in terms of team alignment in wealth management. Ensuring that everyone is on the same page can be difficult with limited face-to-face interactions in the office. However, YCharts’ newly revamped Email Reports provide a possible solution for home offices and their teams, fostering collaboration and alignment regardless of physical distance.
With a user-friendly interface similar to YCharts’ Report Builder, professionals can effortlessly craft custom email reports, selecting from various modules, including Performance, Calendar, Charts, and Market Commentary. These modules empower teams to stay updated on crucial data, track market trends, and ensure alignment on key messaging, thus facilitating effective virtual communication strategies and enhancing productivity amongst teams. One of the most significant benefits of YCharts’ Email Reports is the ability to create a tailored newsletter containing only the most relevant information for you and your teams, delivered directly to your inbox.
To see the new Email Reports tool in action, check out the video below:
Additionally, YCharts’ Talking Points provide a valuable channel for your portfolio management team to create and share proprietary strategy narratives, seamlessly integrating with reports presented by client-facing advisors. With access to over 4,000 financial metrics, you can effectively showcase your models, ensuring consistent messaging across your practice. This simplifies preparation for future meetings, freeing up your team’s time for more impactful tasks.
YCharts’ comprehensive all-in-one solution revolutionizes daily workflows for advisors and wholesalers, offering not only tools for crafting impactful sales collateral but also facilitating effective virtual collaboration. By providing a platform for seamless communication and data sharing, YCharts enables wealth management professionals to overcome the challenges of virtual work environments, ensuring team alignment and maximizing productivity.
Whenever you’re ready, there are 3 ways YCharts can help you:
1. Looking for comprehensive, best-in-class data?
Send us an email at hello@ycharts.com or call (866) 965-7552. You’ll be directly in touch with one of our Chicago-based team members.
2. Want to test out YCharts for free?
Start a no-risk 7-Day Free Trial.
3. Download a copy of the Top 10 Visuals for Client and Prospect Meetings slide deck:
Disclaimer
©2024 YCharts, Inc. All Rights Reserved. YCharts, Inc. (“YCharts”) is not registered with the U.S. Securities and Exchange Commission (or with the securities regulatory authority or body of any state or any other jurisdiction) as an investment adviser, broker-dealer or in any other capacity, and does not purport to provide investment advice or make investment recommendations. This report has been generated through application of the analytical tools and data provided through ycharts.com and is intended solely to assist you or your investment or other adviser(s) in conducting investment research. You should not construe this report as an offer to buy or sell, as a solicitation of an offer to buy or sell, or as a recommendation to buy, sell, hold or trade, any security or other financial instrument. For further information regarding your use of this report, please go to: ycharts.com/about/disclosure
Next Article
A Closer Look at January Fund Flows: Active ETFs, Bitcoin, and BeyondRead More →
