June Jobs Report, ISM & Powell: What Financial Advisors Must Watch This Week
Updated 1 July 2025 – for the holiday-shortened trading week of 1–3 July
Introduction
The opening week of July compresses a month’s worth of macro catalysts into just three trading sessions. A potent combination of slowing labor data, conflicting manufacturing signals, and a pivotal speech by Fed Chair Jerome Powell could reset the rate-cut timeline before the Fourth of July fireworks even start. The June jobs report, due Thursday, will serve as the week’s centerpiece, offering critical insight into the strength of hiring, wage growth, and inflationary pressure.
Already, the Chicago PMI has slipped to its lowest level since January, gold hovers near record highs, the dollar is suffering its steepest first-half decline in five decades, and Treasury yields refuse to break lower. Layer on newly enacted tariffs that threaten to keep inflation sticky even as growth fades, and the stakes for portfolios are clear.
Read here for more insight into June’s Job Report and how to assess conflicting jobs data.
Q: What single factor matters most to advisors right now?
A: The intersection of softer labour data, tariff-driven price pressure, and the Fed’s response, because together they determine whether easing begins in Q3 or drifts toward year-end.
What we will cover:
• The real-time macro backdrop heading into Q3
• Why gold, yields, and the dollar are sending divergent signals
• What Powell and regional Fed presidents have telegraphed about policy timing
• Concrete allocation maps for three macro scenarios: soft landing, macro crack, and re-acceleration
• Practical ways to turn YCharts tools into client-ready insight without relying on visual tables or images
Market Context: The Jobs, ISM & Fed Trifecta
The week of 1 July is one of the most concentrated data bursts of the summer, squeezed into three sessions before markets close for Independence Day. For advisors, it combines backward looking labour gauges, forward looking activity surveys, and real-time policy guidance.
What has already hit the tape?
The Chicago Business Barometer (PMI) dropped to 40.4 in June, the third consecutive decline and the weakest reading since January. Any reading below fifty indicates contraction; at forty, the index sits near levels that historically mark regional recessions in heavy-industry hubs. By contrast, S&P Global’s flash Manufacturing PMI held at 52.0, signalling expansion among mid-sized firms and underscoring a widening rift between survey methodologies.
At the same time, Fed-funds futures now assign a 93% probability to a September rate cut, even as policymakers warn they need “more clarity” on how tariffs will feed into summer inflation prints.
What is still to come?
• Tuesday, 1 July: Powell speaks at 9:30 a.m. ET, followed by final S&P Manufacturing PMI and May construction spending data. His tone, whether its hawkish, dovish, or simply patient, will color every subsequent release.
• Wednesday, 2 July: The ADP Employment Report tests whether May’s shockingly low 37,000 gain was an aberration or the first crack in labour demand.
• Thursday, 3 July (pre-holiday close): Initial jobless claims, ISM Services, and the official June Jobs Report land in rapid succession. Consensus looks for payroll growth of roughly 150,000 up from 139,000 and an uptick in unemployment to 4.3 percent.
Q: What happens if Powell hints at patience despite soft data?
A: Markets may need to unwind rate-cut expectations, steepening the curve and repricing equities. Advisors should watch Powell’s tone closely, especially if he downplays weak PMIs or job softness by citing tariff-driven inflation risk.
Each data point circles the same question: Does the Federal Reserve start cutting in Q3, or do sticky prices, magnified by tariffs, force a longer wait? If Powell re-emphasises patience because “import-cost pass-through is just beginning,” markets may need to fade their own optimism.
Asset Focus: Gold, Yields & the Tariff Tension
Gold: 2025’s macro barometer
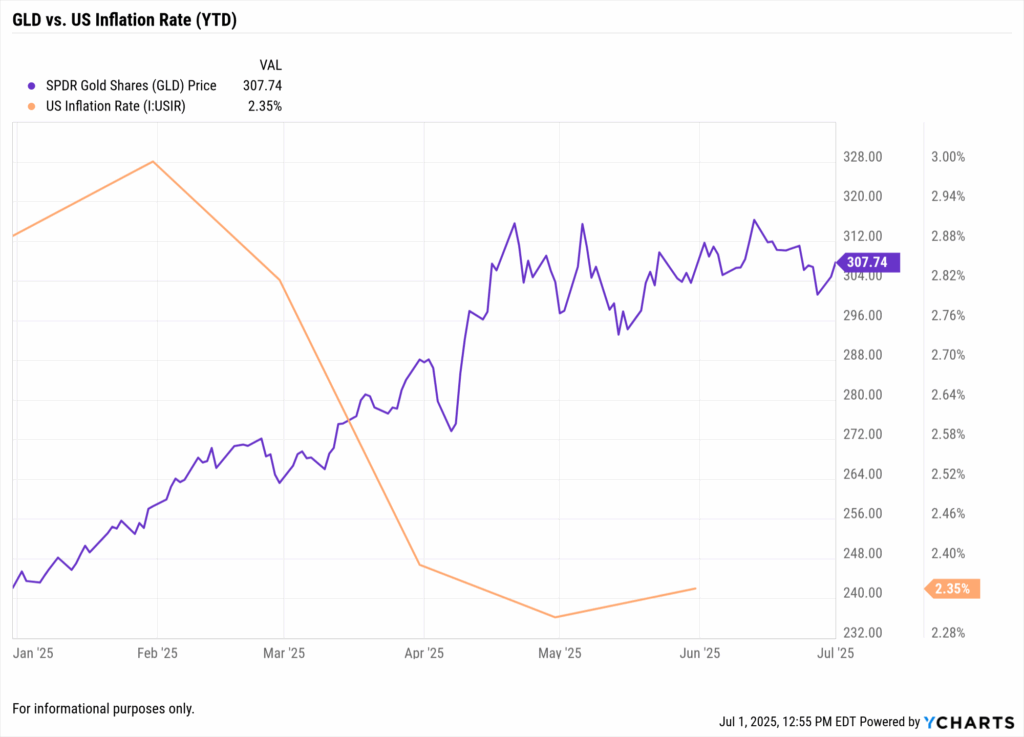
Gold’s 25% year-to-date rally is no accident. The Dollar Index is down double digits, real yields are sliding, and investors crave ballast while policy clarity evaporates. Safe haven demand has only intensified since Washington enacted new tariffs on Chinese, Mexican, and Vietnamese goods, levies expected to filter into consumer prices over the next two CPI cycles. Gold’s historically low correlation with equities makes the metal an ideal diversifier when both stocks and bonds fret about unanchored rates.
Q: Why is gold rising even though inflation appears to be easing?
A: Because real yields are falling, the dollar is weakening, and tariffs may cause inflation to return. Gold prices reflect forward-looking macro stress, not just trailing CPI. For advisors, it’s a signal that hedging demand is building.
Treasury yields: high, sticky, confusing
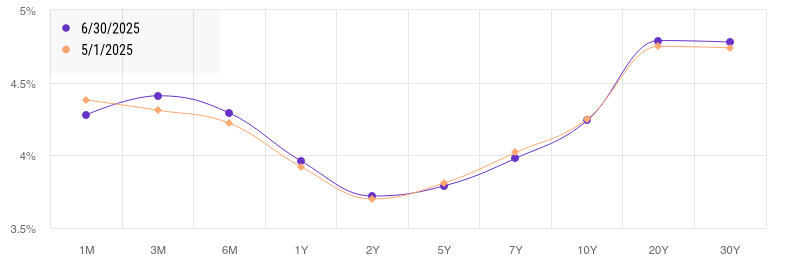
Despite recessionary whispers, the 10-year Treasury sits above 4.25 percent. Three forces keep it pinned: an unprecedented Treasury issuance calendar to fund fiscal expansion, dwindling foreign appetite thanks to punishing currency hedging costs, and persistent concern that tariffs will prevent the Fed from cutting as quickly as futures imply. A payroll print meaningfully below 100,000 could finally trigger a durable rally in duration; otherwise, bond investors face two-sided risk.
Q: Why haven’t bond yields fallen more despite weak economic signals?
A: Supply pressures, foreign demand shifts, and the Fed’s wait and see approach are keeping yields sticky. Advisors should be careful not to assume lower yields are inevitable without a decisive dovish turn from Powell.
The dollar: breaking down
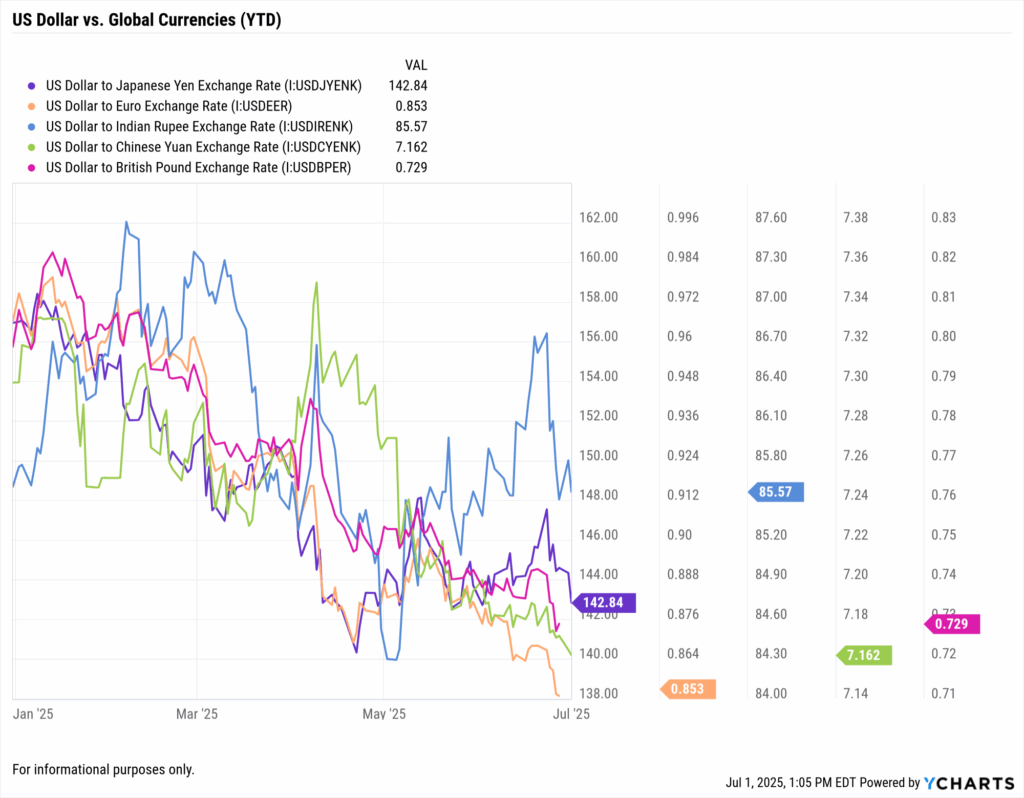
With a 10.5% slide this year, the Dollar Index just logged its worst first half since the early-1970s float. A soft currency amplifies international and emerging-market equity returns in USD terms, fattens multinational earnings through translation gains, and tends to lift commodity prices, especially metals. Advisors carrying heavy home bias may find that even a modest tilt toward currency hedged developed market funds or unhedged EM strategies improves forward return potential without an outsized volatility cost.
Equity sector rotation: follow the macro
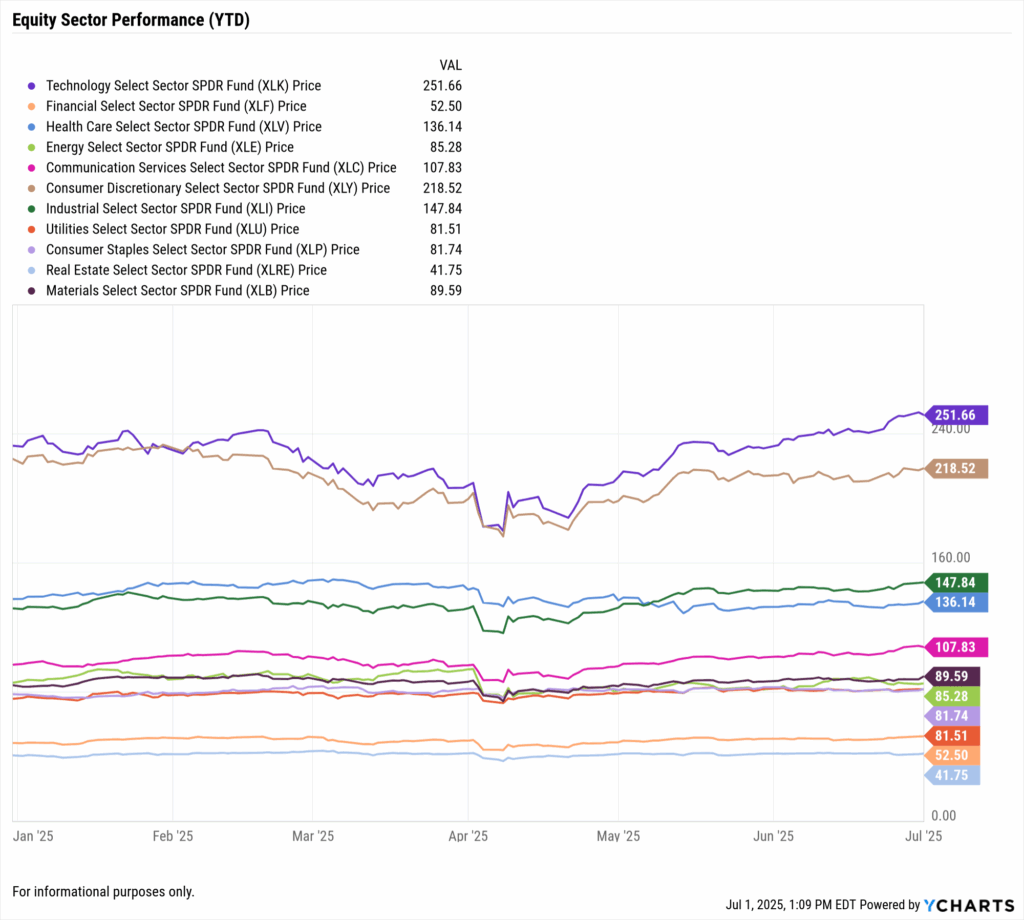
Technology and Consumer Discretionary now lead the S&P 500 year-to-date, classic late cycle behaviour when investors prioritise stable cash flow over cyclicality. Technology still claims leadership on AI momentum but remains tethered to real-rate trajectories. Industrials and Materials trail amid weak PMIs and trade friction; unless ISM rebounds, their under-performance could widen. YCharts’ Sector Performance dashboard, viewed in absolute numbers rather than graphics, surfaces these leadership shifts in seconds.
Portfolio Strategy: How Advisors Should Position This Week
Because markets can pivot on a single data surprise, advisors need three rehearsed playbooks ahead of the June Jobs Report.
Scenario 1 – Soft Landing, Delayed Cuts
ISM holds near 50, Powell strikes a cautious tone, payrolls land close to one-hundred-fifteen-thousand, unemployment ticks up to 4.3 percent.
Allocation calls
- Keep fixed-income duration near benchmark and resist stretching for yield until the Fed’s path is clearer.
- Lean into high-quality growth – Cash-rich mega-cap tech and durable-earnings healthcare innovators.
- Maintain a 2% to 5% gold sleeve as asymmetric insurance.
Scenario 2 – Macro Crack, Early-Cut Signal
Payrolls collapse below 75,000, ISM Services slips under fifty, Powell hints the Fed is “prepared to act.”
Allocation calls
- Extend duration – 10-year Treasury ladders or long-bond ETF sleeves lock in coupons before the rally.
- Over weight defensives – Healthcare, utilities, low-volatility factor funds.
- Consider downside buffers – Defined-outcome products or collar overlays.
Scenario 3 – Re-acceleration Risk
Payrolls exceed 200,000, both PMIs rebound, CPI re-firms as tariffs raise import costs.
Allocation calls
- Shorten duration – Favor floating-rate notes, ultra-short corporates, or cash-plus strategies.
- Tilt toward cyclicals, energy and industrials benefit if global demand and input prices rise together.
- Hedge rate volatility using Treasury ladders or inflation-linked bonds.
Structural inflation guardrails
Regardless of weekly prints, tariff-induced cost-push inflation represents a medium-term risk unlike the demand-driven spikes of 2021-2022. Advisors managing retirement glide paths should re-model plans under a 3.5% long-run CPI assumption.
YCharts Tools in Action: Insight Without Tables
- • Yield-Curve Tool — overlays today’s curve on 2001, 2007, and 2019 regimes so clients see why steepening often precedes easier policy.
- • Sector Heat Map — ranks weekly and year-to-date performance; textual callouts make leadership rotations obvious without visuals.
- • Scenario Analysis — clones a client allocation and toggles rate and inflation inputs so you can narrate risk, return, and max-drawdown deltas on the fly.
All tools generate compliance-ready PDFs – no tables, screenshots, or manual data wrangling required.
Conclusion
This compressed week could redefine 2025’s macro narrative. Soft indicators whisper slowdown; tariff pressure keeps inflation’s embers alive; and the Fed walks a tightrope between supporting growth and defending credibility. The June jobs report will anchor that balancing act, either reinforcing the case for rate cuts or forcing markets to reassess. If the data endorses dovish expectations, bonds should firm and defensives retain leadership. If the data discredits them, duration will cheapen and cyclicals may claw back ground.
Either way, the advisors who earn client confidence will be those who have practiced every scenario, quantified each risk, and prepared an action plan well before Thursday’s closing bell. YCharts’ client communication-ready dashboards turn that preparation into advisor advantage.
Whenever you’re ready, here’s how YCharts can help you:
1. Looking to Move On From Your Investment Research and Analytics Platform?
2. Want to test out YCharts for free?
Start a no-risk 7-Day Free Trial.
Disclaimer
©2025 YCharts, Inc. All Rights Reserved. YCharts, Inc. (“YCharts”) is not registered with the U.S. Securities and Exchange Commission (or with the securities regulatory authority or body of any state or any other jurisdiction) as an investment adviser, broker-dealer or in any other capacity, and does not purport to provide investment advice or make investment recommendations. This report has been generated through application of the analytical tools and data provided through ycharts.com and is intended solely to assist you or your investment or other adviser(s) in conducting investment research. You should not construe this report as an offer to buy or sell, as a solicitation of an offer to buy or sell, or as a recommendation to buy, sell, hold or trade, any security or other financial instrument. For further information regarding your use of this report, please go to: ycharts.com/about/disclosure
Next Article
May ETF Flows Show Investors Bracing for Rate Cuts and Reaching for YieldRead More →