May 2025’s Top Market Movers: Stocks, ETFs, and Mutual Funds That Led the Way

Why This Matters
For advisors and investors, keeping tabs on top-performing securities helps uncover sector momentum, spot tactical opportunities, and validate or challenge existing portfolio strategies. May was full of surprises, but also full of opportunity. In this blog, we break down the top market movers of May 2025 across stocks, ETFs, and mutual funds.
This blog breaks down:
- Top 10 Stocks in the Russell 3000 by Monthly Return
- Best-Performing ETFs with AUM over $100M
- Highest-Gaining Mutual Funds, excluding duplicate share classes
- Trends behind the performance and how YCharts tools can support due diligence
Read June 2025’s Top Market Movers or The Best Performing Stocks of the Last 25 Years to gain deeper insight into the overall market.
Top Performing Stocks in May 2025
The Russell 3000 had an energetic month driven by volatility in healthcare, financials, and emerging tech. Here are the 10 top gainers:
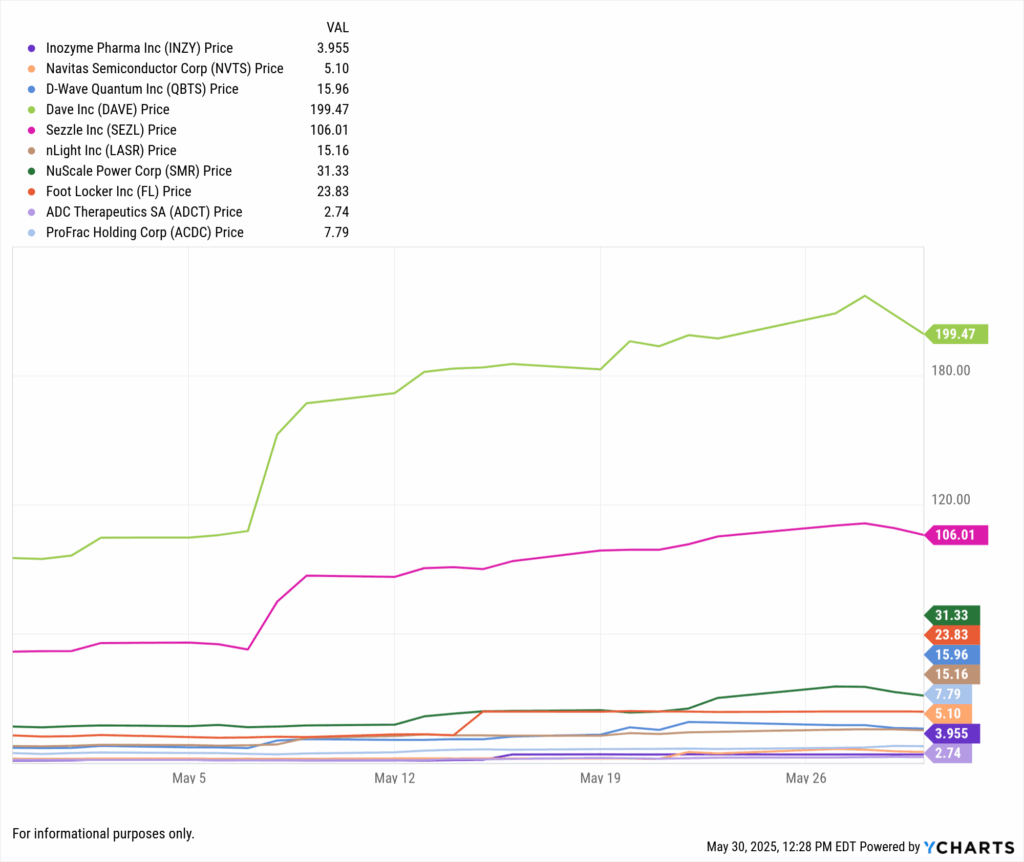
In May 2025, several stocks within the Russell 3000 index exhibited remarkable performance, driven by sector-specific catalysts and company-specific developments.
Notable Performers:
- Inozyme Pharma Inc (Health Care): Achieved a staggering 243.5% return, likely propelled by positive clinical trial results or regulatory approvals in the biotech space.
- Navitas Semiconductor Corp (Information Technology): Posted a 179.3% gain, reflecting strong demand in the semiconductor industry and potential breakthroughs in energy-efficient technologies.
- D-Wave Quantum Inc (Information Technology): With a 135.5% increase, this quantum computing company may have benefited from advancements in quantum technology applications.
- Dave Inc and Sezzle Inc (Financials): These fintech firms saw returns of 119.7% and 110.1%, respectively, possibly due to increased adoption of digital financial services.
YCharts Tools for Analysis:
- Stock Screener: Filter stocks based on performance metrics, sector, and market capitalization to identify emerging leaders.
- Fundamental Charts: Visualize financial trends and compare company performance over time.
Top Performing ETFs in May 2025 (AUM > $100M)
Digital assets and leveraged equity strategies dominated ETF returns in May. Notably, Ethereum-focused products took the top two spots, thanks to a rally driven by ETF optimism and improved macro sentiment. Here are the top 10 ETF performers:
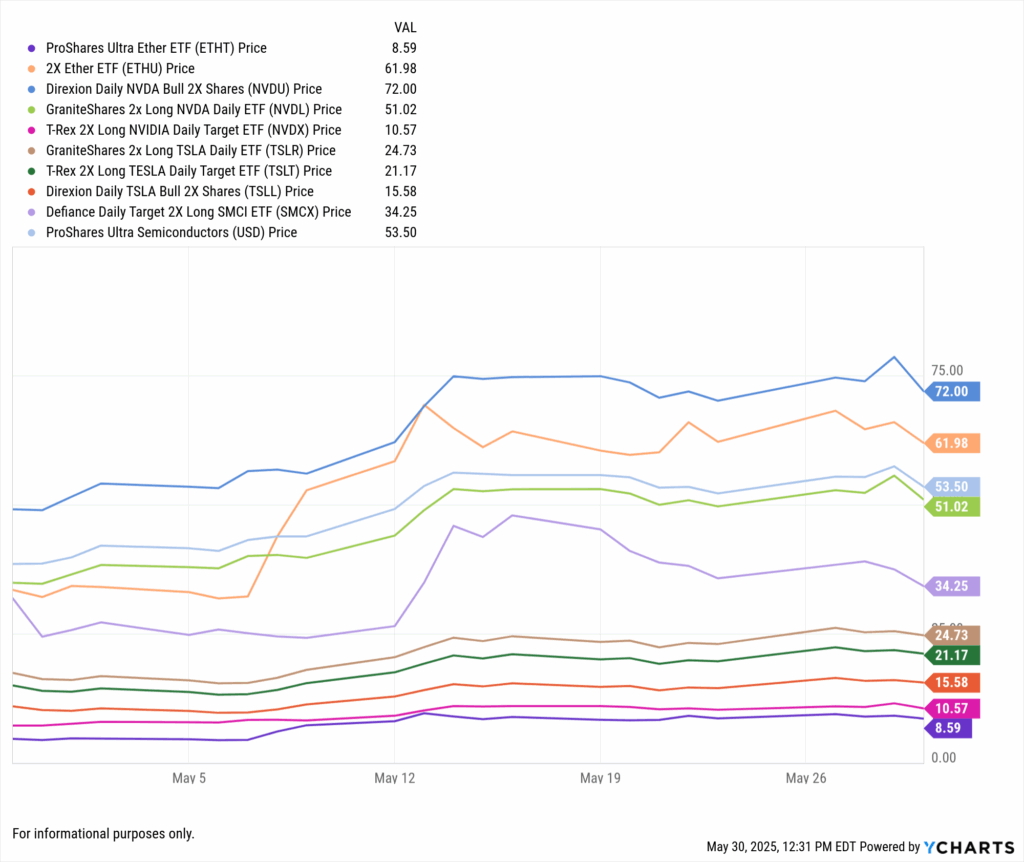
The ETF market in May 2025 was characterized by significant gains in leveraged and thematic funds, particularly those focused on technology and digital assets.
Top ETFs:
- ProShares Ultra Ether ETF and 2X Ether ETF (Digital Assets): Both funds returned over 105%, reflecting the bullish trend in Ethereum and investor interest in cryptocurrency exposure.
- Leveraged Equity ETFs: Funds such as Direxion Daily NVDA Bull 2X Shares and GraniteShares 2x Long NVDA Daily ETF posted returns around 60%, driven by strong performance in semiconductor stocks.
YCharts Tools for Analysis:
- ETF Screener: Identify ETFs based on asset class, performance, and expense ratios.
- Total Return Comparison: Compare the performance of multiple ETFs over specific time frames.
Best Performing Mutual Funds in May 2025 (AUM > $100M)
Many of the top mutual funds mirrored ETF trends due to structural similarities and market exposure. Here are the standouts:
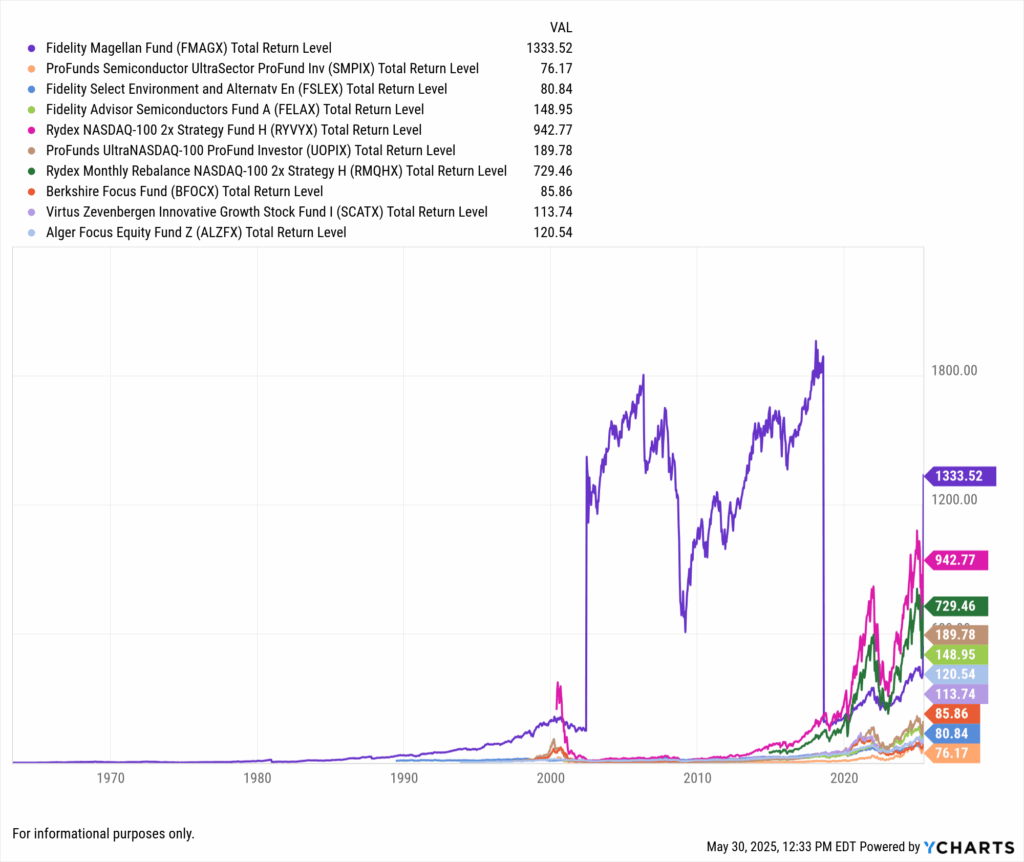
Mutual funds focusing on digital assets and leveraged equity strategies led the pack in May 2025, mirroring trends observed in the ETF space.
Leading Mutual Funds:
- ProShares Ultra Ether ETF and 2X Ether ETF (Digital Assets): These funds achieved returns exceeding 105%, aligning with the surge in Ethereum prices.
- Leveraged Equity Funds: Funds like Direxion Daily NVDA Bull 2X Shares and GraniteShares 2x Long NVDA Daily ETF delivered returns around 60%, capitalizing on the robust performance of tech stocks.
YCharts Tools for Analysis:
- Mutual Fund Screener: Filter funds based on performance, category, and risk metrics.
- Peer Comparison: Evaluate mutual funds against peers to assess relative performance.
Key Trends: What’s Driving the Surge?
Crypto Confidence: Ethereum-linked products soared following fresh momentum around regulatory clarity and rising retail demand.
NVIDIA Mania: Leveraged NVIDIA ETFs and funds saw massive inflows following continued AI enthusiasm and bullish earnings.
Healthcare Rebound: Small-cap biotech names staged a comeback, driven by clinical breakthroughs and short squeezes.
Strategic Insights for Advisors
- Sector Rotation: The outperformance of biotech and fintech stocks suggests a shift in investor focus, highlighting the importance of sector analysis in portfolio construction.
- Leveraged Exposure: The success of leveraged ETFs and mutual funds indicates a risk-on sentiment among investors, emphasizing the need for careful risk assessment.
- Digital Assets Integration: The strong performance of digital asset funds underscores the growing acceptance of cryptocurrencies in diversified portfolios.
YCharts Advantage:
Utilize YCharts’ comprehensive suite of tools to monitor market trends, perform in-depth analyses, and generate client-ready reports, facilitating informed investment decisions.
Final Thoughts
The top movers in May give advisors a tactical lens into what’s hot—but the real opportunity lies in the “why.” Whether you’re reallocating sectors, searching for momentum plays, or comparing products for new allocations, YCharts provides the tools to turn headlines into actionable portfolio decisions.
Continue reading >> Best Performing Mutual Funds of the Last 10 Years
Whenever you’re ready, here’s how YCharts can help you:
1. Looking to Move On From Your Investment Research and Analytics Platform?
2. Want to test out YCharts for free?
Start a no-risk 7-Day Free Trial.
3. Sign up for a copy of our Fund Flows Report and Visual Deck to stay on top of ETF trends:
Sign up to recieve a copy of our monthly Fund Flows Report:Disclaimer
©2025 YCharts, Inc. All Rights Reserved. YCharts, Inc. (“YCharts”) is not registered with the U.S. Securities and Exchange Commission (or with the securities regulatory authority or body of any state or any other jurisdiction) as an investment adviser, broker-dealer or in any other capacity, and does not purport to provide investment advice or make investment recommendations. This report has been generated through application of the analytical tools and data provided through ycharts.com and is intended solely to assist you or your investment or other adviser(s) in conducting investment research. You should not construe this report as an offer to buy or sell, as a solicitation of an offer to buy or sell, or as a recommendation to buy, sell, hold or trade, any security or other financial instrument. For further information regarding your use of this report, please go to: ycharts.com/about/disclosure.
Next Article
How Treasury Yields Are Influencing Crypto and What Advisors Need to KnowRead More →