
Meet Y: Your Specialized AI Agent
Interested in testing out YCharts for free?
Start 7-Day Free TrialThe modern financial professional is juggling a myriad of responsibilities. On any given day, they’re preparing for client meetings, constructing and monitoring portfolios, and conducting investment research, all while tracking constant market developments.
Each task is essential, yet together they reduce the amount of time spent building relationships with clients and prospects. The preparation work required to guide clients with confidence can consume hours, and time doesn’t scale as financial practices grow.
YCharts’ new AI agent, Y, is designed to give your time back. Y is far more than a standard chatbot; with full awareness of the YCharts ecosystem and cross-functionality between tools, Y executes research, analysis, and client communication tasks from a single prompt.
Think of Y as your personal AI analyst embedded across the platform, sourcing the institutional-quality data you already rely on in YCharts. Every output includes compliance guardrails, customizable disclosure language, and 16 years of regulatory experience built in.
Table of Contents
Amplify Your Output Capabilities
Y is purpose-built to handle the busywork that eats up so much of a financial professional’s time. You can work alongside Y, delegating specific tasks as you move throughout your day, or hand off projects entirely.
Before your next client meeting, have Y convert prospect statements into portfolios in YCharts while you give your full attention to the client sitting in front of you. It runs in the background and notifies you when complete, handling the manual tasks you have been struggling to find the time for.
You can even schedule prompts to be completed at a later date, or set them up on a recurring basis so you never miss a beat.
For example, you can ask Y to:
“Generate a tear sheet for each of the top 5 holdings in my Growth Model. Ping me when it’s ready.”
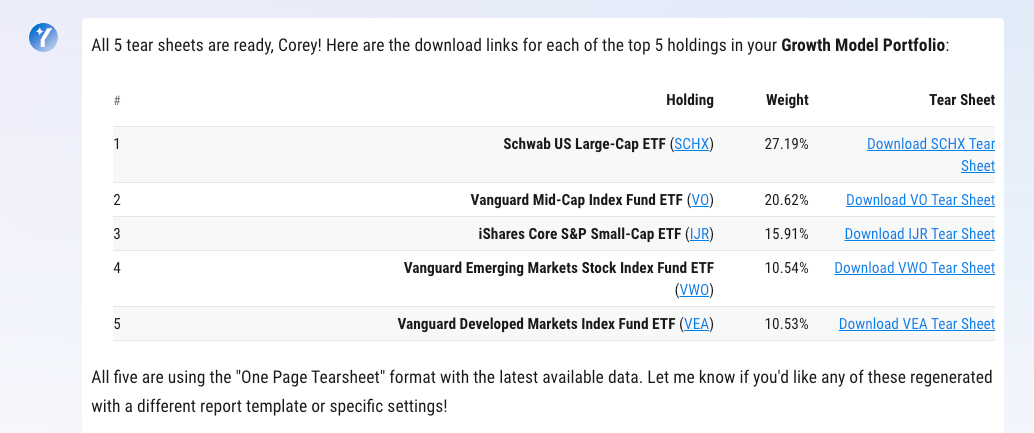
The result is five tear sheets pulled from your pre-existing model portfolio, ready for download without ever leaving your existing workflow. Y’s ability to work alongside you means less time jumping between multiple tasks and more uninterrupted productivity.
Reports and Proposals Simplified
The process of building compelling proposals or comparison reports has traditionally required hours of manual data entry and formatting before you can even begin your analysis. With the help of Y, you can capture holdings data from uploaded portfolio files, including statements, spreadsheets, images, and screenshots, and load them directly into YCharts.
“Attached is my prospect’s brokerage statement. Analyze their current holdings and recommend a model portfolio optimized for long-term growth potential. Run a comparison report.“
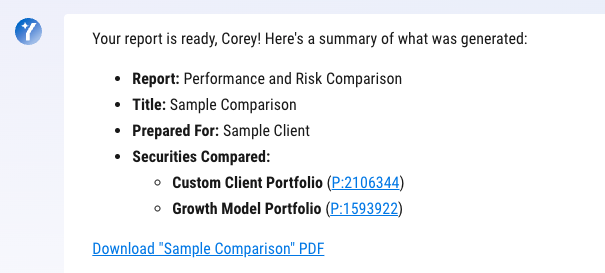
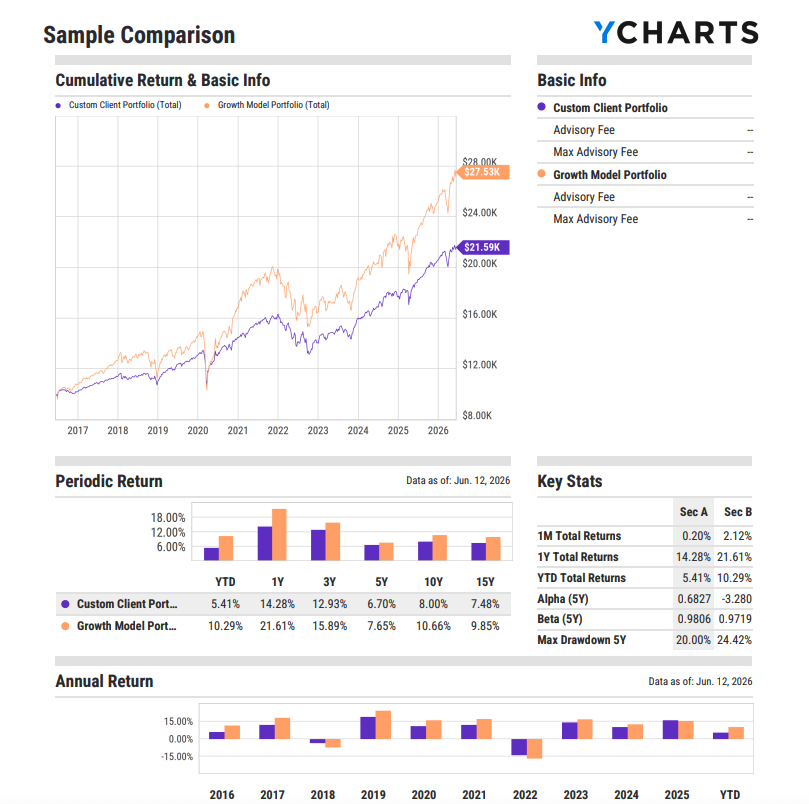
What once required tedious, manual data entry is now a refined comparison between your prospect’s holdings and a suggested model of your own. From here, you can ask Y to compile key talking points and charts for your meeting, ensuring your entire pitch turns each prospect conversation into your next client.
Consistent Client Communication
Maintaining consistent communication with clients is one of the most essential, yet overlooked, aspects of an advisor’s practice when research and meeting prep consume the majority of their time.
Despite all the hard work taking place behind the scenes, gaps in communication can slowly erode the trust clients place in their advisor. With Y, you no longer have to struggle to find the time for client outreach.
Because Y operates across all areas of YCharts, it can pull from specific client portfolios to generate personalized touchpoints for each client. For broader content needs, point Y to your dashboards and existing assets to surface insights worth sharing across your entire practice.
For example, if you wanted to give your clients an update on the health of the economy and Fed rate expectations, ask Y to:
“Summarize all of the data on my Fed Overview dashboard and write a synopsis on what has changed in the economy this year.”
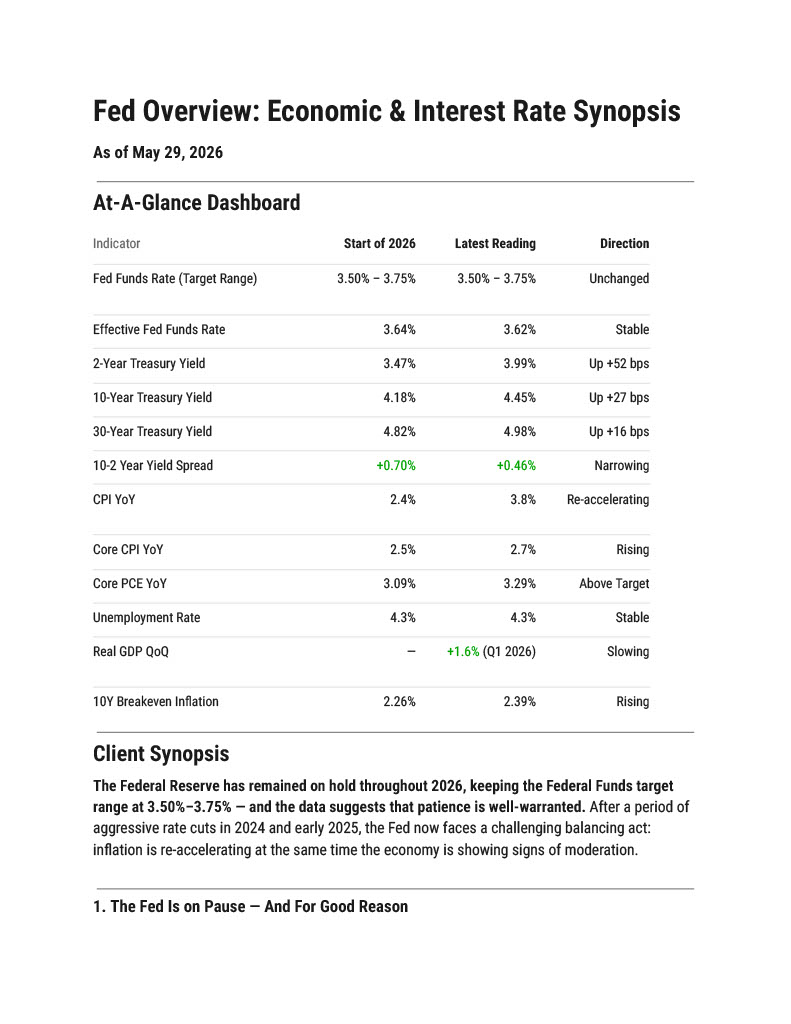
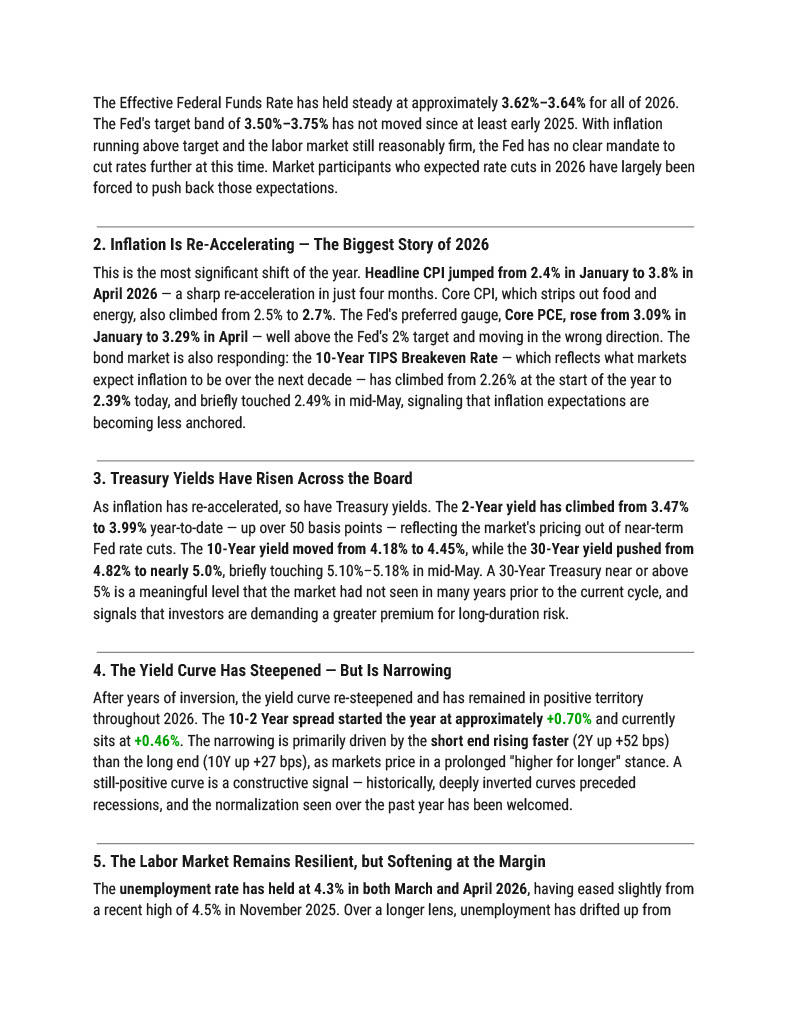
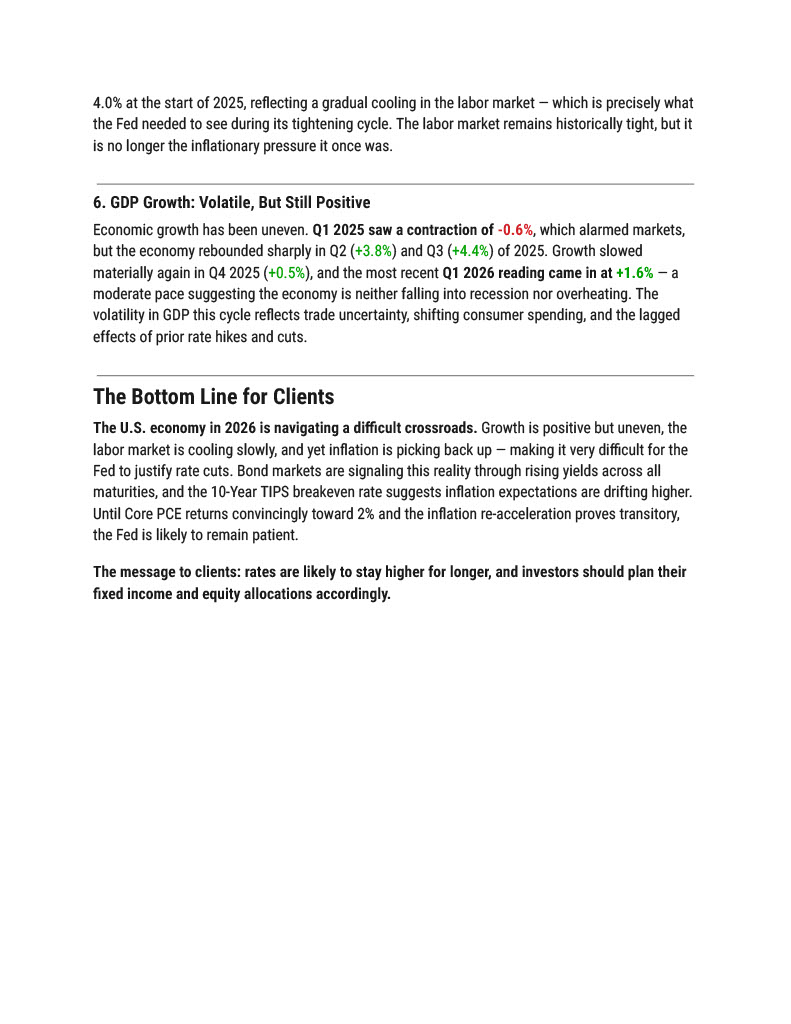
Click images to read Y’s full comprehensive breakdown!
Y reads every data point on your dashboard and returns a clear, structured summary ready to be dropped into a newsletter, client email, or upcoming meeting agenda. Save these prompts or schedule them on a recurring basis so that client communication is no longer an afterthought when time gets away from you.
Smarter Investment Research and Analysis
Y brings institutional-grade research capabilities to every prompt. With instant access to 4,000+ metrics across 100,000 securities, 500,000+ economic indicators, and SEC filings, Y eliminates the need to manually analyze vast financial datasets.
With market conditions monitored continuously and refreshed every 15 minutes, you can confidently generate up-to-date insights through simple queries, such as:
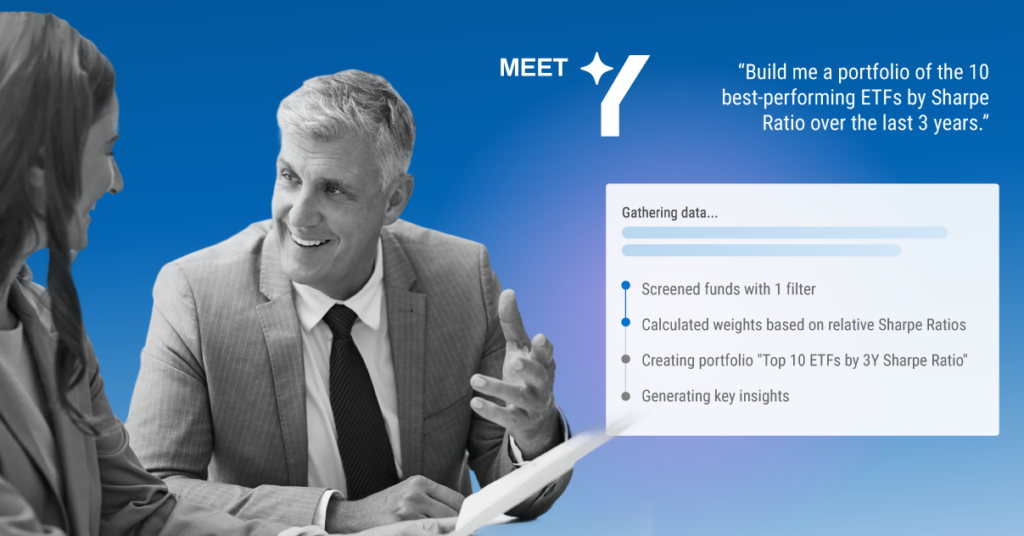
“Find me the 10 best-performing ETFs by Sharpe Ratio over the last 3 years. Build a portfolio weighted by their relative Sharpe Ratio.”
Y’s understanding of the entire YCharts platform means outputs from one prompt can flow directly into the next. Follow up with:
“I’m on the Top ETFs by Sharpe Ratio portfolio page. Build a chart showing 3-year performance vs. the S&P 500.”
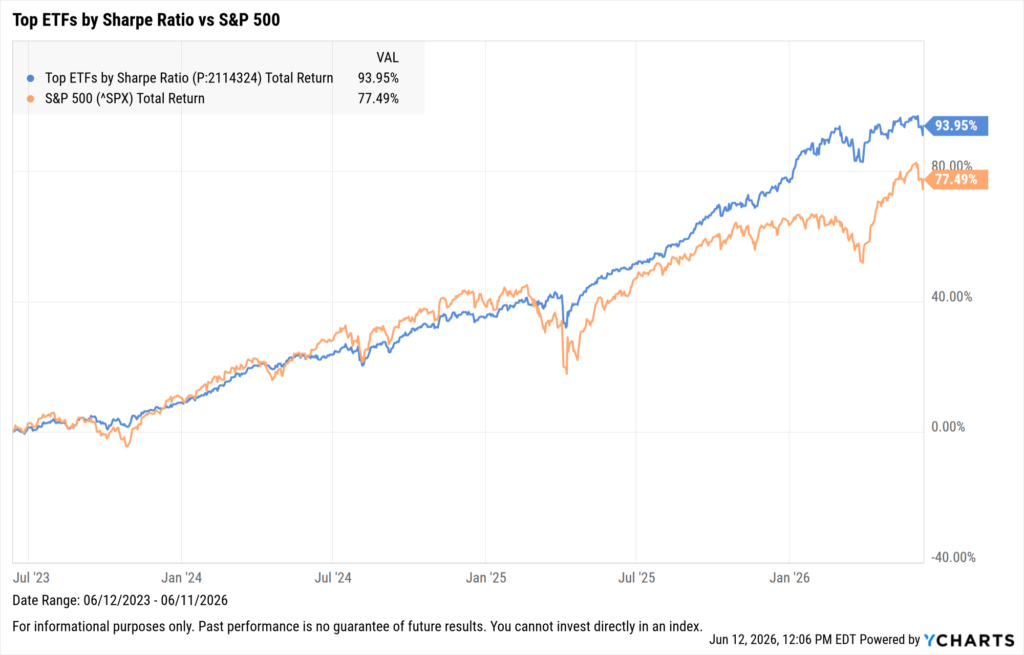
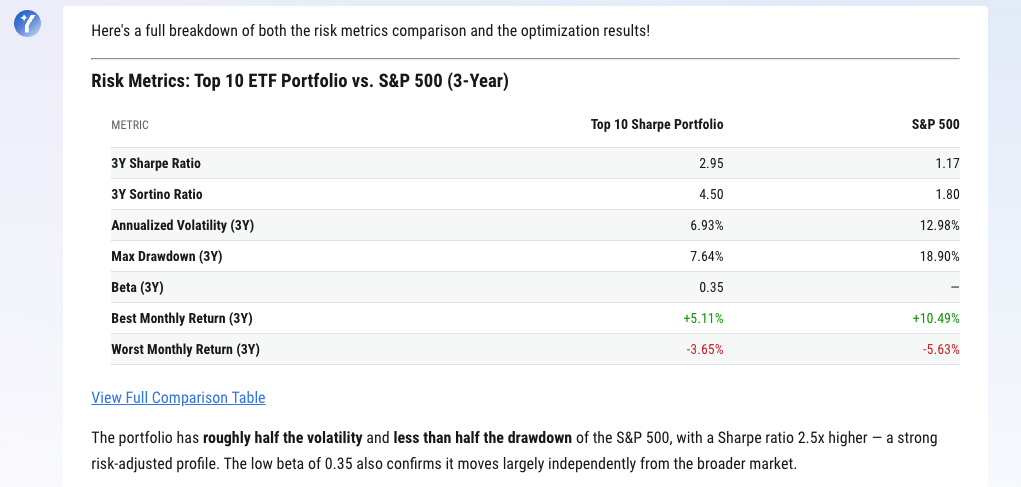
From here, you can take it a step further by querying for comparisons of risk metrics such as volatility and max drawdown. Within seconds, Y delivers a comprehensive risk breakdown and portfolio recommendations, in a fraction of the time it would have taken to work through these steps manually.
A Master in YCharts Built for Financial Professionals
Y’s ability to support you across every stage of your workflow in YCharts sets it apart from existing chat-based AI tools. You no longer need to manually understand every corner of the platform to harness its full capabilities.
Y is a master in all things YCharts, and each of its features amplifies the next, compounding your professional productivity in a platform trusted throughout the financial industry.
Whether conducting market research, drafting proposals, or staying connected with clients, Y is an extension of your expertise. It doesn’t just surface information; it completes tasks, enabling you to reclaim your most valuable asset and spend more of it with the clients who matter most.
Y is included in all YCharts subscriptions. Every account comes with a monthly credit allotment to get you started, with additional usage packages available after July 16. To learn more or book a demo, visit the YCharts website or contact hello@ycharts.com.
Ready to Move On From Your Investment Research and Analytics Platform?
Follow YCharts Social Media to Unlock More Content!
Next Article
Working the Core: Where Bond ETF Flows Are Heading in 2026Read More →