Monthly Market Wrap: July 2022
Welcome back to the Monthly Market Wrap from YCharts, where we review and break down the most important market trends for advisors and their clients every month. As always, feel free to download and share any visuals with clients and colleagues, or on social media.
Want the Monthly Market Wrap sent straight to your inbox? Subscribe below:
Are you based in Canada or following Canadian markets? Check out and subscribe to the Monthly Canada Market Wrap from YCharts.
July 2022 Market Summary
July was a welcomed reprieve for US equity investors. The Dow Jones Industrial Average rose 6.8%, the S&P 500 got a 9.2% boost, and the NASDAQ surged 12.4%. July brought with it a slew of earnings reports that many feared would disappoint amid high inflation and a rising rate environment, but generally came in above expectations. Despite the advances made in July, US indices are still firmly in the red for 2022. The Dow is off 8.6% year-to-date, the S&P 500 is 12.6% lower and the NASDAQ is just within bear market territory, down 20.5%.
Not a single sector was negative in July. The cyclical sectors of Consumer Discretionary and Technology scored big wins in July, rising 18.4% and 13.5% respectively. Behind them was a 9.7% gain made by Energy and 9.5% by Industrials. Reports that the Federal Reserve may slow or even end its current rate hike cycle were primarily responsible for sending these rate-sensitive sectors higher. Defensive sectors got a lift as well—both Health Care and Consumer Staples were up 3.2% in July.
Inflation surpassed the 9% mark for the first time since 1981, clocking in at 9.06% last month. Adding to the broader economic picture was Q2 GDP data—the US Economy contracted for the second consecutive quarter and therefore fit the technical definition of a recession. In housing, both new and existing home sales declined significantly while the supply level of existing homes rose to its highest level in two years. Finally, data on the employment front showed the unemployment rate remained unchanged at 3.6% for a fourth consecutive month, but the labor force participation rate is still struggling to reclaim its pre-pandemic high set in February 2020.
The US treasury yield curve inverted across multiple spreads as of the end of July. Rates on the 1-Year and 6-Month T-Bills were higher than those on the 2-Year, 3-Year, 5-Year and 10-Year Notes. These two short-term instruments also topped 3% for the first time since January of 2008, continuing their rapid rise as the Federal Reserve hikes its key interest rate at a historic pace. Finally, July saw long-term interest rates decline in several regions across the globe, in addition to North America.
Jump to Fixed Income Performance
Off the YCharts! Yields Turned Upside Down
It’s been stated that every economic recession since the 1970s has been preceded by an inverted US Treasury yield curve. In July the yield curve inverted across several different spreads and the technical definition of a recession, two consecutive quarters of negative GDP growth, was also met. Two of the most closely followed yield spreads are the 10-2 Year and 10 Year-3 Month spreads, but additional spreads across the yield curve can be plotted using YCharts. See below.
The one thing these three yield spreads have in common? Looking back to 1982, all three of these spreads turned negative before or during a recession. The only exception was the 30 Year-6 Month spread, which fell as low as 5 basis points in August 2019 before the recession of 2020. But having inverted in July 2022 along with the 10 Year-6 Month, is any sort of prolonged recession lingering around the corner?
To learn more about the implications of inverted yield curves, check out our related post:
Inverted Yield Curve: What It Means and How to Navigate It
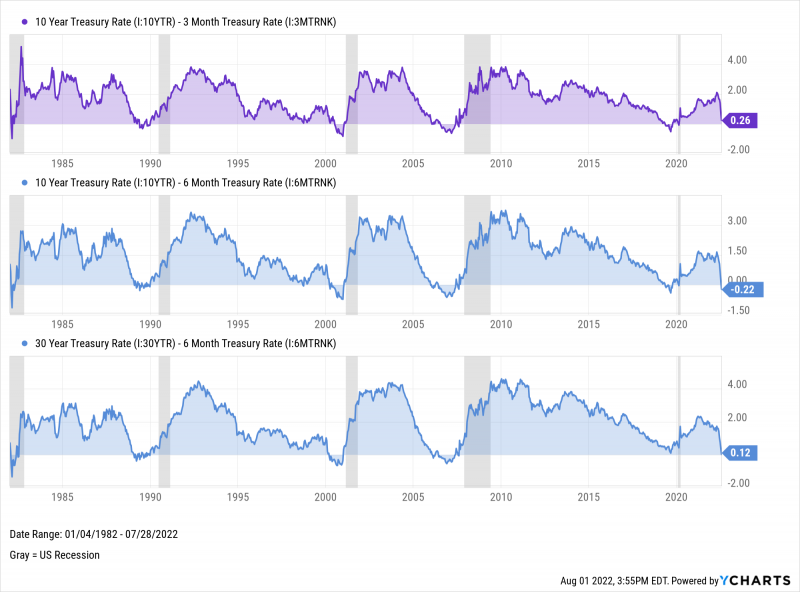
Download Visual | Modify in YCharts
Equity Performance
Major US Indexes
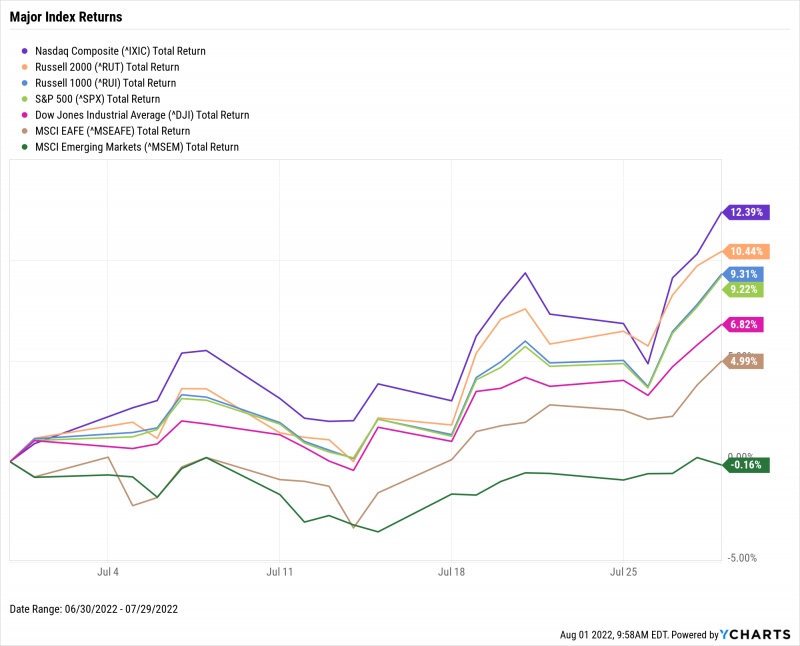
Download Visual | Modify in YCharts | View Below Table in YCharts
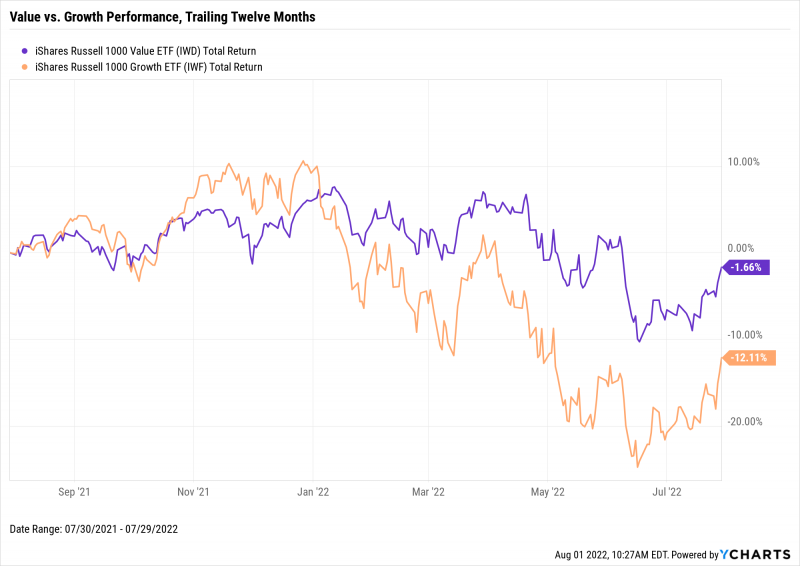
Value vs. Growth Performance, Trailing Twelve Months
In July, both Value and Growth stocks made significant jumps higher and the iShares Russell 1000 Value ETF (IWD) is now down just 1.7% over the last twelve months, thanks to a 6.6% gain in July alone. Its Growth (IWF) counterpart rose 12.1% in July and exited bear market territory as a result.
Download Visual | Modify in YCharts
US Sector Movement
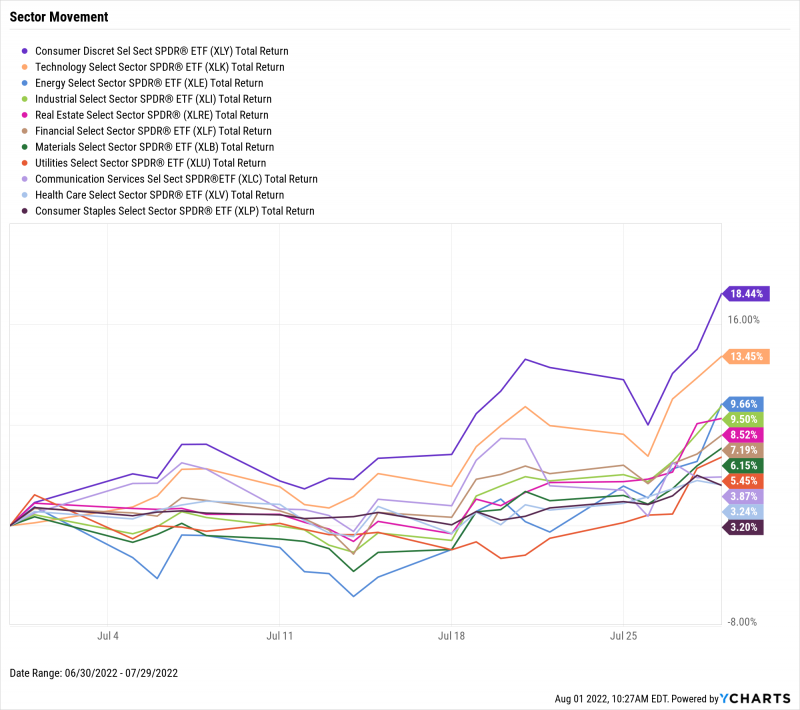
Download Visual | Modify in YCharts | View Below Table in YCharts
Hot Stocks: Top 10 S&P 500 Performers of July 2022
Enphase Energy (ENPH): 45.6% gain in July
Etsy (ETSY): 41.7%
United Rentals (URI): 32.8%
ON Semiconductor (ON): 32.7%
Tesla (TSLA): 32.4%
Bath & Body Works (BBWI): 32.0%
Ford Motor (F): 32.0%
SolarEdge Technologies (SEDG): 31.6%
Nucor (NUE): 30.1%
Netflix (NFLX): 28.6%
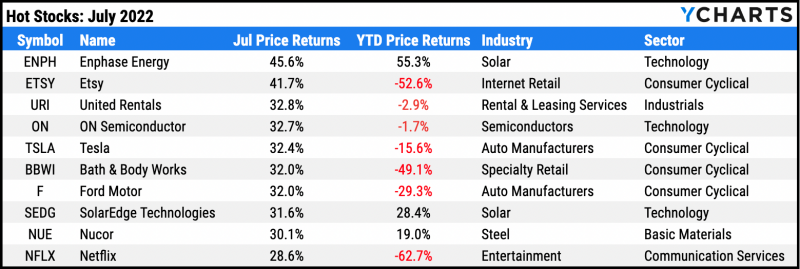
Download Visual | Modify in YCharts
Laggards & Losers: 10 Worst S&P 500 Performers of July 2022
Newmont (NEM): -24.1% decline in July
Cincinnati Financial (CINF): -18.2%
Baker Hughes (BKR): -11.0%
AT&T (T): -10.4%
Verizon Communications (VZ): -9.0%
Baxter International (BAX): -8.7%
WR Berkley (WRB): -8.4%
Charter Communications (CHTR): -7.8%
Allstate (ALL): -7.7%
Viatris (VTRS): -7.4%
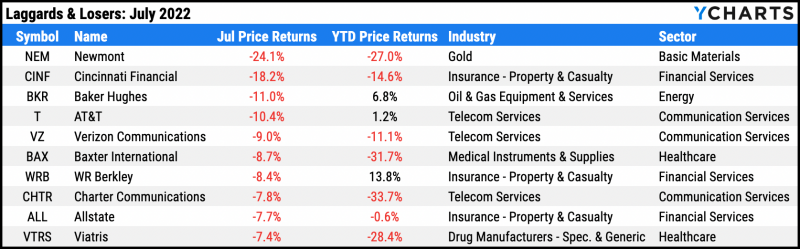
Download Visual | Modify in YCharts
Economic Data
Employment
The unemployment rate held at 3.6% for the fourth straight month in June, but the labor force participation rate declined by 0.1 percentage point to 62.2%. As of June, labor force participation remains 1.2 points below its relative peak, seen in February 2020, despite unemployment being near an all-time low level. On a regional level, Florida’s unemployment rate of 2.8% was the lowest state unemployment across a list of 10 major states. Illinois’s and Pennsylvania’s 4.5% tied for the highest unemployment rates on the list.
Production and Sales
After declining for the first time in five months, US Retail and Food Services Sales rebounded in June and rose 1%. On the manufacturing front, June’s US ISM Manufacturing PMI reading slipped 0.2 points to 52.80. The ISM Manufacturing PMI has fallen six full points YTD, but levels above 50 are still considered expansionary. Lastly, Real GDP data showed the US economy contracted by 0.9% in Q2 2022. This marks the second consecutive quarter of declining GDP and the technical definition of a recession.
Housing
The number of new US Single-Family Houses Sold plummeted 8.1% MoM in June. This follows two months of double-digit declines in March and April, and 6.3% growth (adj.) in May. Existing Home Sales slipped 5.4% in June, marking the fifth straight month of declines. Existing Home Months’ Supply rose by four-tenths to 3.0 which is its highest level in two years. Despite the overall slowdown in the housing market, the US Existing Home Median Sales Price reached an all-time high of $416,000.
Consumers and Inflation
The US Inflation Rate topped 9% last month for the first time since November 1981. June’s inflation figure of 9.06% represented a monthly increase of 0.48 percentage points. However, US Core Inflation, which excludes food and energy costs, declined for the second consecutive month to 5.92%. Prices increased at the fastest clip since September 2005, with the US Consumer Price Index rising 1.32%. Finally, personal spending was up 1.07% in June.
Gold
The Price of Gold fell for the fourth straight month by 3.5% to $1,753.40 USD per ounce. Gold-related investment vehicles lost some of their shine as a result—the SPDR Gold Shares ETF (GLD) slipped 2.6% in June, while the VanEck Gold Miners ETF (GDX) fell 4.1%. Gold is down 2.9% year-to-date, even as Purchasing Power of the US Dollar has weakened by 6.1% in 2022.
Oil
The spot price for WTI crude was under $100 per barrel as of July 25th, while the price of Brent declined 9.7% in July. The fall in oil prices translated into some relative savings at the pump. The average price of regular gas fell to $4.44 per gallon and $5.14 per gallon for premium as of July 25th. Still, the average gallon of regular gas is 28% more expensive compared to the start of the year.
Cryptocurrencies
The “crypto winter” of 2022 somewhat melted away in July as investors increased their risk appetite. Bitcoin’s price in USD rose by 17.6% to $23,653 as of July 31st. Binance Coin shot 31% higher to $287.36 at month’s end. The biggest winner among major cryptocurrencies was Ethereum, whose 54.4% surge in July brought its price to just shy of $1,700. Year to date, Binance Coin is 44.6% lower, Bitcoin is down 49.9%, and Ethereum is 54.3% in the red.
Featured Market & Advisor News
U.S. Consumers’ Long-Term Inflation Expectations Remain Elevated (FA-Mag)
Highlights, Lowlights and Insights from 1H 2022 (YCharts)
Only 35% of Americans seek financial adviser’s help (InvestmentNews)
Harness Volatility & Create Opportunity (YCharts)
Most Advisors Say Single-Stock ETFs Should Be ‘Avoided Like the Plague’ (WealthManagement.com)
Economic Update — Reviewing Q2 2022 (YCharts)
Fixed Income Performance
US Treasury Yield Curve
1 Month Treasury Rate: 2.22%
3 Month Treasury Rate: 2.41%
6 Month Treasury Rate: 2.91%
1 Year Treasury Rate: 2.98%
2 Year Treasury Rate: 2.89%
3 Year Treasury Rate: 2.83%
5 Year Treasury Rate: 2.70%
10 Year Treasury Rate: 2.67%
20 Year Treasury Rate: 3.20%
30 Year Treasury Rate: 3.00%
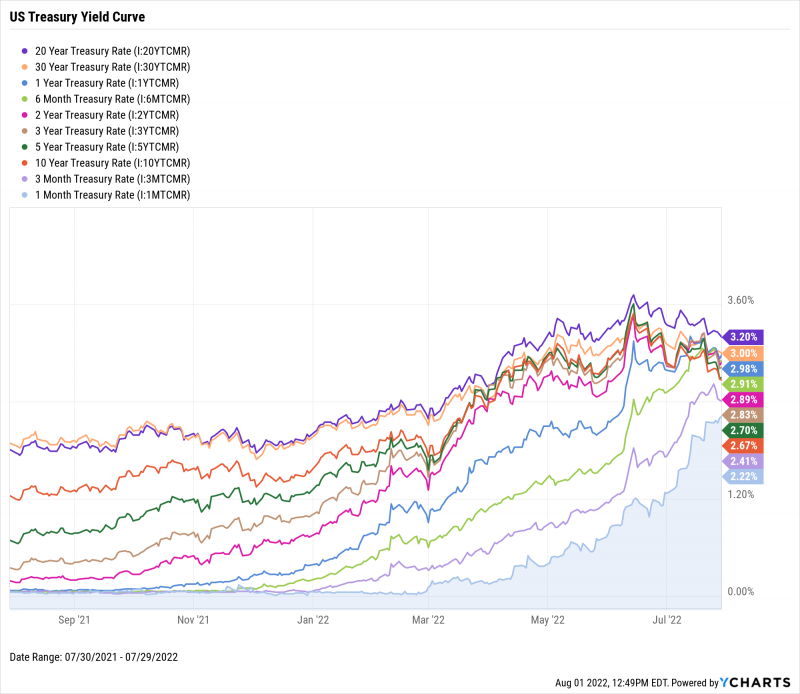
Download Visual | Modify in YCharts
Global Bonds
Italy Long Term Bond Interest Rate: 3.35%
Canada 10 Year Benchmark Bond Yield: 3.61%
10 Year Treasury Rate: 2.67%
United Kingdom Long Term Bond Interest Rate: 1.86%
Spain Long Term Bond Interest Rate: 2.07%
10-Year Eurozone Central Government Bond Par Yield: 1.67%
Germany Long Term Bond Interest Rate: 0.89%
Japan 10 Year Government Bond Interest Rate: 0.18%
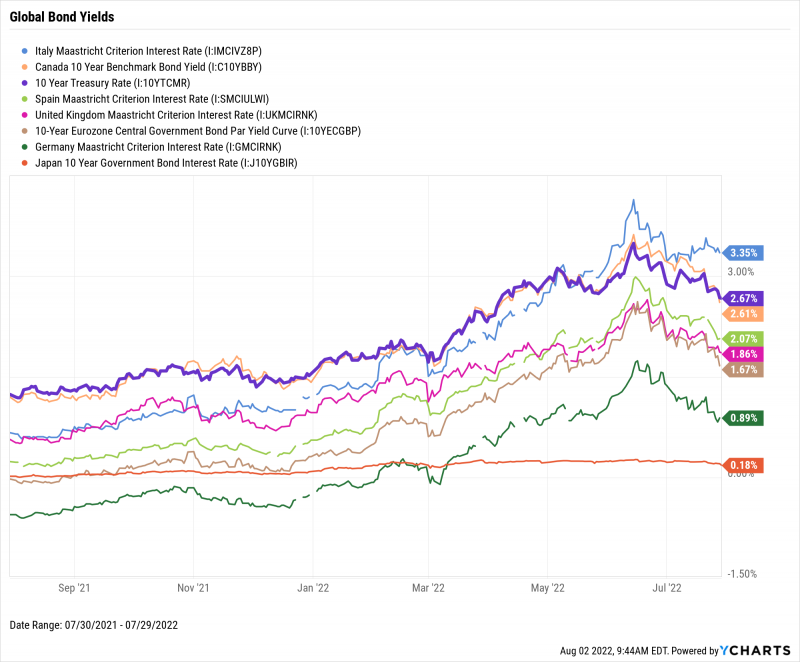
Download Visual | Modify in YCharts
Have a great August! 📈
If you haven’t yet, subscribe to the YCharts Monthly Market Wrap here: