Monthly Market Wrap: June 2022
Welcome back to the Monthly Market Wrap from YCharts, where we review and break down the most important market trends for advisors and their clients every month. As always, feel free to download and share any visuals with clients and colleagues, or on social media.
Want the Monthly Market Wrap sent straight to your inbox? Subscribe below:
Are you based in Canada or following Canadian markets? Check out and subscribe to the Monthly Canada Market Wrap from YCharts.
June 2022 Market Summary
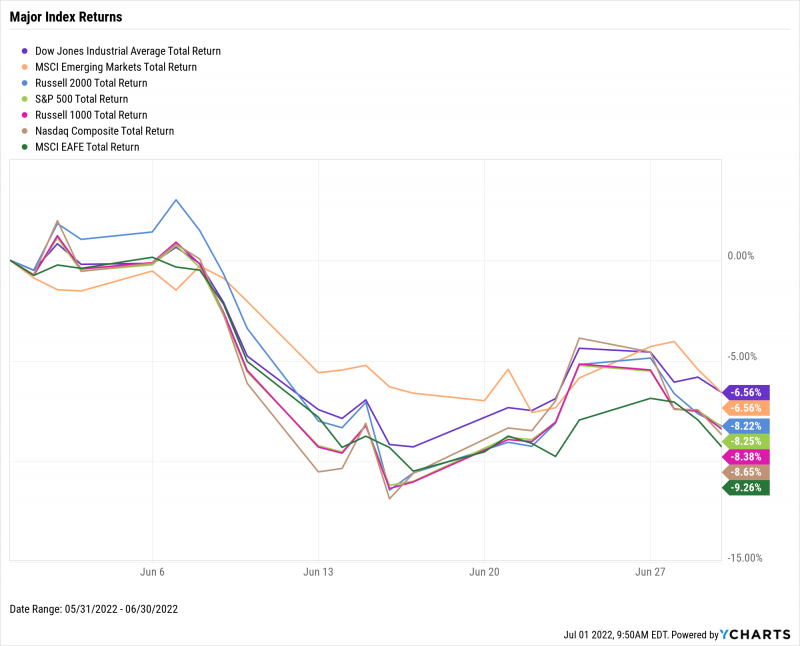
It was a rough month for equities in the US and around the world, with the S&P 500 tumbling 8.3% in June. The Dow Jones Industrial Average was off only 6.6%, matching the performance of the MSCI Emerging Markets index, and the NASDAQ fell 8.7% in June. The Russell 1000 and Russell 2000 posted similar drops of 8.4% and 8.2%, respectively. Red-hot inflation coupled with a global effort among central banks to tame price increases by rapidly hiking rates have been a few key drivers of 2022’s declines. For the first half of the year, the Dow is 14.4% lower, while the S&P 500 and NASDAQ are both in bear market territory, down 20% and 29.2% respectively.
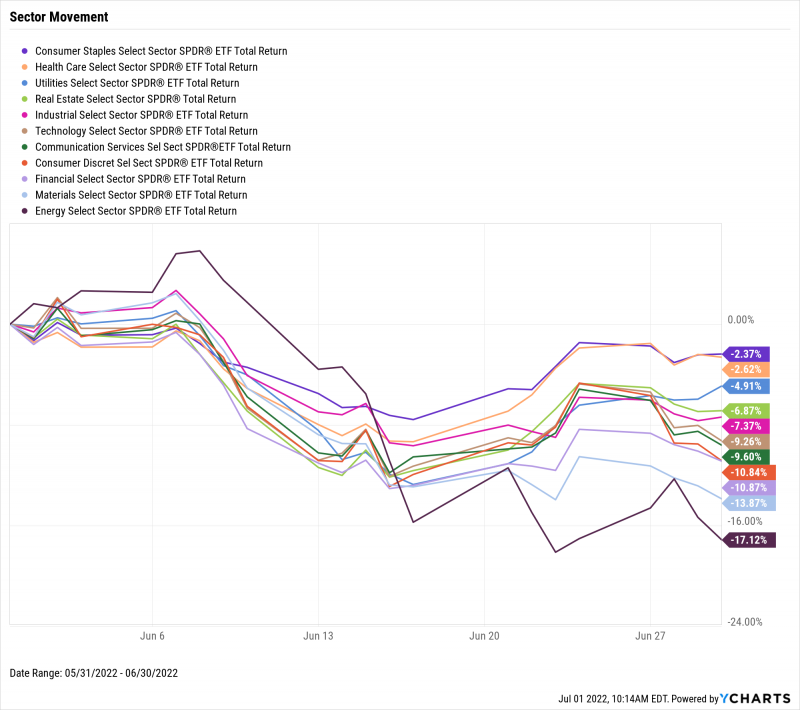
As a result, not a single sector ended June in the black. Energy took the largest hit, ending June 17.1% lower, and it was joined by Consumer Discretionary, Financials, and Materials, which all sank at least 10%. Consumer Staples and Health Care, sectors that are typically less sensitive to Fed rate hikes, were the only two trimmed by less than 3%.
Inflation data was mixed in June, as the US Inflation Rate rose back above the 8.5% level last seen in April, to 8.58%. US Core Inflation, on the other hand, saw a slight decline of 0.14 percentage points to 6.02%, which suggests food and energy were among the main culprits for rising prices. The employment situation was rather stable—May’s unemployment rate stayed at 3.6% for the third consecutive month, and initial jobless claims hovered around the 230K low mark for all of June. Finally, new single-family home sales surged 10.7%, bucking a four-month downtrend, but existing home sales fell for the fourth straight month.
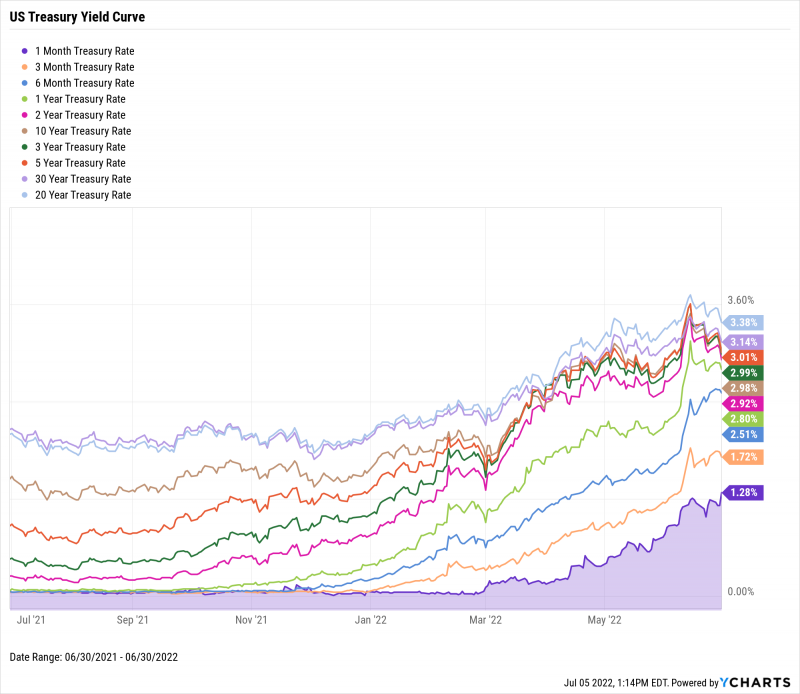
Short-term interest rates shot up in June following the Fed’s announcement of a 75 basis point rate increase, the largest since November 1994. The rate on 1-Month T-Bills was 1.28% as of the end of June, representing a monthly increase of 55 points. The 3-Month T-Bill stood at 1.72% while the 6-Month T-Bill surpassed 2.5% for the first time since March 2019, logging monthly increases of 56 and 87 points, respectively. Longer-term interest rates rose in June as well—the 5-Year Note along with 20-Year and 30-Year Bonds all ended June above 3%, but the 10-Year finished the month below the 5-Year and even the 3-Year, at 2.98%.
Jump to Fixed Income Performance
Off the YCharts! Plotting 2022’s Declines
Can you believe 2022 is already halfway over? (We sure can’t.)
Similarly, many are still in shock that the S&P 500 and NASDAQ ended the first half of 2022 in bear market territory, while the blue-chip Dow Jones Industrial Average is firmly in a correction.
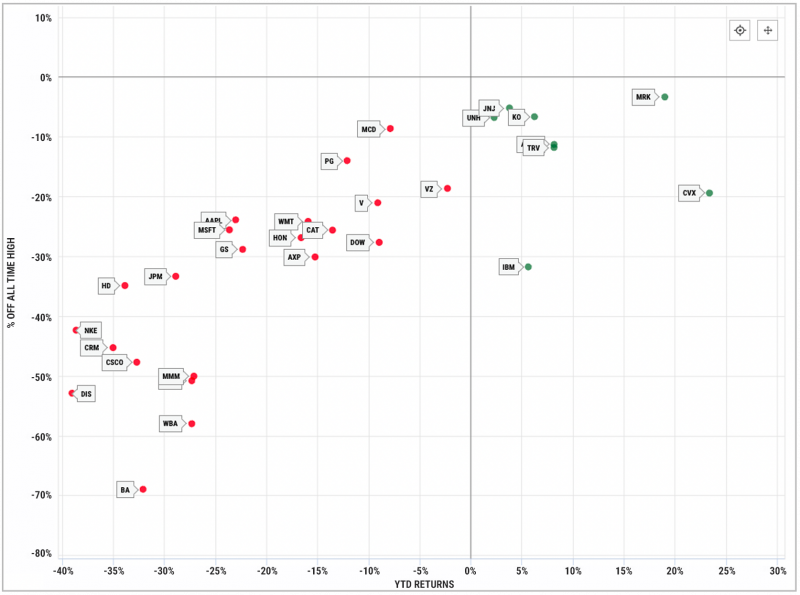
You might be wondering, who are the biggest culprits dragging these indexes lower?
YCharts Scatter Plot reveals the answer. For the Dow, 22 of its 30 components have posted negative returns year-to-date. The biggest laggards are Disney (DIS) and Boeing (BA), both down 30% YTD and 50% from their all-time highs:
Download Visual | Modify in YCharts
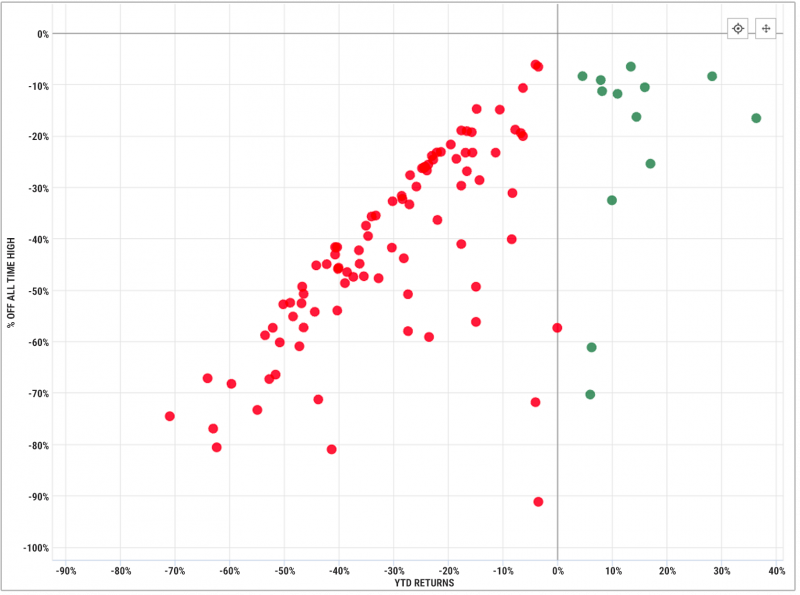
As for the NASDAQ-100, just 13 of its 102 constituents are green on the year, while 60% are in bear market territory in 2022 alone, down 20% or more:
Download Visual | Modify in YCharts
For a deeper dive into the 400 stocks in the S&P 500 that are negative in 1H 2022, see this S&P 500 Scatter Plot.
Equity Performance
Major US Indexes
Download Visual | Modify in YCharts
Value vs. Growth Performance, Trailing Twelve Months
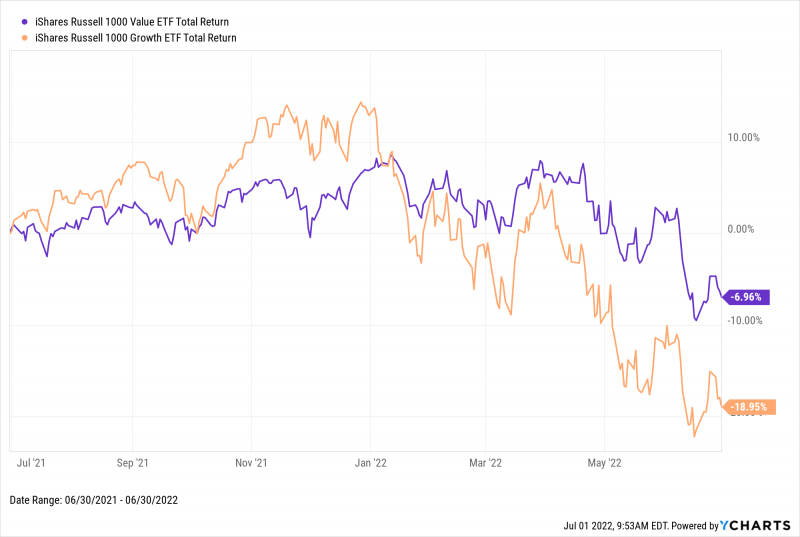
Both Value and Growth stocks are firmly in negative territory on a trailing twelve months (TTM) basis. The iShares Russell 1000 Value ETF (IWD) is down 7% over the last twelve months, while its more cyclically-sensitive Growth (IWF) counterpart settled 19% lower as of June 30th, 2022 after briefly entering bear market territory in June. Year-to-date, Value is down 13%, and Growth is 28.2% lower, driven largely by each style declining at least 8% in June.
Download Visual | Modify in YCharts
US Sector Movement
Download Visual | Modify in YCharts
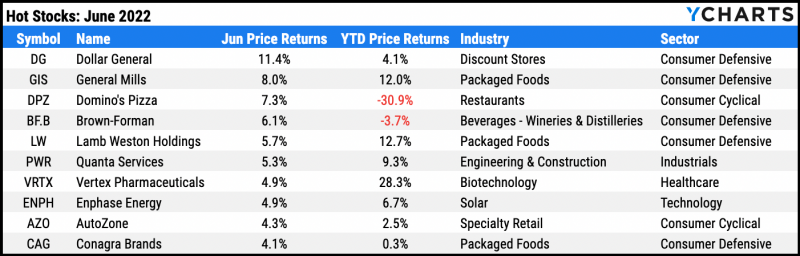
Hot Stocks: Top 10 S&P 500 Performers of June 2022
Dollar General (DG): 11.4% gain in June
General Mills (GIS): 8.0%
Domino’s Pizza (DPZ): 7.3%
Brown-Forman (BF.B): 6.1%
Lamb Weston Holdings (LW): 5.7%
Quanta Services (PWR): 5.3%
Vertex Pharmaceuticals (VRTX): 4.9%
Enphase Energy (ENPH): 4.9%
AutoZone (AZO): 4.3%
Conagra Brands (CAG): 4.1%
Download Visual | Modify in YCharts
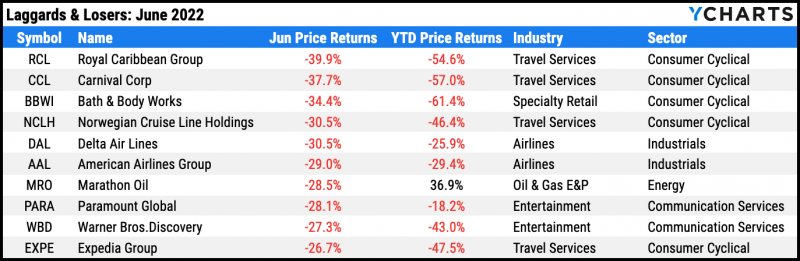
Laggards & Losers: 10 Worst S&P 500 Performers of June 2022
Royal Caribbean Group (RCL): -39.9% decline in June
Carnival Corp (CCL): -37.7%
Bath & Body Works (BBWI): -34.4%
Norwegian Cruise Line Holdings (NCLH): -30.5%
Delta Air Lines (DAL): -30.5%
American Airlines Group (AAL): -29.0%
Marathon Oil (MRO): -28.5%
Paramount Global (PARA): -28.1%
Warner Bros.Discovery (WBD): -27.3%
Expedia Group (EXPE): -26.7%
Download Visual | Modify in YCharts
Economic Data
Employment
The unemployment rate remained unchanged in May, at 3.6% for the third straight month, and the labor force participation rate inched up 0.1% to 62.3%. Despite US unemployment being back at pre-pandemic lows, labor force participation is 1.1 percentage points below its February 2020 level. On a more immediate employment front, 231,000 initial jobless claims were filed during the week of June 25th, up from the 53-year low of 166,000 from mid-March of this year but still 37% below its all-time average level.
Production and Sales
US Retail and Food Services Sales contracted for the first time in five months, falling 0.27% in May, largely as a result of increased cost pressures. June’s US ISM Manufacturing PMI reading sank 3.1 points MoM to 53, still in the “expansion” range of 50 or greater but steadily trending downward from its high of 64.1 set in March 2021.
Housing
Following two straight months of double-digit declines, New US Single-Family Houses Sold rebounded 10.7% in May, which broke a four-month negative streak in new home sales. However, Existing Home Sales slipped for the fourth straight month, down 3.4% in May. Existing Home Months’ Supply also rose by four-tenths to 2.6, now one full month of supply above its record low set in January 2022. Yet as of April, the US Existing Home Average Sales Price was at an all-time high of $397,600.
Consumers and Inflation
Last month we surprised you with the fact that inflation declined for the first time in seven months. This month, we must unfortunately take that back, as the US Inflation Rate rose to 8.58%, an increase of 0.32 percentage points. However, US Core Inflation, which excludes the food and energy sectors, declined by a slight 0.14 percentage points to 6.02%. Overall, prices increased in May, marked by the US Consumer Price Index rising nearly 1%, but Consumer spending (PCE) was also up 0.6% in May.
Gold
The price of Gold in USD fell for the third straight month, down to $1,825.50 per ounce, as of June 24th. However, gold is up 1.1% in the first half of 2022. As a result, the SPDR Gold Shares ETF (GLD) fell 1.6% in June, but gold miners fared much worse, with the VanEck Gold Miners ETF (GDX) tumbling 13.7%. The outflows from gold and gold miners came as the US Dollar strengthened against major currencies, despite persistent inflation continuing to weaken the USD’s purchasing power.
Oil
Per-barrel oil prices rebounded in the last week of June to $111.44 for WTI and $119.69 for Brent, continuing a rise that has pushed prices up 48% and 55% year-to-date, respectively. Rising oil costs also contributed to all-time levels of pain felt at the pump. The average price of regular gas exceeded $5 per gallon for the first time ever in June, while premium gas stood at $5.76 per gallon as of mid-June.
Cryptocurrencies
June encapsulated another harsh selloff in major cryptocurrencies. The price of Bitcoin fell below $20,000 intramonth, settling at $20,108 at the end of June, which represents a monthly decline of 38.2%. Ethereum plunged 47% in June and also dipped below $1,000 for the first time since the start of 2021, finishing the month at $1,099. Binance Coin ended June at $219.37, with its monthly decline of 31.9% being the least voluminous of these three major cryptocurrencies. Year to date, Bitcoin is down 57.4%, Binance Coin is 57.7% lower, and Ethereum is 70.4% in the red.
Featured Market & Advisor News
Existential Crisis In Bonds Fuels Wall Street’s Income ETF Boom (FA-Mag)
New on YCharts: ESG Data for Stocks, ETFs & Mutual Funds (YCharts)
Inflation rising but 401(k) mutual fund fees falling, says ICI report (InvestmentNews)
Schwab Integration, Others Streamline Portfolio Workflows (YCharts)
Wall Street’s Classic Strategy Set for Worse Quarter Than 2008 (WealthManagement.com)
What Happens After A Fed Rate Hike? (YCharts)
Fixed Income Performance
US Treasury Yield Curve
1 Month Treasury Rate: 1.28%
3 Month Treasury Rate: 1.72%
6 Month Treasury Rate: 2.51%
1 Year Treasury Rate: 2.80%
2 Year Treasury Rate: 2.92%
3 Year Treasury Rate: 2.99%
5 Year Treasury Rate: 3.01%
10 Year Treasury Rate: 2.98%
20 Year Treasury Rate: 3.38%
30 Year Treasury Rate: 3.14%
Download Visual | Modify in YCharts
Global Bonds
Italy Long Term Bond Interest Rate: 3.45%
Canada 10 Year Benchmark Bond Yield: 3.23%
10 Year Treasury Rate: 2.98%
United Kingdom Long Term Bond Interest Rate: 2.68%
Spain Long Term Bond Interest Rate: 2.23%
10-Year Eurozone Central Government Bond Par Yield: 2.16%
Germany Long Term Bond Interest Rate: 1.40%
Japan 10 Year Government Bond Interest Rate: 0.24%

Download Visual | Modify in YCharts
Have a great July! 📈
If you haven’t yet, subscribe to the YCharts Monthly Market Wrap here: