PayPal’s PE, Gas Prices, the Ruble’s Crash – What’s Trending on YCharts?
Our What’s Trending on YCharts? series uses data to identify the stocks, funds, and economic indicator pages on YCharts that are getting the most traffic (from YCharts users and Google searchers alike).
In February 2022, YCharts pageview data revealed the names and trending topics that are catching investors’ attention. Currently trending on YCharts are PayPal (PYPL) and its falling P/E Ratio, natural gas prices in the European Union, and a wild swing in the US Dollar to Russian Ruble exchange rate that has made the latter nearly worthless, in Dollar terms.
To get the full scoop on everything trending, watch the latest episode here:
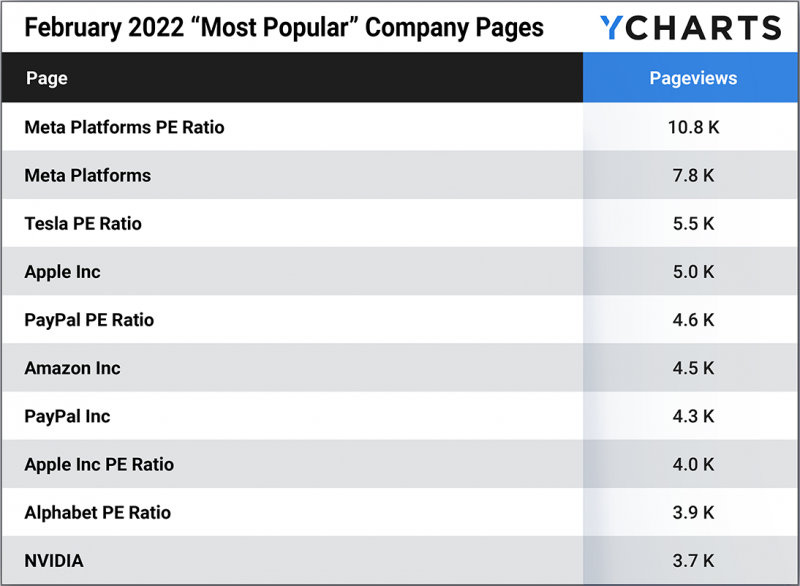
Most Popular Company Pages
These stock data pages had the most unique pageviews in February 2022.
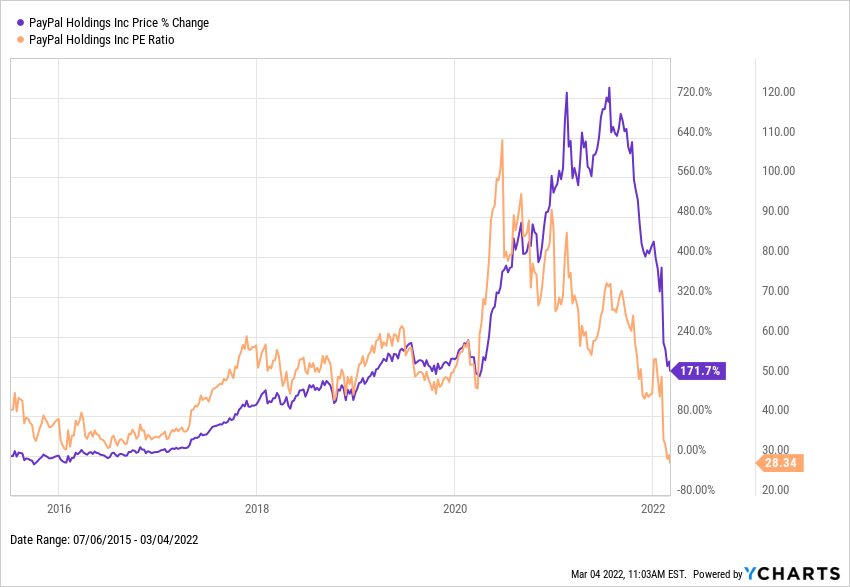
While PayPal rallied in the summer after the virus crash, its P/E Ratio was also spiking to an all-time high in mid-2020. Once earnings caught some momentum in 2021, PayPal’s price-to-earnings fell back in line with pre-pandemic levels as its price surged. But now in 2022, PayPal’s P/E ratio has fallen to an all-time-low, driven largely by a sell off, and is even lower than when PayPal debuted on public markets in 2015.
Download Visual | Modify in YCharts
Meta Platforms (META) P/E Ratio
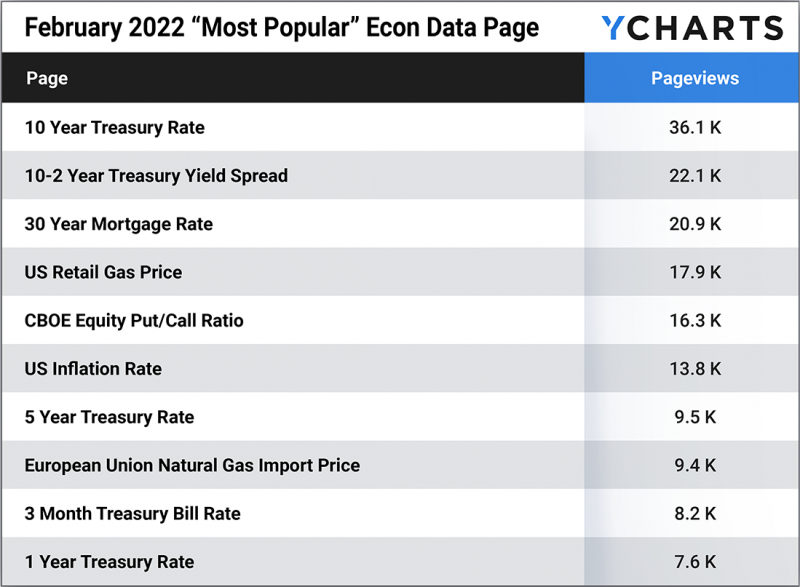
Most Popular Econ Pages
These economic data pages had the most unique pageviews in February 2022.
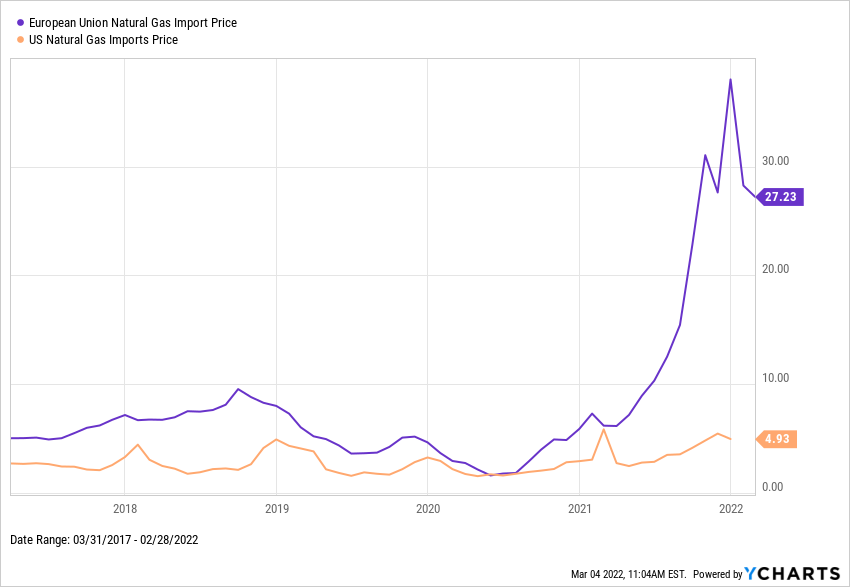
While the United States produces roughly 98% of its natural gas needs domestically, countries in the European Union are significantly more reliant on imports. With Russia’s invasion of Ukraine potentially eliminating a large amount of supply from the global equation, Europeans are paying never-before-seen prices for residential and commercial gas needs.
Download Visual | Modify in YCharts
10-2 Year Treasury Yield Spread
European Union Natural Gas Import Price
Hottest Econ Data Pages
These econ data pages had the largest month-over-month unique pageview growth in February 2022, as compared to January 2021.
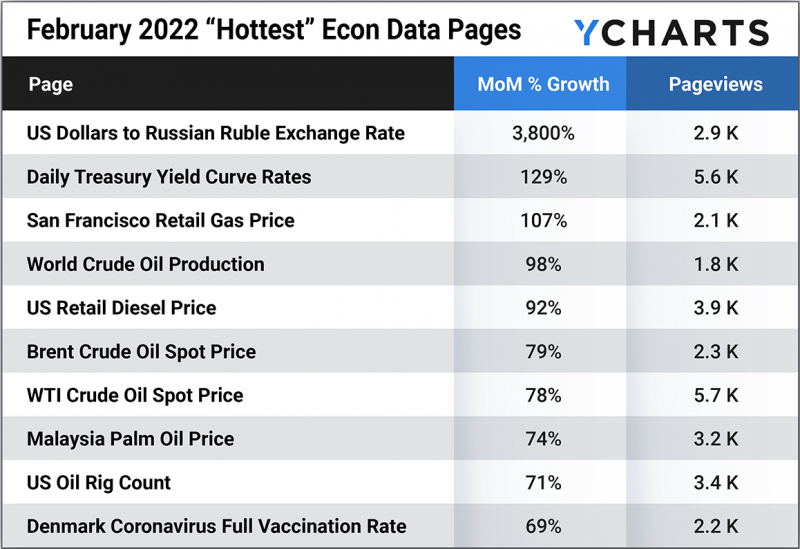
The US Dollar to Russian Ruble Exchange Rate already moved against Russia’s favor during the onset of the COVID-19 pandemic, but the Ruble’s further depreciation in March 2022 is of a whole other sort. At one point, one ruble was worth just nine-tenths of a US cent; put differently, you’d need 105 rubles on hand to purchase a single US dollar. This move comes in the wake of Russia’s invasion of Ukraine and the sanctions that global governments placed on Russia and its currency in response.
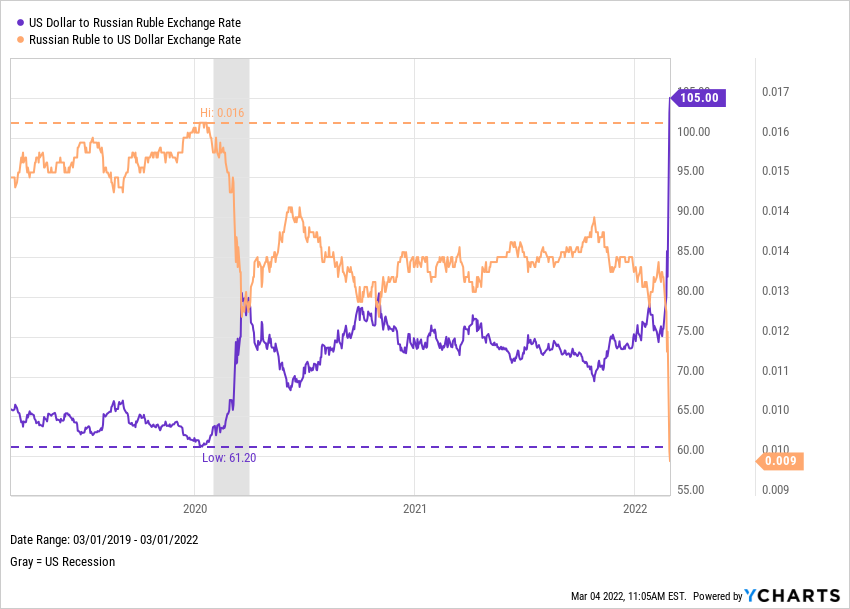
Download Visual | Modify in YCharts
US Dollar to Russian Ruble Exchange Rate
Daily Treasury Yield Curve Rates
San Francisco Retail Gas Price
Denmark Coronavirus Full Vaccination Rate
Connect with YCharts
To learn more, call us at (773) 231-5986, or email hello@ycharts.com.
Want to add YCharts to your technology stack? Sign up for a 7-Day Free Trial to see YCharts for yourself.
Disclaimer
©2022 YCharts, Inc. All Rights Reserved. YCharts, Inc. (“YCharts”) is not registered with the U.S. Securities and Exchange Commission (or with the securities regulatory authority or body of any state or any other jurisdiction) as an investment adviser, broker-dealer or in any other capacity, and does not purport to provide investment advice or make investment recommendations. This report has been generated through application of the analytical tools and data provided through ycharts.com and is intended solely to assist you or your investment or other adviser(s) in conducting investment research. You should not construe this report as an offer to buy or sell, as a solicitation of an offer to buy or sell, or as a recommendation to buy, sell, hold or trade, any security or other financial instrument. For further information regarding your use of this report, please go to: ycharts.com/about/disclosure.
Next Article
Russia vs. Ukraine: An Economic ComparisonRead More →