
How Does Portfolio Drift Erode Client Trust?

Interested in testing out YCharts for free?
Start 7-Day Free TrialRisk sits at the center of every advisor-client relationship. How comfortable a client is with risk shapes investment decisions, the direction of every conversation, and the steps needed to reach their goals.
Getting there requires an advisor to have a clear picture of a client’s time horizon, fears, major life events, and the psychology behind how they actually feel about risk. That picture gets captured through a risk tolerance questionnaire and translated into a risk profile that defines how their portfolio should be built and managed.
But risk tolerance isn’t a one-time conversation. Markets are constantly moving, and goals shift, but it doesn’t take a change in risk comfort for a client’s portfolio to quietly drift away from the financial roadmap they signed up for.
Table of Contents
How Portfolio Drift Actually Happens
Portfolio drift isn’t the result of a bad investment decision; it’s the byproduct of asset classes and holdings moving at different rates over time, and this only compounds if left unchecked.
Equities and bonds, the common pillars of many portfolios, are a perfect example of this. They each serve their purpose in a well-balanced portfolio to generate growth and mitigate risk, and over time, it makes sense for their performance levels to diverge.
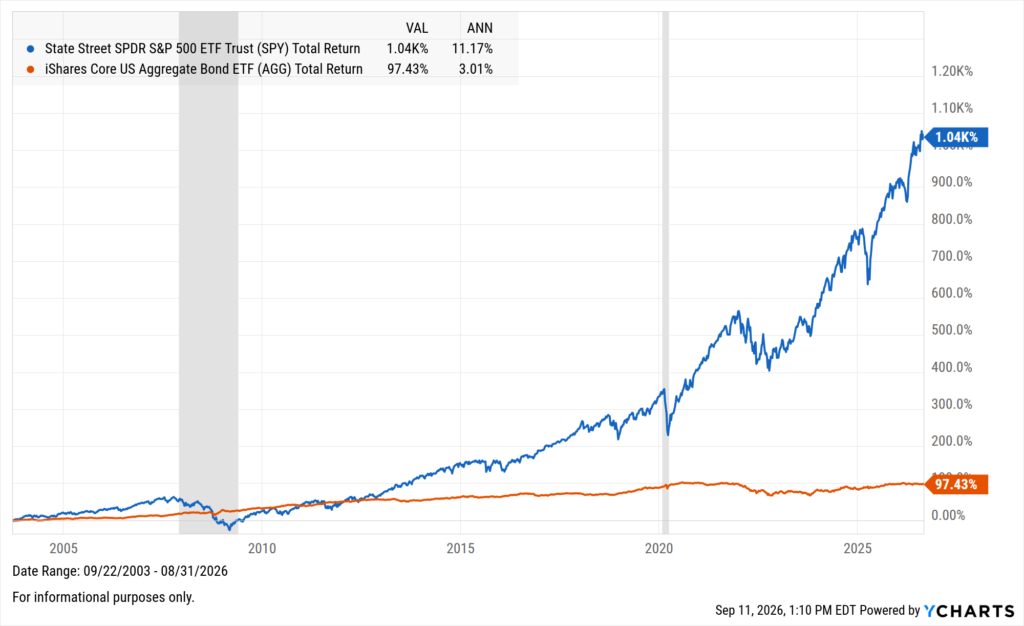
The problem is that this divergence can subtly lead to portfolio drift, even over short timeframes, and is often hard for advisors to track across an entire book of clients with varying circumstances.
To showcase this drift in action, we built a 60/40 portfolio of the following holdings and tracked how its underlying assets responded across various circumstances:
- 35% Vanguard Total Stock Market Index (VTSMX)
- 30% Vanguard Total Bond Market Index (VBMFX)
- 20% Vanguard Total International Stock Index (VGTSX)
- 10% Vanguard Short-Term Bond Index (VBISX)
- 5% Vanguard Emerging Markets Stock Index (VEIEX)
Over thirty years, the portfolio was rebalanced quarterly, annually, and never at all. The gap between those that were rebalanced and the portfolio left unattended showcases on an extreme scale how asset performance can skew holdings.
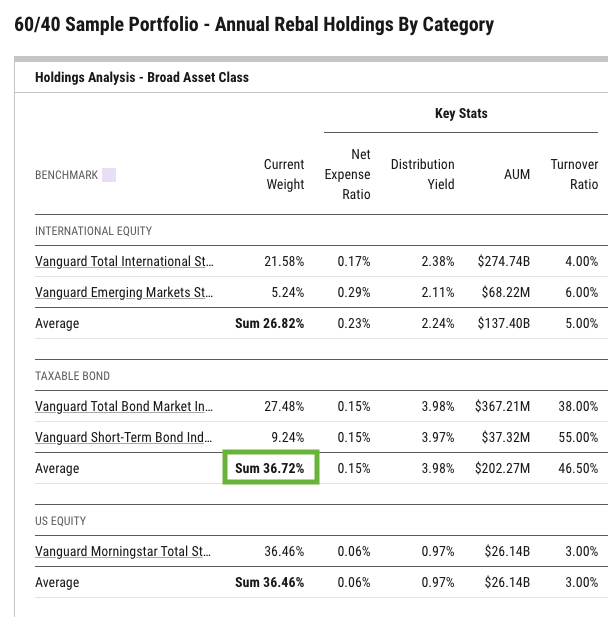
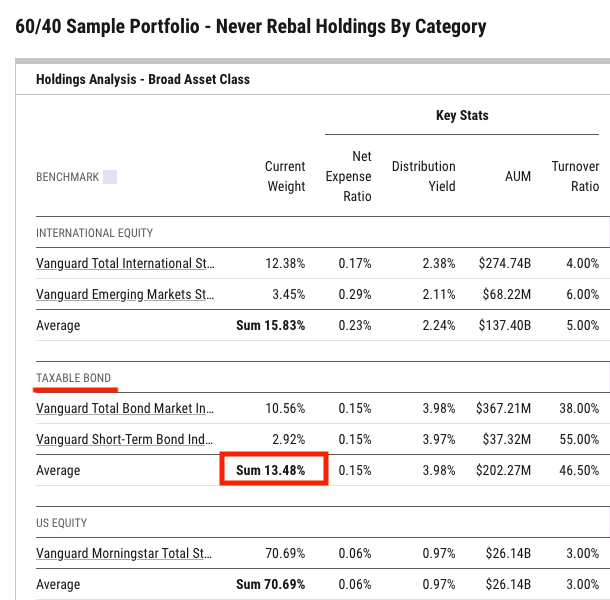
Click Images to Enlarge!
In all of these cases, the bond sleeve began at 40%, but when left untouched, it fell to just 13.48% over the same period that the broad market advanced by over 1,000%, or an annualized 11.17%.
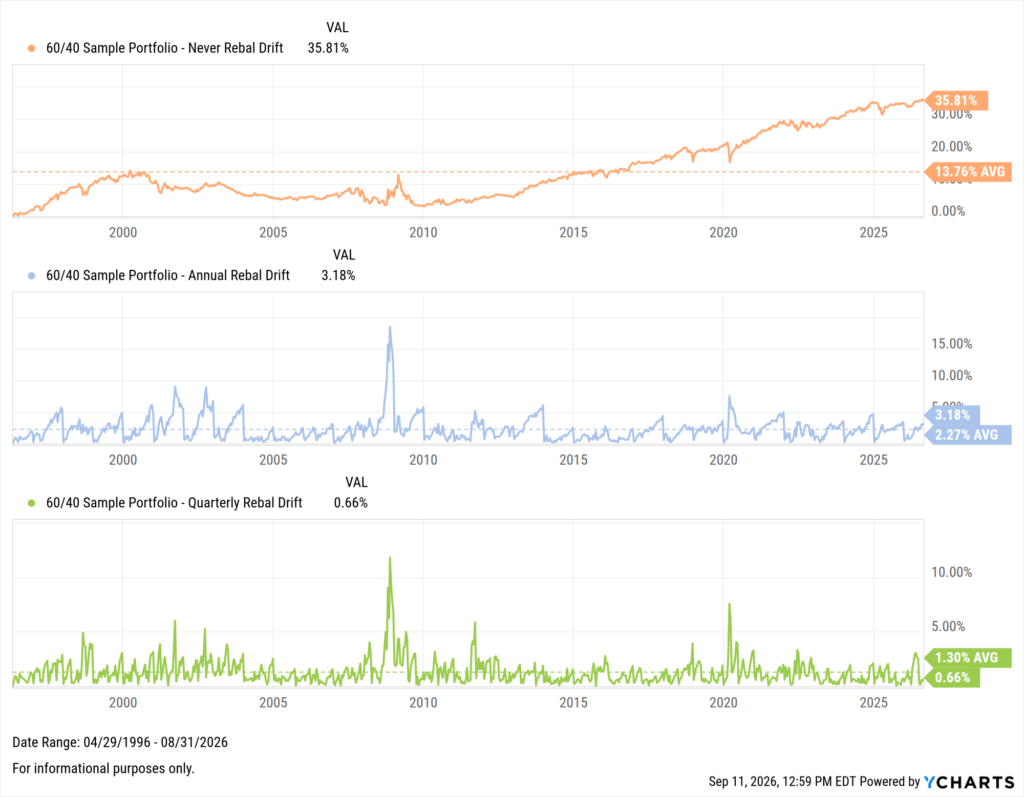
Drift Doesn’t Need Decades to Show Up
Realistically, most advisors would never go without rebalancing a portfolio, but this exercise showcases the mechanics of drift. What can still happen, though, in short timeframes and the right market environment, is drift that comes on fast and unnoticed.
Using the same scenario as earlier, with freshly balanced holdings at the beginning of 2025, the impacts would already be creeping into the unchecked portfolio in just 20 months.
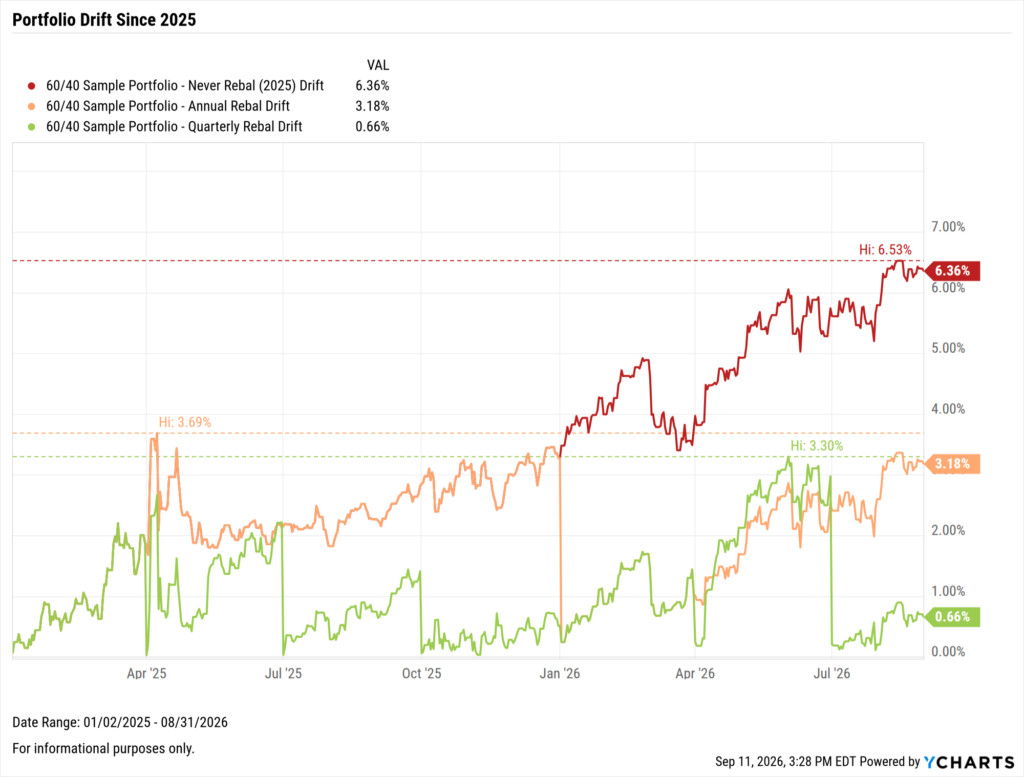
The amount of drift is not what clients care about, though. What matters more to them is how this is reflected in their portfolio’s performance, especially during rough periods when clients pay closer attention.
During the 2020 pandemic recession, at its worst point, the annually rebalanced portfolio would have been better protected by more than 5% due to a bond allocation more closely aligned with the portfolio’s initial strategy.
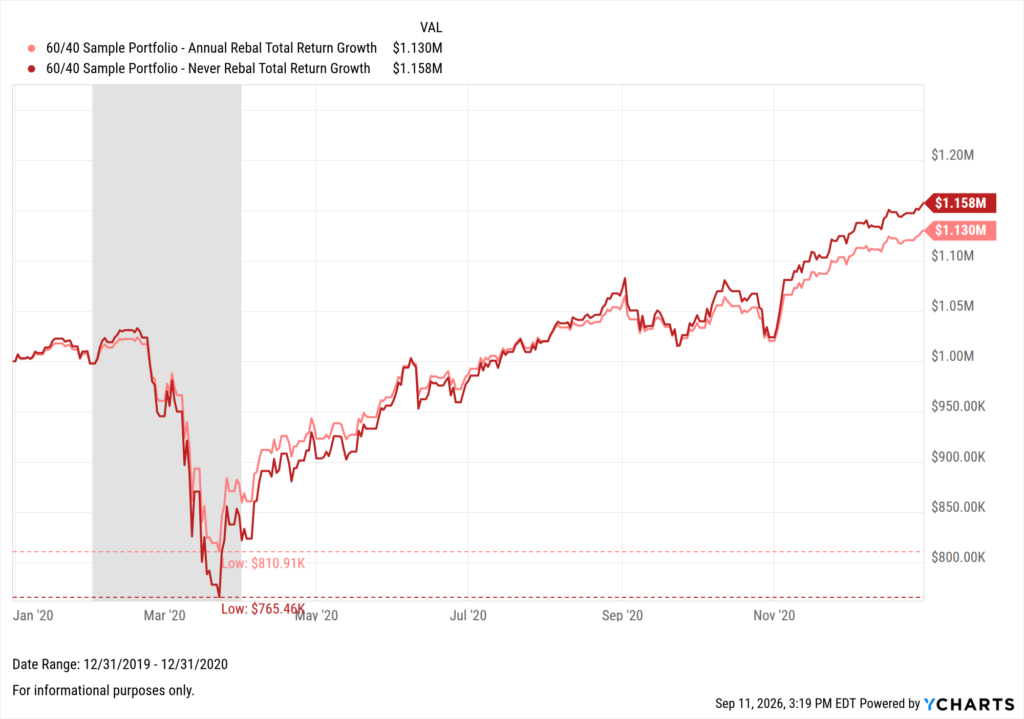
While 5% may not seem extreme, to the client, it is roughly the difference between a fifth of their investment value and a fourth. When scaled up to a $1,000,000 portfolio, that difference is $50,000 less that the client is worried about having “lost” in the moment.
Risk & Proposal Manager Distinguishes Misalignments
YCharts’ Risk & Proposal Manager (RPM) is built to catch gaps like that $50,000 swing before they show up in a drawdown, keeping a client’s risk profile and their actual portfolio in the same place that an advisor already manages research, reporting, and client relationships.

Rather than treating risk tolerance as a one-time capture, YCharts makes it the reference point, automatically flagging when a portfolio drifts out of alignment with the profile it’s meant to match.
- Unintended Risk Exposure. A conservative portfolio that drifts into a growth-heavy allocation exposes a client to losses they never agreed to take on. Risk & Proposal Manager flags that misalignment directly, notifying advisors when a portfolio moves out of step with its assigned risk profile, rather than leaving that discovery to a client statement or a bad quarter.
- Perceived Neglect. An improperly managed client portfolio can appear negligent and call the advisor’s trustworthiness into question. Every risk tolerance questionnaire and risk profile an advisor has ever run stays on file, always available for reference and return. Across a full book of clients, there’s no excuse to be caught without the full picture, and no need to check every account by hand when misalignment is surfaced automatically.
- Loss of Strategic Alignment. A portfolio that fails to reflect a client’s goals, time horizon, or risk tolerance undermines the plan they signed up for, even when their actual circumstances haven’t changed. With YCharts, risk history records when and why a profile has changed, so an advisor or a client asking questions can see the difference between an intentional adjustment and a portfolio that actually drifted from its target.
Stay Ahead of the Conversation
A client doesn’t need to understand asset allocation to notice when something is off. They notice a portfolio that no longer matches the conversation they had at the start, or an advisor who seems to be uncovering problems at the same time as them.
Risk & Proposal Manager helps advisors get ahead of these conversations by tracking portfolio alignment across an entire book. When drift creeps in, the advisor is made aware and can address the situation before it ever reaches the client and damages the relationship’s trust.
Risk & Proposal Manager can be added to any YCharts subscription. Win new business, keep every portfolio aligned, and manage the whole relationship from one place. Explore Risk & Proposal Manager.
Frequently Asked Questions (FAQ):
Is Risk & Proposal Manager included in my plan?
Risk & Proposal Manager is a paid add-on to a YCharts subscription. To explore how YCharts fits your workflow, or add Risk & Proposal Manager to an existing account, connect with us here to learn more.
What is included in the Risk & Proposal Manager package?
RPM includes three components that together form a complete risk and client management workflow.
- Risk Tolerance Questionnaire (RTQ): Captures each client’s risk tolerance through a structured, academically grounded assessment sent directly to the client.
- Risk Profiles: Translates that risk tolerance into an advisor-defined investment framework, including asset allocation targets and model portfolio assignments.
- Client Management: The ongoing client management layer, covering household and account structure, the unified client workspace, book-of-business dashboards, risk alignment monitoring, activity tracking, integration-based book import, AI-powered client insights, and firm-level oversight.
What does Risk & Proposal Manager add to Risk Profiles?
Risk Profiles is one capability within Risk & Proposal Manager. The add-on also includes a risk tolerance questionnaire to capture client risk up front and a client management workspace to review alignment over time, so risk becomes part of your ongoing workflow rather than a one-time input.
Does it work with the tools I already use?
Yes. Risk & Proposal Manager connects with the platforms you already rely on, starting with Black Diamond, Orion, and Redtail, with more integrations rolling out.
Ready to Move On From Your Investment Research and Analytics Platform?
Follow YCharts Social Media to Unlock More Content!
Next Article
UCITS in YCharts: Research, Compare & Win AllocationsRead More →