
UCITS in YCharts: Research, Compare & Win Allocations
For asset managers with international reach, UCITS funds are a cornerstone of global distribution. Yet many sales teams still rely on fragmented tools to analyze and present these strategies. YCharts changes that by bringing UCITS data, analytics, and AI-powered insights into the same platform distribution teams already use every day.
9/10 wholesalers report that YCharts has helped, or is expected to help, win or expand model allocations.
Start 7-Day Free TrialTable of Contents
What Is a UCITS Fund?
Undertakings for Collective Investment in Transferable Securities (UCITS) is a regulatory framework established by the European Union to harmonize the creation, management, and marketing of investment funds across EU member states. Originally adopted in 1985 and updated multiple times since, the framework allows a fund registered in one EU country to be freely sold across all member states under a single set of rules.
What makes UCITS notable isn’t just its European scope. It’s the global credibility that comes with it. Because UCITS funds are subject to strict requirements around liquidity, diversification, and asset custody, they’ve become a recognized standard for retail-distributable funds worldwide. UCITS are now sold in more than 50 countries outside the EU, with particular traction in Asia, South America, and the Middle East, according to the Fact Book 2026 from the European Fund and Asset Management Association (EFAMA).
The market reflects that appeal. UCITS net assets reached €16.7 trillion at the end of 2025, roughly two-thirds of all European investment fund assets, and 2025 UCITS net sales hit a record €814 billion. The share of cross-border EU-domiciled funds has climbed from about 49% to 55% over the past decade, which is the structural trend behind every conversation about distributing a single strategy across multiple markets.
Who Needs UCITS, and Why Do They Matter?
UCITS matter to a wide range of market participants:
- Asset managers launching or distributing cross-border strategies need UCITS structures to legally market funds across Europe and into markets that recognize the framework, including parts of Asia and Latin America.
- Distribution teams need to be able to credibly discuss UCITS fund performance, risk characteristics, and competitive positioning, just as they do for domestic mutual funds or ETFs.
- Advisors and allocators evaluating international options want apples-to-apples comparisons across strategies, including those domiciled outside the US.
For distribution teams in particular, the challenge hasn’t been access to UCITS products but access to reliable, consistent data that enables meaningful analysis and compelling allocator conversations, specifically during and after meetings.
How UCITS Appear in YCharts
YCharts supports UCITS funds through a data partnership with LSEG Lipper, a global fund data provider covering Accumulating (Acc) and Distributing (Dist) share classes across every major domicile. UCITS appear, can be searched, and can be screened in YCharts like any other security or custom asset in the platform.
The UCITS data available in YCharts spans the full range of fund analytics teams need, including:
- Performance: Total Return, annualized returns across trailing periods, and drawdown analysis
- Risk Metrics: Standard Deviation, Sharpe Ratio, Sortino Ratio, Beta, Value at Risk, and more
- Net Assets & Flows: Assets Under Management (AUM) trends to gauge investor sentiment
- Holdings & Allocations: Underlying security-level holdings and asset class breakdowns
- Equity & Fixed Income Fundamentals: P/E, Yield, Duration, and other underlying metrics
- Info Metrics: Expense Ratio, Category, peer group classification, and other descriptive data
How Distribution Teams Use UCITS in YCharts
Turning UCITS data into allocator-facing insights is where YCharts gives distribution teams a real edge. Teams can use YCharts to build analysis, respond to competitor questions, and frame portfolio construction conversations, all using live UCITS data.
The table below screens the largest global UCITS funds by AUM, comparing trailing returns, Sharpe Ratio, and Standard Deviation. iShares Core MSCI World UCITS ETF USD dominates on scale at $148.9 billion, more than twice the next-largest fund in the group. But scale and efficiency are separate questions: Vanguard FTSE All-World UCITS ETF USD posts the highest Sharpe Ratio in the group at 0.66 alongside the lowest Standard Deviation at 11.7%.
Amundi Core S&P 500 UCITS ETF is the one US-only exposure on the screen. It leads on five-year return at 12.95% while running the highest Standard Deviation at 15.3%. Screens like this, and any other MPT analysis, can take a conversation beyond performance and use risk metrics to justify an allocation.
Let AI Do the Heavy Lifting
Y, the AI agent in YCharts, allows teams to build charts, comparisons, and allocator-facing outputs using natural language. Rather than manually configuring screens or building charts from scratch, a sales director can prompt Y to generate competitive analysis or build a performance chart against a macro backdrop, then use those outputs directly in meetings or reports.
Quick Extract, another AI-powered feature, lets teams upload advisor statements or PDFs to identify portfolio gaps and opportunities where a UCITS strategy could add value.
Chart Performance and Risk in Context
Distribution teams use Fundamental Charts and Scatter Plots in YCharts to visualize how a UCITS strategy performs relative to peers or benchmarks, and overlay that analysis with macro variables such as interest rates, volatility, or other economic indicators.
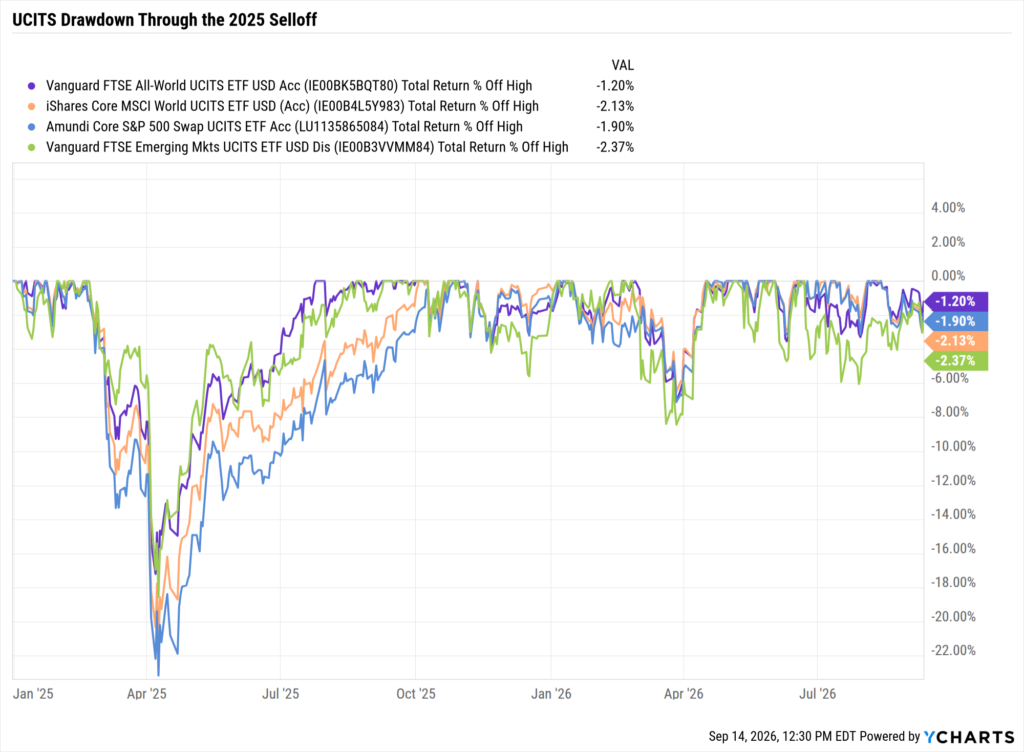
Showing how a strategy held up during a specific drawdown period, or how its risk-adjusted returns compare against a competitor, becomes a minutes-long task rather than an afternoon project.
But drawdown tells only half the story. Follow-up questions from allocators might center around whether risk-adjusted quality has been consistent over a full market cycle.
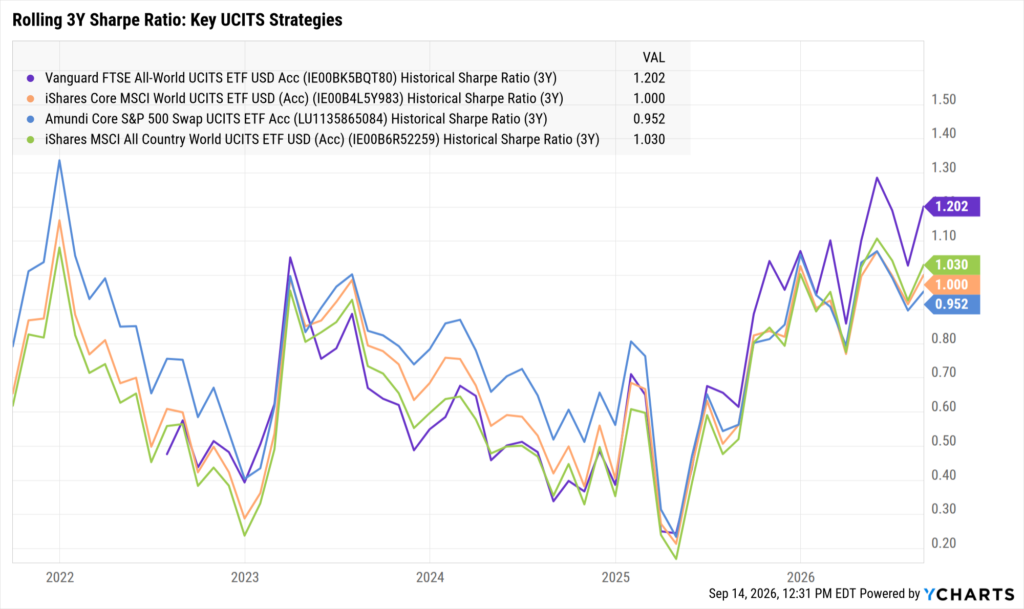
The chart above plots the rolling three-year Sharpe Ratio for four major UCITS strategies since 2022. But it can be customized to include metrics like Alpha, Sortino, or other MPT stats across different time periods, so you can steer the conversation in whatever direction needed to reinforce your value as a true partner and swiftly overcome objections when they arise.
Competitive Screening and Positioning
The Fund Screener and Comp Tables allow teams to search across the UCITS universe with specific filters, including Expense Ratio, Category, and AUM range, and generate side-by-side comparisons. Once you’re satisfied with the competitive universe you’ve created, you can begin creating compelling visuals to win allocations.
So whether preparing for a meeting or responding in real time to a competitor’s mention, teams can quickly surface the data points that matter most.
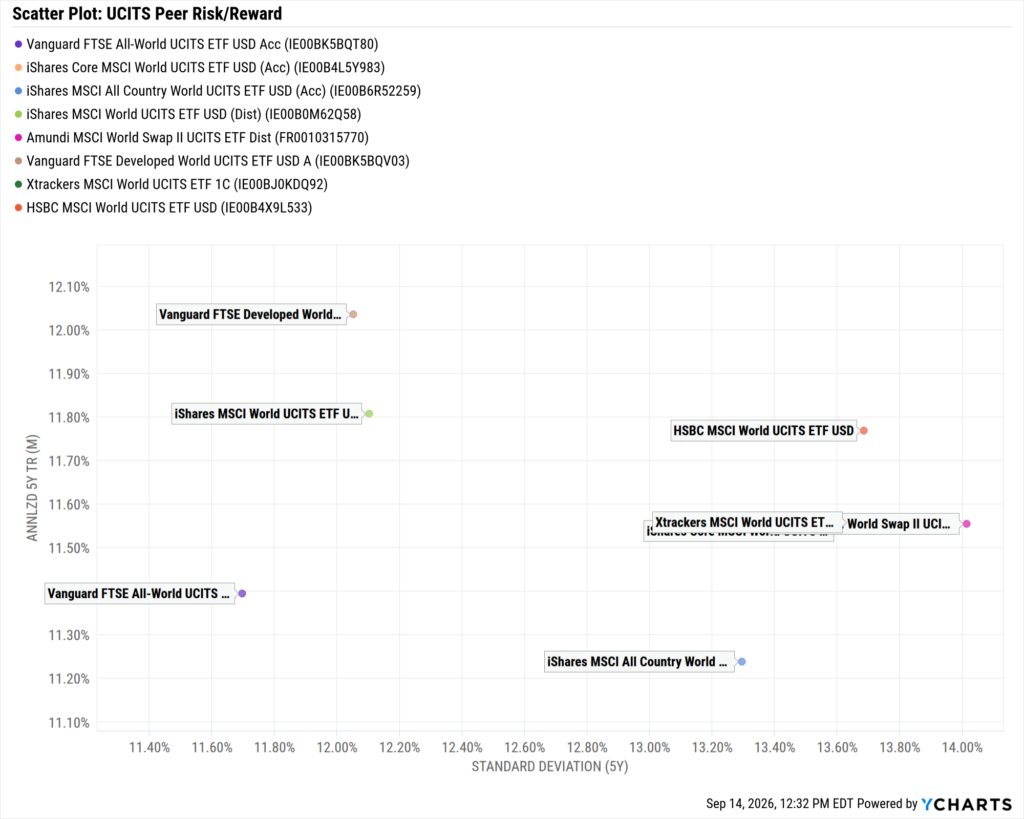
The scatter plot above maps eight major UCITS funds on a five-year risk/reward basis. The entire group spans less than one percentage point of annualized return and about 2.6 percentage points of volatility. These are close substitutes on return, and they differentiate almost entirely on how much volatility they took to get there.
When return dispersion is this tight, the argument for a strategy may rest on volatility, but if the conversation shifts to fundamentals, yield, valuations, or any other risk-related topic, the axes can be customized to visualize your point. Factor and Attribution analyses are also available to examine the underlying forces behind those returns.
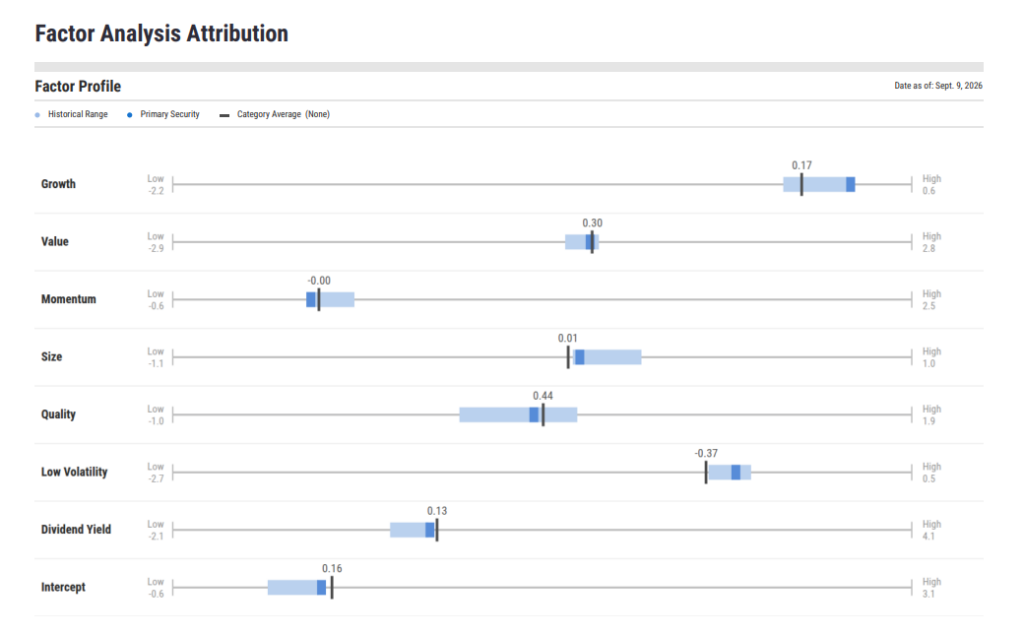
For a team walking into a meeting with a factor-aware allocator, visuals like this move the conversation from performance to process.
Build Model Portfolios Around UCITS
With Model Portfolios and Portfolio Optimizer in YCharts, teams can incorporate UCITS funds into hypothetical model portfolios alongside other strategies.
Want to show how adding your international equity strategy at a 10% allocation shifts a model’s risk profile or its Sharpe Ratio? Build it, run it, and present it.
Unify Your Global Sales Force with YCharts
For asset managers running UCITS funds alongside US-domiciled strategies, the biggest operational challenge is often consistency: how do you ensure a North American sales team and European distribution team tell a coherent story?
YCharts is already widely used across North American distribution teams, where 9 in 10 wholesalers report that the platform has helped, or is expected to help, win or expand model allocations.
Now a firm can onboard its international distribution team onto a platform the home office already trusts, build shared dashboards and competitor comparisons, and maintain consistent messaging across continents.
For a global distribution team, that kind of alignment is a competitive advantage.
The Bottom Line
UCITS funds represent a significant and growing share of the global investment landscape, and the teams that distribute them deserve the same quality of analytics and presentation tools that US fund sales teams rely on.
With UCITS data in YCharts, from screening and charting to portfolio modeling and AI-powered insights, distribution teams have everything they need to research smarter, present more compellingly, and win more allocations.
Whenever You’re Ready, There Are 3 Ways YCharts Can Help You
1. Looking for a best-in-class data & visualization tool?
Send us an email at hello@ycharts.com or call (866) 965-7552. You’ll be directly in touch with one of our Chicago-based team members.
2. Want to test out YCharts for free?
Start a no-risk 7-Day Free Trial.
3. Download a copy of The Top 10 Visuals for Client and Prospect Meetings slide deck:
Disclaimer
©2026 YCharts, Inc. All Rights Reserved. YCharts, Inc. (“YCharts”) is not registered with the U.S. Securities and Exchange Commission (or with the securities regulatory authority or body of any state or any other jurisdiction) as an investment adviser, broker-dealer or in any other capacity, and does not purport to provide investment advice or make investment recommendations. This report has been generated through application of the analytical tools and data provided through ycharts.com and is intended solely to assist you or your investment or other adviser(s) in conducting investment research. You should not construe this report as an offer to buy or sell, as a solicitation of an offer to buy or sell, or as a recommendation to buy, sell, hold or trade, any security or other financial instrument. For further information regarding your use of this report, please go to: ycharts.com/about/disclosure.
Next Article
7 Charts Framing the Market Ahead of the September FOMC MeetingRead More →