Q1 2025 Earnings Season: A High-Stakes Test for Tariff-Era Market Sentiment
Introduction: A Pivotal Earnings Season Begins
As Q1 2025 earnings season kicks off the week of April 15, markets are bracing for one of the most consequential reporting cycles in years. Following the implementation of President Trump’s reciprocal tariffs on April 2—followed swiftly by a 90-day pause announced April 9—investors now shift their attention from policy speculation to performance reality.
The S&P 500 has fallen over 10% since the start of April, driven by valuation resets, economic downgrades, and rotation out of globally exposed sectors. Against this backdrop, Q1 results will serve as a litmus test for margin resilience, guidance confidence, and sector-specific adaptability.
Why This Earnings Season Matters More Than Most
Policy Overhang: Though the 90-day tariff pause removed immediate pressure, companies still face elevated input costs and uncertain trade dynamics.
Recession Anxiety: JPMorgan, Goldman Sachs, and others have lifted U.S. recession probabilities to 45–60% in the wake of the policy shifts.
Rate Cut Expectations: The bond market continues to price in Fed easing. Q1 earnings could influence how quickly the Fed acts—or if it holds steady.
Valuation Recalibration: A sharp selloff has pulled multiples down across tech, consumer discretionary, and industrials. The key question: Have earnings fallen in line?
What to Watch This Week: High-Impact Reports Across Sectors
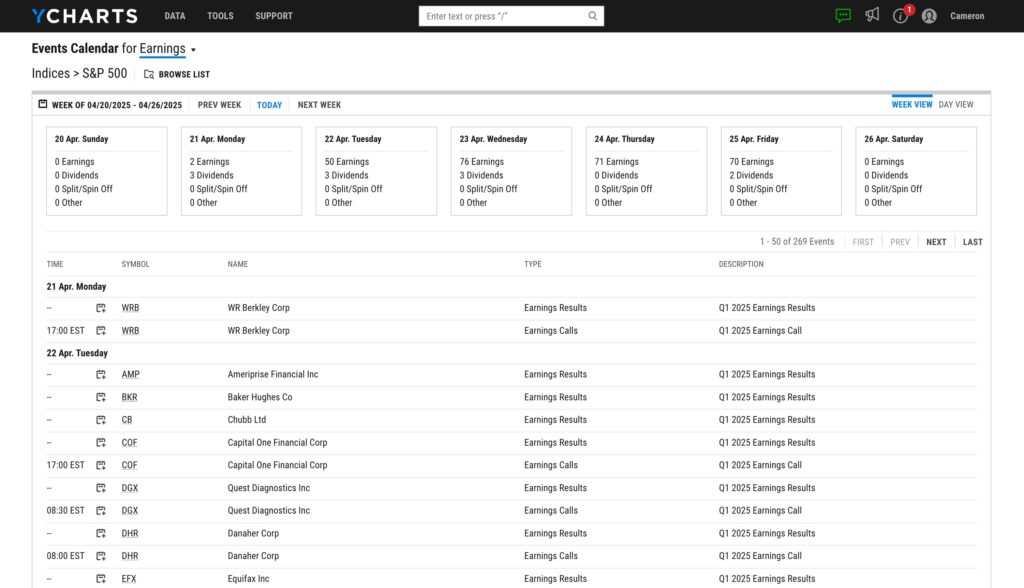
YCharts Events Calendar offers full visibility into every earnings release and earnings call for the S&P 500. Several bellwether companies across key sectors are scheduled to report next week:
Financials (April 15–17)
What to Watch: Net interest margin compression, credit loss provisioning, exposure to corporate debt
Industrials (April 16–19)
What to Watch: Cost inflation, order backlogs, commentary on reshoring and infrastructure demand
Technology (April 17–21)
What to Watch: Cloud growth vs. AI capex, FX impact, export controls
Consumer Discretionary (April 18–22)
What to Watch: Pricing power, China exposure, retail foot traffic
Stay Ahead of Earnings in Real Time
Track S&P 500 earnings by date, ticker, or sector with the YCharts Event Calendar.
Start your Free Trial to view upcoming events.
Early Reads: Pre-Announced Results and Earnings Drift
Although the bulk of earnings begin next week, a small subset of companies has already reported or pre-announced. Early themes include:
Modest EPS beats, but muted stock reactions, indicating low investor conviction
Increased forward-looking uncertainty in earnings calls, especially around FX volatility and global demand
1-day returns after earnings increasingly decoupled from surprises—suggesting macro and sentiment may outweigh fundamentals in near-term price action
Sector Performance (YTD)

Advisor Implications: How to Prepare and Position
1. Recheck Earnings Correlation to Portfolio Volatility
With earnings surprise reactions becoming more unpredictable, advisors should expect volatility from even “safe” names.
Use YCharts’ Scenario & Stress Testing to model earnings-driven drawdowns across sectors.
2. Track Guidance More Than Results
In a macro-sensitive market, forward commentary on Q2 is more important than backward results.
Use Fundamental Charts to track estimate revisions alongside price action and sector benchmarks.
3. Don’t Wait to React
By the time headlines hit, markets may have already priced in key guidance shifts.
Set Earnings Call Alerts in YCharts to follow critical names live or within the hour of release.
Spotlight: Sectors with the Most to Prove
| Sector | Pressure Point | Q1 Themes to Watch |
|---|---|---|
| Tech (XLK) | Export risk, FX, AI spend | Confidence in 2025 capex guidance |
| Industrials (XLI) | Global trade & reshoring | Margin resilience, order visibility |
| Financials (XLF) | NIM compression, credit risk | Loan loss provisions, deposit flows |
| Consumer (XLY) | China, pricing, demand fatigue | Elasticity, promotion dependency |
How YCharts Can Help This Earnings Season
Event Calendar:
Track all S&P 500 earnings calls and releases by day or ticker.
Custom Reports:
Build branded earnings recaps by sector, theme, or portfolio alignment.
Scenario & Stress Testing:
Simulate surprise risk, revenue contraction, or margin compression.
Fundamental Charts:
Visualize stock reactions to earnings vs. benchmark sector or index.
Conclusion: This Is the Earnings Season to Watch
Q1 2025 earnings marks a turning point—not just in guidance but in investor psychology. After a chaotic start to the year dominated by trade headlines and rate speculation, earnings will anchor the next leg of market direction.
For advisors, the task is to stay ahead of the noise, interpret results through a client-specific lens, and guide portfolios with data, not emotion.
Whenever you’re ready, here’s how YCharts can help you:
1. Looking to Move On From Your Investment Research and Analytics Platform?
2. Want to test out YCharts for free?
Start a no-risk 7-Day Free Trial.
Disclaimer
©2025 YCharts, Inc. All Rights Reserved. YCharts, Inc. (“YCharts”) is not registered with the U.S. Securities and Exchange Commission (or with the securities regulatory authority or body of any state or any other jurisdiction) as an investment adviser, broker-dealer or in any other capacity, and does not purport to provide investment advice or make investment recommendations. This report has been generated through application of the analytical tools and data provided through ycharts.com and is intended solely to assist you or your investment or other adviser(s) in conducting investment research. You should not construe this report as an offer to buy or sell, as a solicitation of an offer to buy or sell, or as a recommendation to buy, sell, hold or trade, any security or other financial instrument. For further information regarding your use of this report, please go to: ycharts.com/about/disclosure
Next Article
From Hours to Minutes: Streamlining Proposal Generation to Close New Business FasterRead More →