Record Gas Prices, $BRK Valuation, Income Fund Yields | What’s Trending on YCharts?
With every edition of What’s Trending on YCharts?, we reveal the stocks, funds, and economic data that generated the most traffic each month on YCharts. Are any of these names or data points on your radar?
YCharts pageview data from June 2022 showed that trending market topics include the price-to-book ratio for Berkshire Hathaway (BRK.A, BRK.B), the current state of mutual fund dividend yields, and what might really be behind those high oil and gas prices.
To see everything that’s been trending on YCharts, watch the full episode here:
Most Popular Company Pages
These stock data pages had the most unique pageviews in June 2022.

- Amazon (AMZN)
- Apple (AAPL)
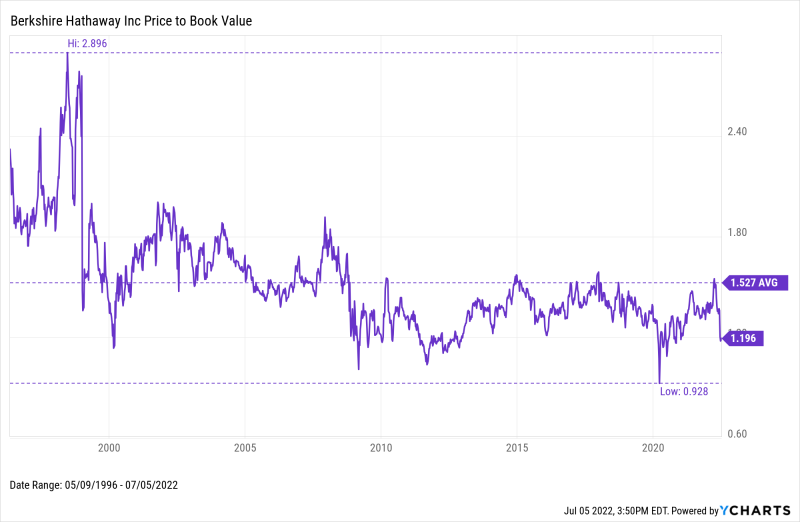
- Berkshire Hathaway (BRK.B) Price to Book Value
- Apple PE Ratio
- Amazon PE Ratio
- Tesla (TSLA)
- Berkshire Hathaway (BRK.A) Price to Book Value
- US Steel (X)
- Microsoft (MSFT)
- Tesla PE Ratio
Although a 23% drop in price from its near-term high in late March is mostly to blame, the price-to-book value for Berkshire Hathaway (BRK.A, BRK.B) has fallen to 1.2. This is well below its historical average of 1.53, and currently at its lowest level since January of last year. Additionally, the last time Berkshire Hathaway’s PB value was less than 1 was March 2020 (the level at which a company is generally defined as fairly valued).
Being a large conglomerate of diverse businesses, Berkshire Hathaway can provide a sort of pulse check on the broader market. Is this recent drop in valuation just a return toward fair valuation, or a potential buying opportunity?
Download Visual | Modify in YCharts
Hottest Mutual Fund & ETF Pages
These mutual fund and ETF pages had the largest month-over-month unique pageview growth in June 2022, as compared to May 2022.
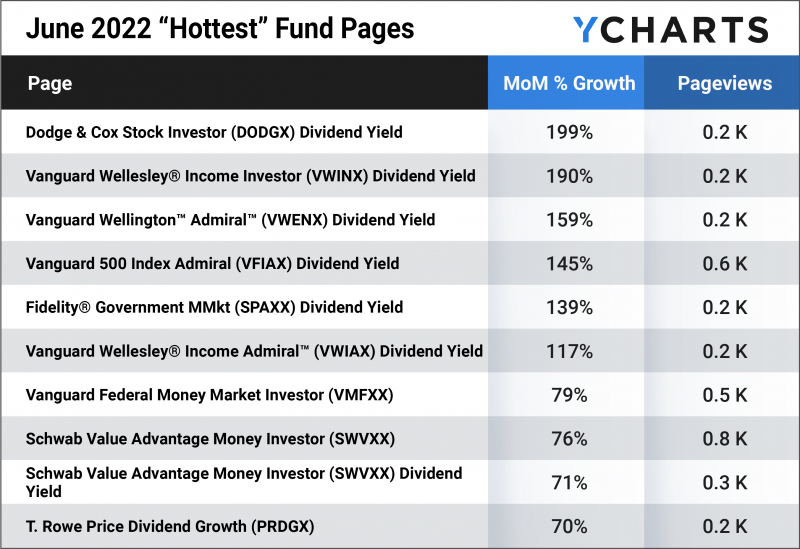
- Dodge & Cox Stock Investor (DODGX) Dividend Yield
- Vanguard Wellesley Income Investor (VWINX) Dividend Yield
- Vanguard Wellington Admiral (VWENX) Dividend Yield
- Vanguard 500 Index Admiral (VFIAX) Dividend Yield
- Fidelity Government Money Market (SPAXX) Dividend Yield
- Vanguard Wellesley Income Admiral (VWIAX) Dividend Yield
- Vanguard Federal Money Market Investor (VMFXX)
- Schwab Value Advantage Money Investor (SWVXX)
- Schwab Value Advantage Money Investor (SWVXX) Dividend Yield
- T. Rowe Price Dividend Growth (PRDGX)
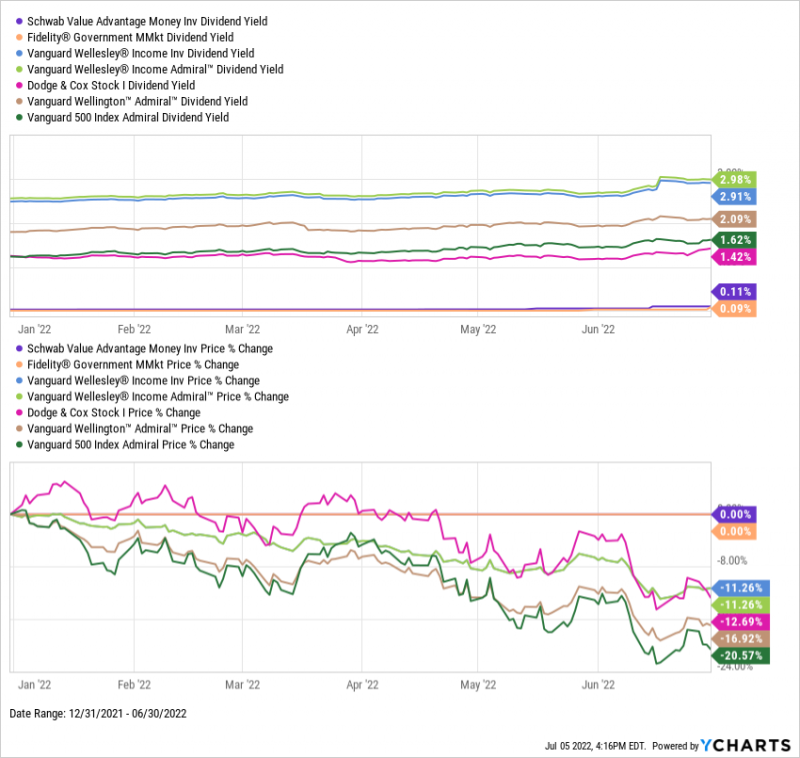
In a year where there is seemingly nowhere to hide, high-dividend funds have been an interesting place of refuge in 2022. The S&P 500, represented by the Vanguard 500 Index Admiral Fund (VFIAX) in the chart below, is down 20.6% through the first half of 2022. Its current dividend yield is 1.62%. However, the Vanguard Wellesley Income Investor (VWINX) and Vanguard Wellesley Income Admiral (VWIAX) both sport dividend yields just shy of 3% and are only down 11.3% in 2022.
The higher dividend yield and lower drawdowns of these funds have been a “win-win” for investors amidst this borderline bear market environment—and perhaps why they experienced a surge in pageviews on YCharts.
Download Visual | Modify in YCharts
Hottest Economic Data Pages
These economic data pages had the largest month-over-month unique pageview growth in June 2022, as compared to May 2022.
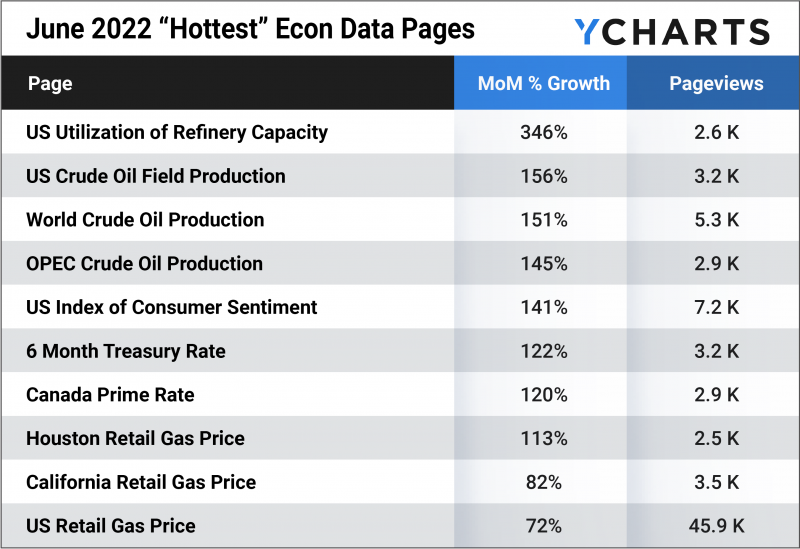
- US Utilization of Refinery Capacity
- US Crude Oil Field Production
- World Crude Oil Production
- OPEC Crude Oil Production
- US Index of Consumer Sentiment
- 6 Month Treasury Rate
- Canada Prime Rate
- Houston Retail Gas Price
- California Retail Gas Price
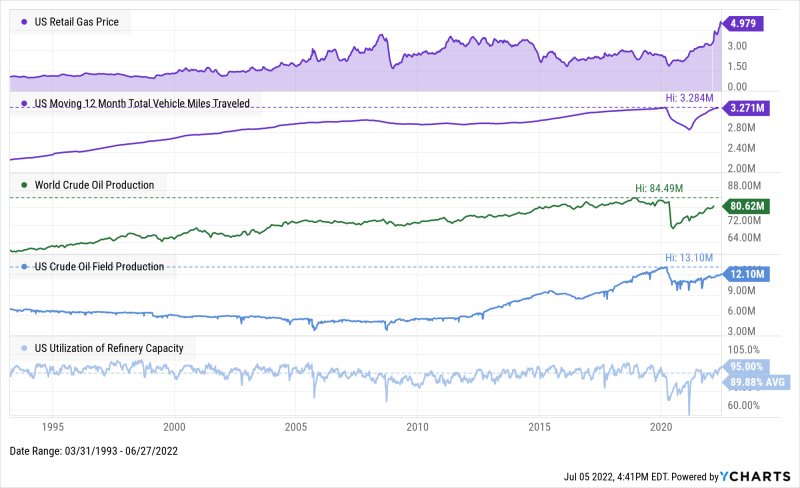
- US Retail Gas Price
When you swipe your credit card at the gas pump, you might wonder: how did the price of gas get to $5 per gallon?
Some of the blame has been pinned on the supply of oil not being able to keep up with demand. It is no secret that Americans are back on the road in full force, evidenced by the US moving 12-month total of vehicle miles traveled that’s just about back to its pre-pandemic highs as of April. On the other hand, crude oil production both in the US and globally are rising steadily, but have not quite caught up to those levels before the pandemic struck.
Though US refineries are being highly utilized, it seems that less total oil available might be the culprit driving gas prices to record highs.
Download Visual | Modify in YCharts
Connect with YCharts
To learn more, call us at (773) 231-5986, or email hello@ycharts.com.
Want to add YCharts to your technology stack? Sign up for a 7-Day Free Trial to see YCharts for yourself.
Disclaimer
©2022 YCharts, Inc. All Rights Reserved. YCharts, Inc. (“YCharts”) is not registered with the U.S. Securities and Exchange Commission (or with the securities regulatory authority or body of any state or any other jurisdiction) as an investment adviser, broker-dealer or in any other capacity, and does not purport to provide investment advice or make investment recommendations. This report has been generated through application of the analytical tools and data provided through ycharts.com and is intended solely to assist you or your investment or other adviser(s) in conducting investment research. You should not construe this report as an offer to buy or sell, as a solicitation of an offer to buy or sell, or as a recommendation to buy, sell, hold or trade, any security or other financial instrument. For further information regarding your use of this report, please go to: ycharts.com/about/disclosure.
Next Article
The Best Performing Mutual Funds in Each Category and How to Find ThemRead More →