Russia vs. Ukraine: An Economic Comparison
Though we are most concerned with the effects on human lives from Russia’s invasion into Ukraine, the situation has become an increasingly financial war as western countries have fought back with economic sanctions.
The current instability and unprecedented economic measures merit special attention to our portfolios and the risks they carry. We recently talked about different ways to hedge a portfolio against geopolitical risk, but what are the impacts of having direct exposure to Ukraine, Russia, or both? Moreover, what are the foundational elements of these two economies and how will they be impacted?
Below, we look at the GDPs and major indices of Russia and Ukraine, see where they lay among the global economic hierarchy, as well as examine how much their economies are truly correlated with the oil and gas industry. While both countries are known as energy producers, you may be less aware that Ukraine boasts a booming tech sector and Russia a growing services industry.
GDP Data for Russia and Ukraine
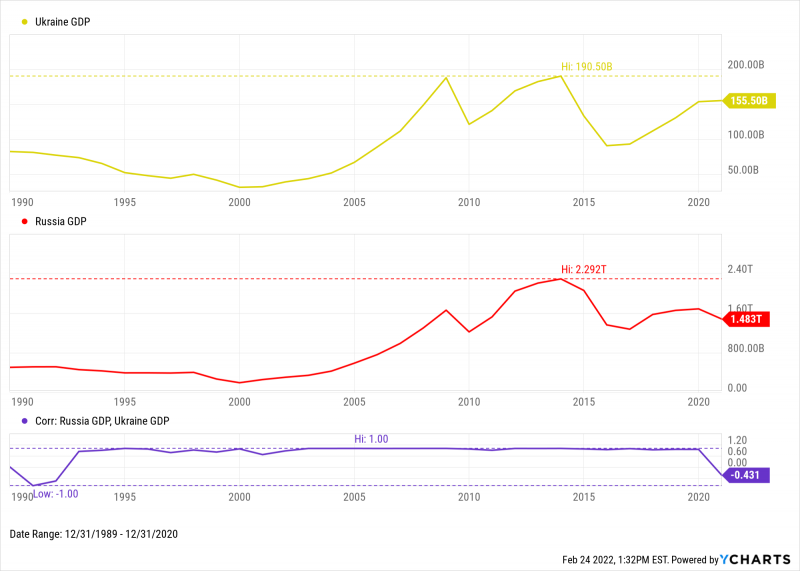
Ukraine’s GDP was $155.5 billion USD at the end of 2020, while Russia’s GDP stood at $1.48 trillion. The annexation of Crimea in 2014 coupled with plummeting oil prices in 2014-2015 cut Ukraine’s GDP by over 50% from its all-time high in just two years. Though Russia’s economy is about ten times larger than Ukraine’s in terms of GDP, Ukraine’s GDP grew 70.8% from 2015 to 2020 while Russia’s advanced only 8.8% in that same time frame. Both economies have progressed in near-perfect correlation since 1989.
Download Visual | Modify in YCharts
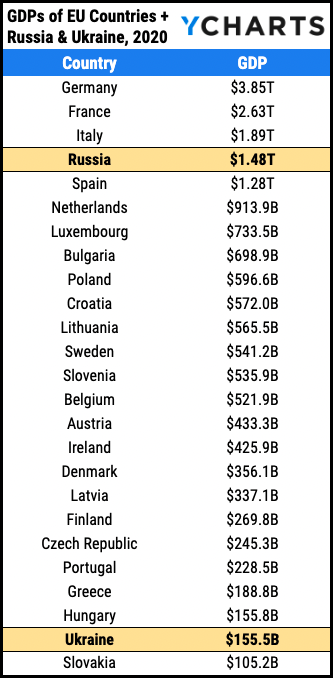
Compared to EU countries, Russia’s GDP trails behind just that of Germany, France, and Italy, while Ukraine’s GDP is greater than only Slovakia’s.
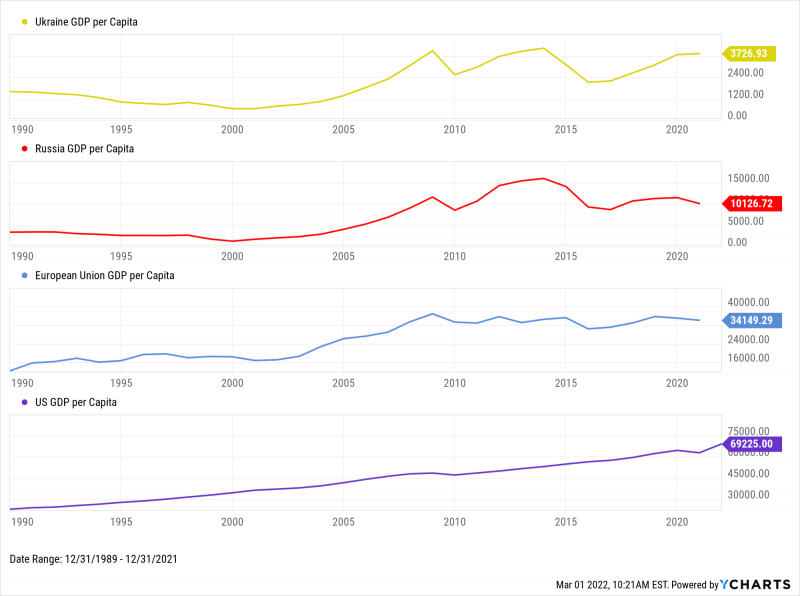
In terms of GDP on a per capita basis, Russia’s GDP per capita was $10,127 USD for 2020, a little less than 3x that of Ukraine’s. For comparison, the 2020 GDP per capita for the European Union and the United States were $34,129 USD and $62,978, respectively. (In 2021, US GDP per capita grew to $69,225.)
Download Visual | Modify in YCharts
Russia and Ukraine Stock Performance
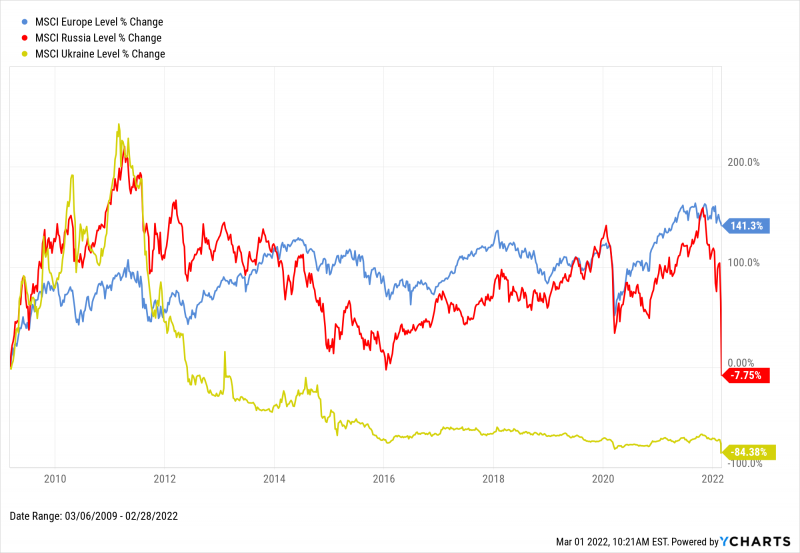
Russian and Ukrainian stock indexes have been relatively volatile in the last decade-plus.. Since the bottom of the global financial crisis in March 2009 through January 2022, the MSCI Russia index advanced 95.2%. February 2022, however, wiped out all of the index’s gains and then some. MSCI Ukraine, on the other hand, has tumbled 84.4%. By comparison, MSCI Europe, which is composed of large and mid-cap constituents across 15 developed countries, has increased 143.7%.
It should be noted that the MSCI Ukraine index is both 100% invested in the Consumer Staples sector and heavily overweight value stocks. MSCI Russia, on the other hand, is only 2.9% invested in Consumer Staples but carries a 51.2% Energy weight. With more diversified holdings, the performance of these indexes could be radically different. Additionally, the Russian annexation of Crimea in 2014 is once again visible in MSCI Ukraine’s worsening decline in that calendar year.
Download Visual | Modify in YCharts
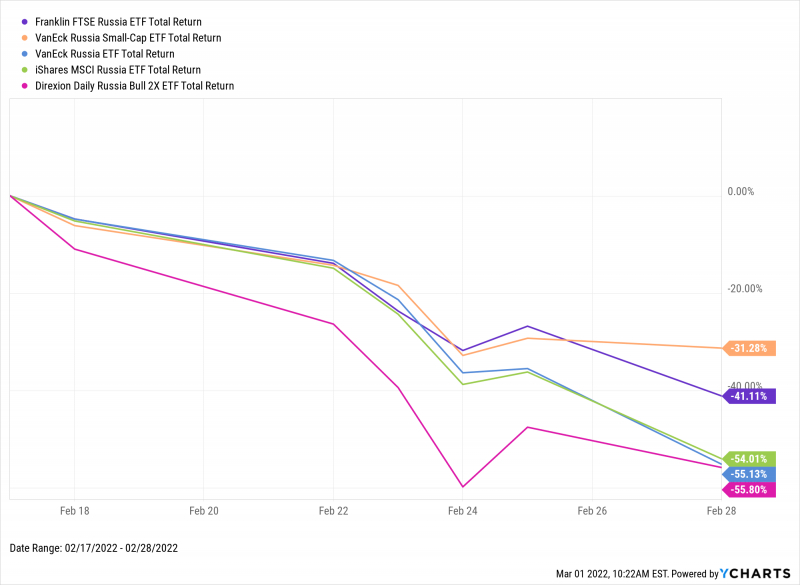
Russia’s invasion of Ukraine has not paid dividends for Russian equities specifically. In the span of just one week, shares of five Russia-concentrated ETFs plummeted by over one-third, on average, which included:
• Franklin FTSE Russia ETF (FLRU)
• VanEck Russia Small-Cap ETF (RSKJ)
• VanEck Russia ETF (RSX)
• iShares MSCI Russia ETF (ERUS)
• Direxion Daily Russia Bull 2X ETF (RUSL)
Download Visual | Modify in YCharts
Historic Performance of Russian Ruble to US Dollar and Euro
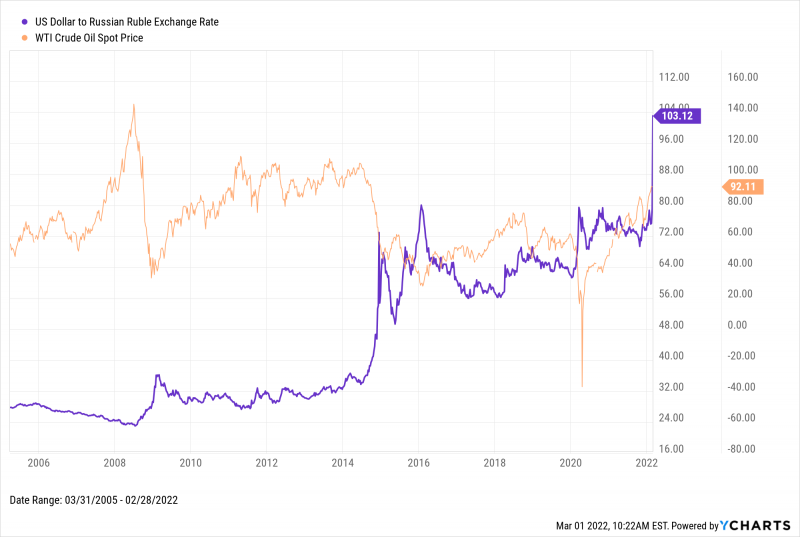
The US Dollar to Russian Ruble exchange rate often has big swings when the price of oil fluctuates. When oil goes up, the Ruble tends to strengthen against the Dollar. This trend is most notable in 2007 to early 2008, as well as between 2016 and 2018. When oil falls, the Ruble usually weakens against the Dollar. In the seven months between June 2014 and January 2015, the price of WTI crude went from a high of $108 to a low of $44. As for the Ruble, 1 US dollar translated to 34 Russian Rubles in June 2014, but the exchange rate skyrocketed at 1 USD to 71 Russian Rubles just seven months later. The current USD to Russian Ruble exchange rate is north of 100 rubles.
Download Visual | Modify in YCharts
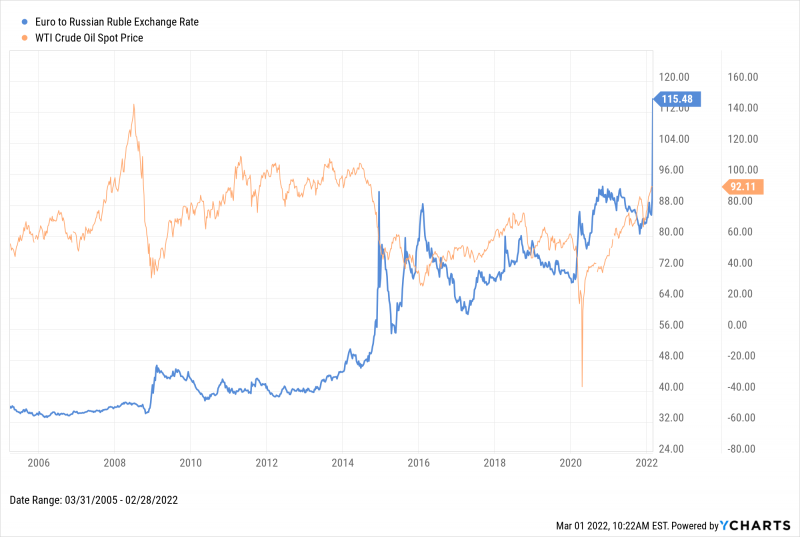
Similar trends can be seen in the Euro to Ruble relationship. Interestingly enough, the Ruble didn’t weaken as much in March 2020 when the coronavirus pandemic sent oil sharply into negative territory. Nor has the Ruble strengthened back to its early 2010s levels when oil prices were in the $80-$110 range, as is the case with oil now.
Download Visual | Modify in YCharts
The current situation in Ukraine is heartbreaking, and troubling at a minimum. But, it’s always interesting to take a step back and appreciate the ramifications for the global economy. Though smaller in comparison to the rest of the European Union, let alone the United States, attacks on Ukraine and its economy are felt around global financial markets.
Connect With YCharts
To get in touch, contact YCharts via email at hello@ycharts.com or by phone at (866) 965-7552
Interested in adding YCharts to your technology stack? Sign up for a 7-Day Free Trial.
Disclaimer
©2022 YCharts, Inc. All Rights Reserved. YCharts, Inc. (“YCharts”) is not registered with the U.S. Securities and Exchange Commission (or with the securities regulatory authority or body of any state or any other jurisdiction) as an investment adviser, broker-dealer or in any other capacity, and does not purport to provide investment advice or make investment recommendations. This report has been generated through application of the analytical tools and data provided through ycharts.com and is intended solely to assist you or your investment or other adviser(s) in conducting investment research. You should not construe this report as an offer to buy or sell, as a solicitation of an offer to buy or sell, or as a recommendation to buy, sell, hold or trade, any security or other financial instrument. For further information regarding your use of this report, please go to: ycharts.com/about/disclosure
Next Article
How Long Does it Take Tech Stocks to Recover From a Crash? with Ben CarlsonRead More →
