Sector Rotation Strategy: Where to Allocate Capital in a Volatile Market
Introduction: Identifying Opportunities in a Volatile Market
Market uncertainty often leave investors and asset managers searching for stability and new opMarket volatility has become a significant concern for investors and asset managers. With fluctuations in the Dow, S&P 500, and Nasdaq, strategic sector rotation is crucial for navigating uncertainty. Understanding which sectors historically lead recoveries and which are demonstrating relative strength can help advisors and asset managers navigate the volatile market.
In this blog, we’ll explore:
- Which sectors typically lead recoveries after a downturn
- Industries currently showing resilience despite market volatility
- How sector rotation strategies can enhance portfolio performance
- Using YCharts sector performance data, ETF fund flows, and momentum indicators, we’ll outline how to shift capital into sectors with the highest probability of leading a recovery.
Which Sectors Historically Lead Market Recoveries?
Historical data shows that certain sectors consistently outperform following market pullbacks. Looking at past downturns, these sectors have tended to lead the charge back to growth:
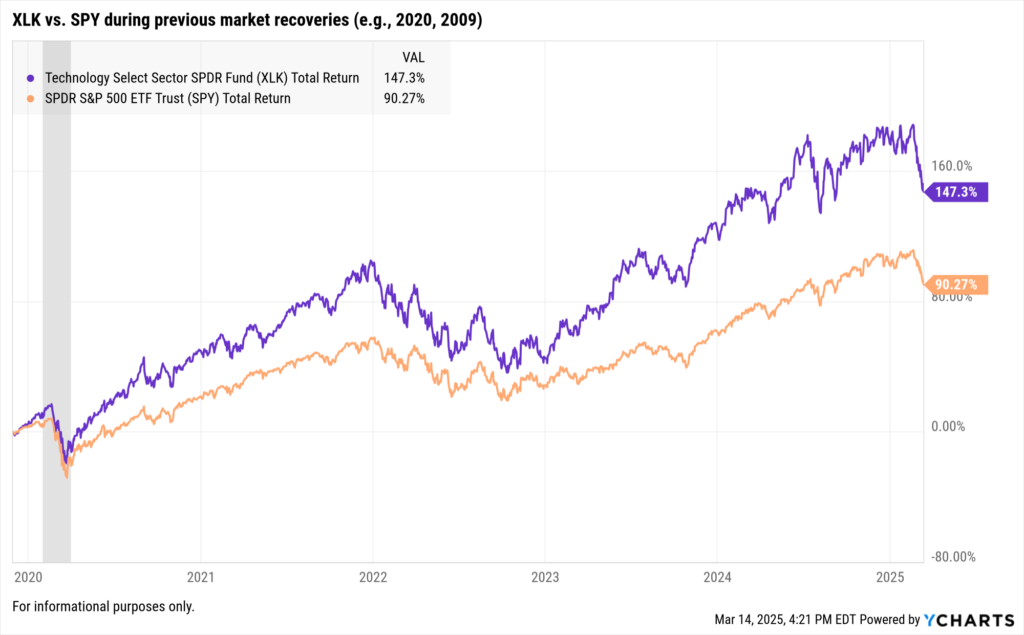
1. Technology (XLK)
- Historically one of the first sectors to rebound after a downturn, driven by innovation and strong earnings growth.
- During the 2009 recovery, tech stocks outperformed the broader market, fueled by rising digital adoption and software demand.
- Even in recent years, semiconductors and cloud computing have been among the strongest rebounders post-correction.
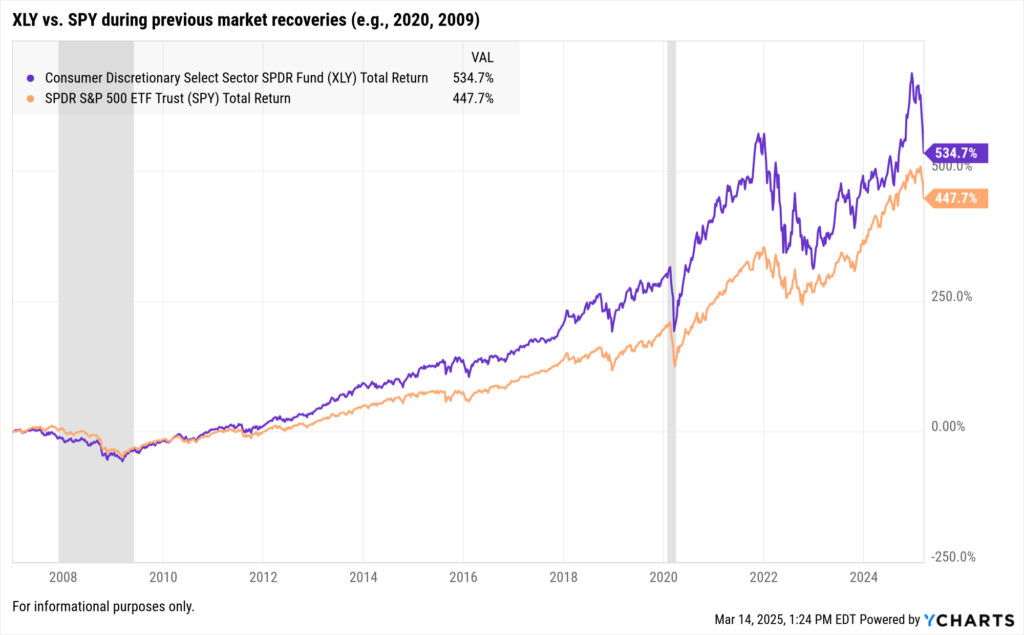
2. Consumer Discretionary (XLY)
- This sector often lags initially but surges as consumer confidence rebounds.
- E-commerce and entertainment tend to lead the discretionary recovery.
- In the 2020 recovery, companies like Amazon and Tesla posted outsized gains.
3. Financials (XLF)
- Banks and insurance firms benefit from rising interest rates in the later stages of a market recovery.
- Credit markets and capital inflows support financial stocks after downturns.
- ETF Fund Flow Data on YCharts can highlight when capital begins rotating back into this sector.
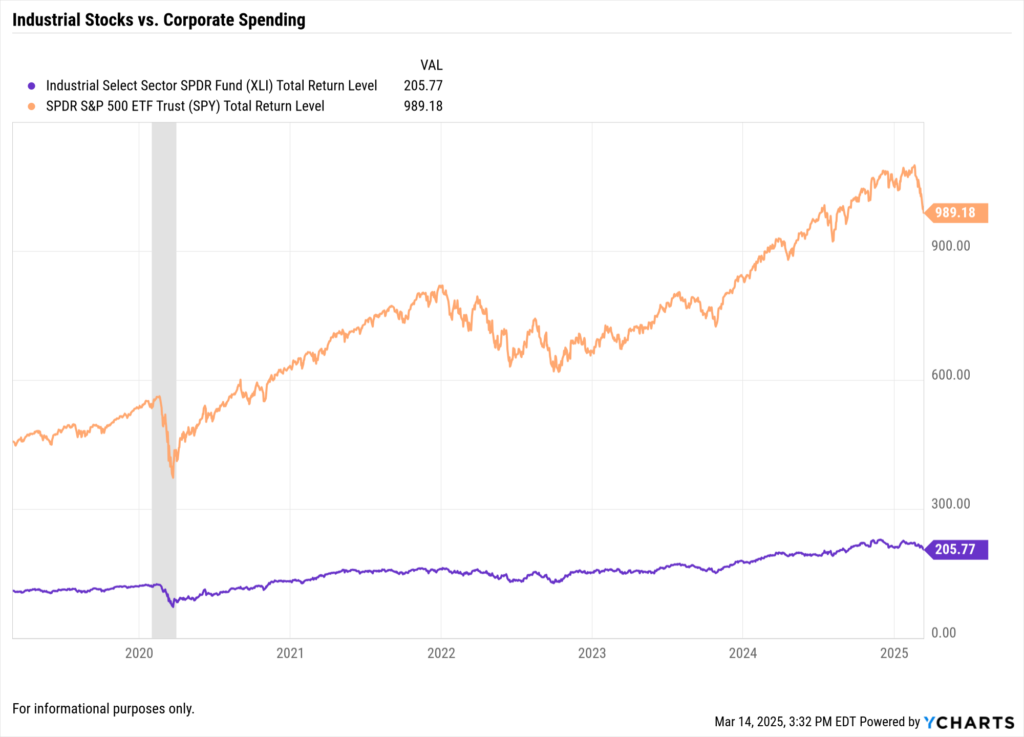
4. Industrials (XLI)
- Industrial stocks gain momentum as corporate spending resumes.
- Defense, aerospace, and construction stocks typically outperform during early recoveries.
- This sector surged after the 2016 election-driven market recovery and again post-2020.
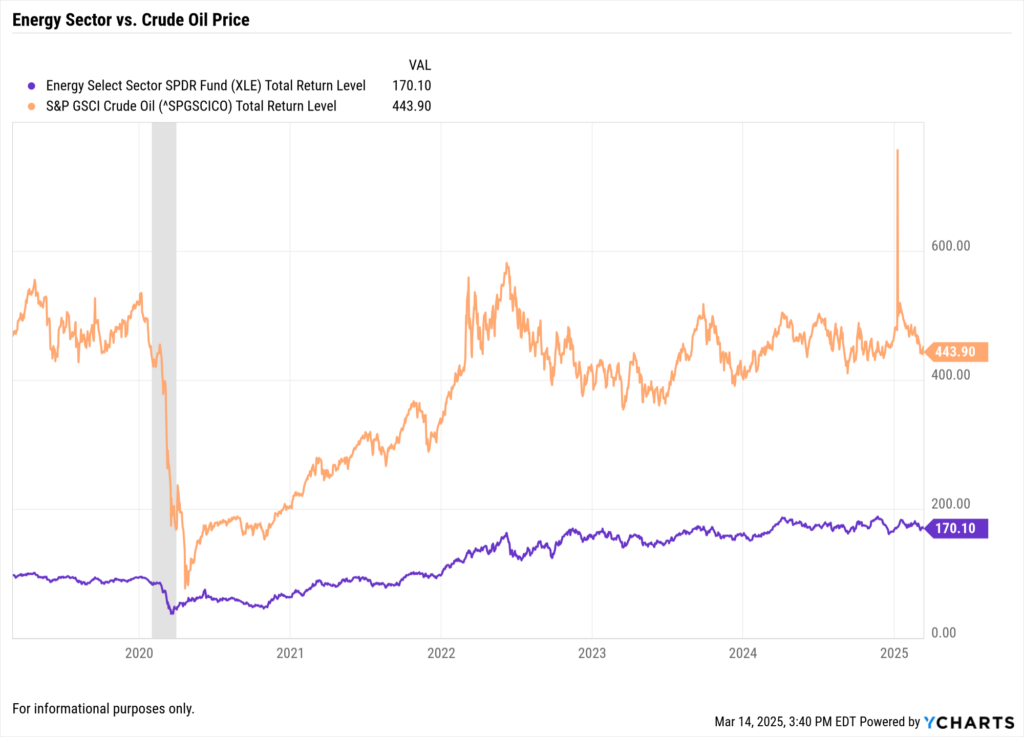
5. Energy (XLE)
- Energy stocks perform well when inflationary pressures remain, despite broader market weakness.
- The sector rebounded sharply in 2021-2022 as oil prices recovered from pandemic lows.
- YCharts’ commodity price charts can help track energy sector momentum.
Which Sectors Are Showing Strength in 2025?
Despite the current market weakness, some industries are demonstrating relative strength and lower drawdowns compared to the broader market:
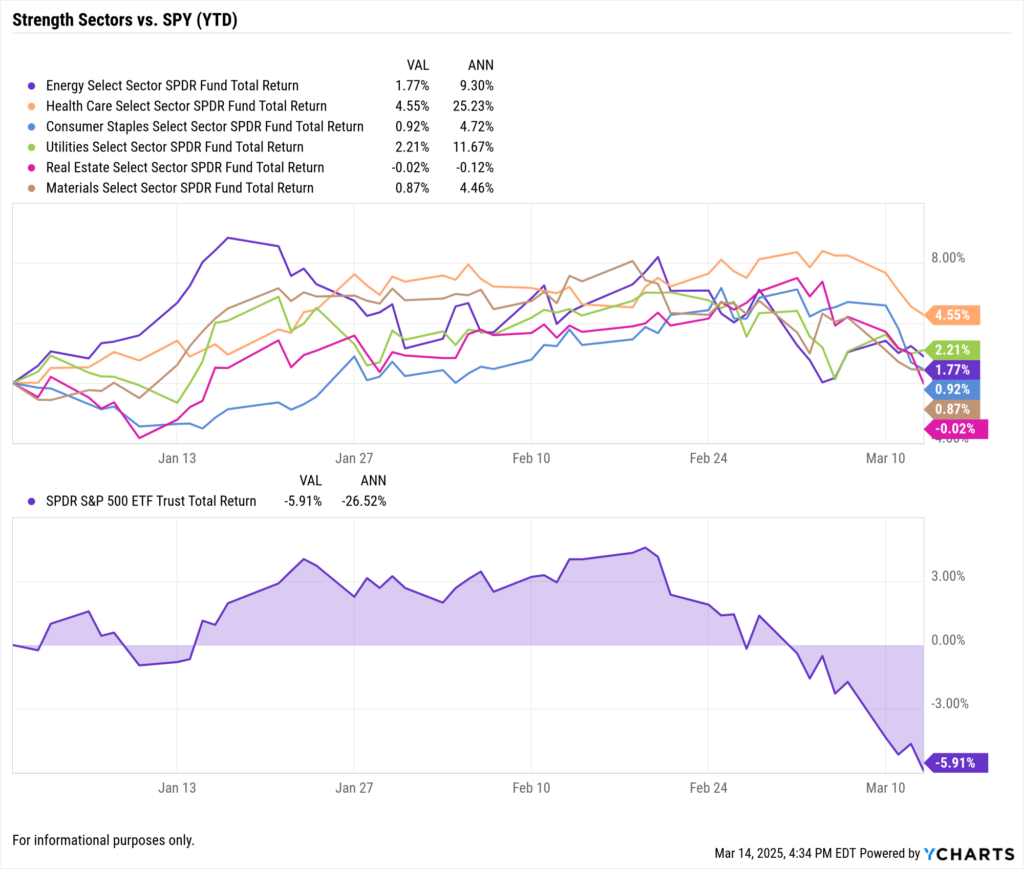
1. Utilities (XLU)
Utilities are traditionally defensive, offering stability during market downturns. As of March 7, 2025, the Utilities Select Sector SPDR ETF (XLU) has risen nearly 21% over the past year, outperforming the S&P 500, which achieved roughly half those gains in the same period.
2. Healthcare (XLV)
The healthcare sector remains resilient due to its essential nature. Amidst market volatility, healthcare stocks have shown stability, with companies like Merck, Gilead, CVS Health, Amgen, and Stryker highlighted as promising investments.
3. Consumer Staples (XLP)
Consumer staples companies, producing everyday necessities, have outperformed during market volatility. The Consumer Staples Select Sector SPDR Fund (XLP) has risen over 6% in the past month, while the broader S&P 500 index fell.
4. Gold & Precious Metals ETFs
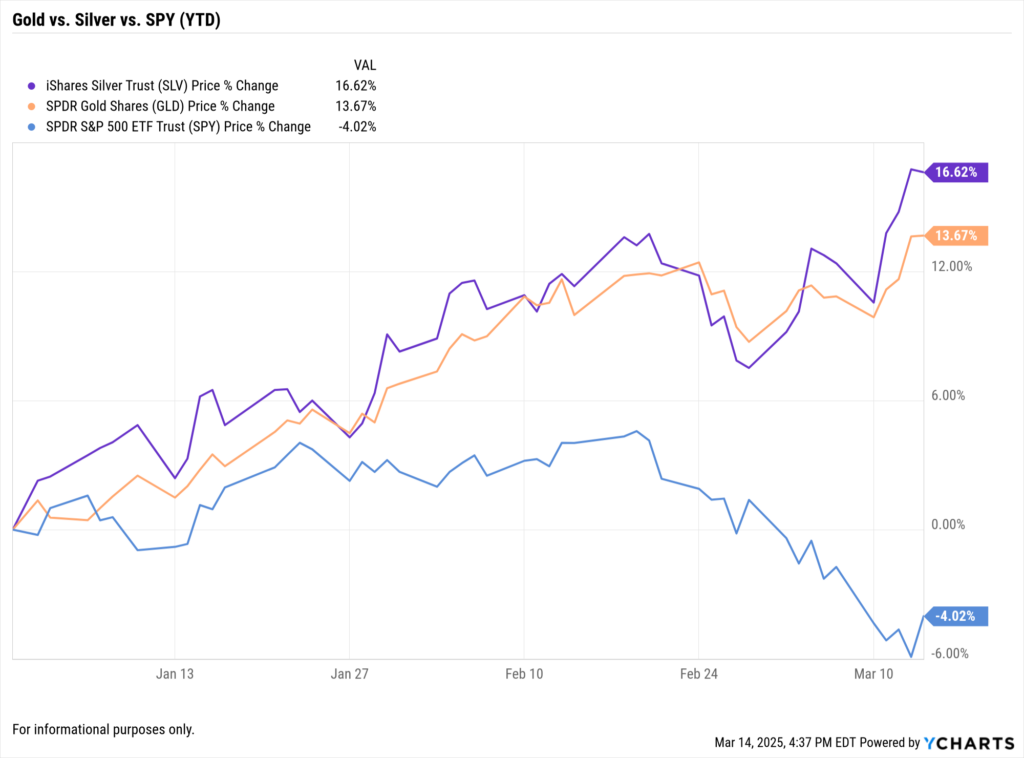
Gold has seen increased demand as a safe-haven investment amid economic and geopolitical instability. Goldman Sachs recently raised its year-end forecast for gold prices to $3,100, driven by strong central bank demand and inflows into gold ETF holdings.
5. Real Estate Investment Trusts (REITs)
REITs have experienced modest performance, with a January 2025 average total return of -1.29%. While some property types faced challenges, sectors like Timber showed gains, indicating selective opportunities within the REIT space.
These observations underscore the importance of sector diversification and a defensive investment approach during periods of market uncertainty.
Sector Rotation Strategy: How to Position for a Recovery
1. Monitor Fund Flows and Momentum Indicators

For informational purposes only.
- Use YCharts ETF Fund Flow data to track sector inflows and outflows.
- Identify where institutional investors are allocating capital in real time.
2. Transition from Defensive to Growth Sectors
- In the early stages of a recovery, shift from defensive sectors (Utilities, Healthcare, Staples) to growth sectors (Technology, Consumer Discretionary, Industrials).
- Use YCharts Fundamental Charts to compare sector performance over time.
3. Assess Valuations and Earnings Trends

- Look at YCharts’ PE Ratio Charts to compare sector valuations.
- Favor sectors where earnings estimates are rising despite the downturn.
4. Hedge Against Further Volatility
- Consider allocating to commodities, bonds, and low-beta equities if market uncertainty persists.
- YCharts Correlation Analysis can help advisors balance portfolio risk.
How YCharts Can Help Advisors Navigate Sector Rotation
YCharts provides a suite of tools that financial advisors and asset managers can use to assess sector rotation opportunities and refine investment strategies:
1. ETF Fund Flow Data
- Track where money is moving within sectors and across asset classes.
2. Sector Rotation Visuals
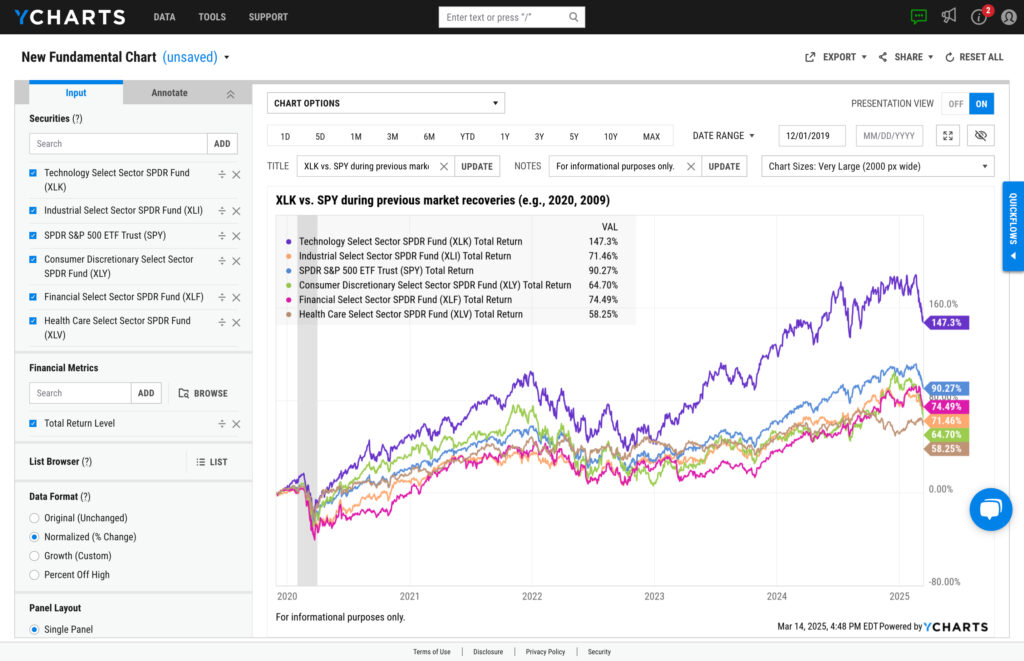
- Use YCharts Fundamental Charts to compare past bear markets and sector rebounds.
3. Momentum and Technical Indicators
- Identify which sectors are gaining strength with momentum metrics and performance overlays.
4. Custom Reports for Client Communication
- Generate sector-specific performance reports using the YCharts Report Builder.
Conclusion: Preparing for the Next Market Recovery
While the current volatile market has left many sectors in the red, history suggests that sector rotation strategies can enhance returns during recoveries.
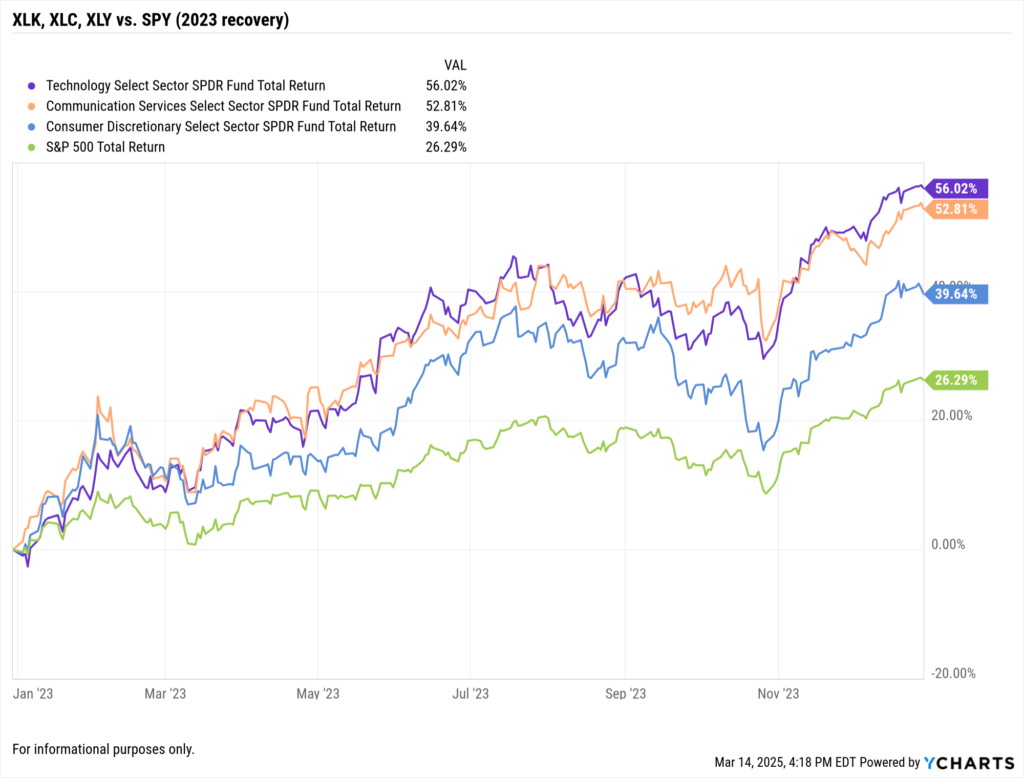
Technology, Consumer Discretionary, Financials, Industrials, and Energy have historically led market rebounds. Meanwhile, Healthcare, Utilities, Consumer Staples, and Precious Metals ETFs are showing current resilience.
By leveraging sector momentum data, ETF fund flows, and valuation metrics through YCharts, advisors can make informed, data-driven decisions when reallocating capital in uncertain markets.
Whenever you’re ready, here’s how YCharts can help you:
1. Looking to Move On From Your Investment Research and Analytics Platform?
2. Want to test out YCharts for free?
Start a no-risk 7-Day Free Trial.
Disclaimer
©2025 YCharts, Inc. All Rights Reserved. YCharts, Inc. (“YCharts”) is not registered with the U.S. Securities and Exchange Commission (or with the securities regulatory authority or body of any state or any other jurisdiction) as an investment adviser, broker-dealer or in any other capacity, and does not purport to provide investment advice or make investment recommendations. This report has been generated through application of the analytical tools and data provided through ycharts.com and is intended solely to assist you or your investment or other adviser(s) in conducting investment research. You should not construe this report as an offer to buy or sell, as a solicitation of an offer to buy or sell, or as a recommendation to buy, sell, hold or trade, any security or other financial instrument. For further information regarding your use of this report, please go to: ycharts.com/about/disclosure
Next Article
Dots and Derivatives: Comparing Covered Call ETFs with Scatter PlotsRead More →