The 10 Best Performing Stocks in the Last 25 Years
Published: June 1, 2026 | Analysis by YCharts Research Team
Introduction
Understanding which companies have stood the test of time is invaluable for advisors guiding clients through uncertain markets. That’s why we used the YCharts Stock Screener to identify the best performing stocks across key lookback periods, including year-to-date, 1, 3, 5, 10, and 25 years, across the entire Russell 1000.
Rather than focus solely on recent winners, this analysis reveals which companies consistently rewarded investors over time, whether through capital appreciation, strong fundamentals, or dividend reinvestment. These insights help advisors put short-term volatility in context while positioning for long-term growth.
From 2026’s leaders to the stunning 25-year returns of household names like Monster Beverage and NVIDIA, here’s what advisors need to know about the stocks that delivered year after year.
Click to jump to a section:
- Best-Performing Stocks YTD
- Best-Performing Stocks in the Last Year
- Best-Performing Stocks in the Last 3 Years
- Best-Performing Stocks in the Last 5 Years
- Best-Performing Stocks in the Last 10 Years
- Best-Performing Stocks in the Last 25 Years
- What Was the Growth of $10,000 Over the Last 25 Years?
- How Would Making Regular Contributions Affect Overall Returns?
For a look at the best performers with a dividend focus, check out our analysis on the Best Performing Dividend Stocks.
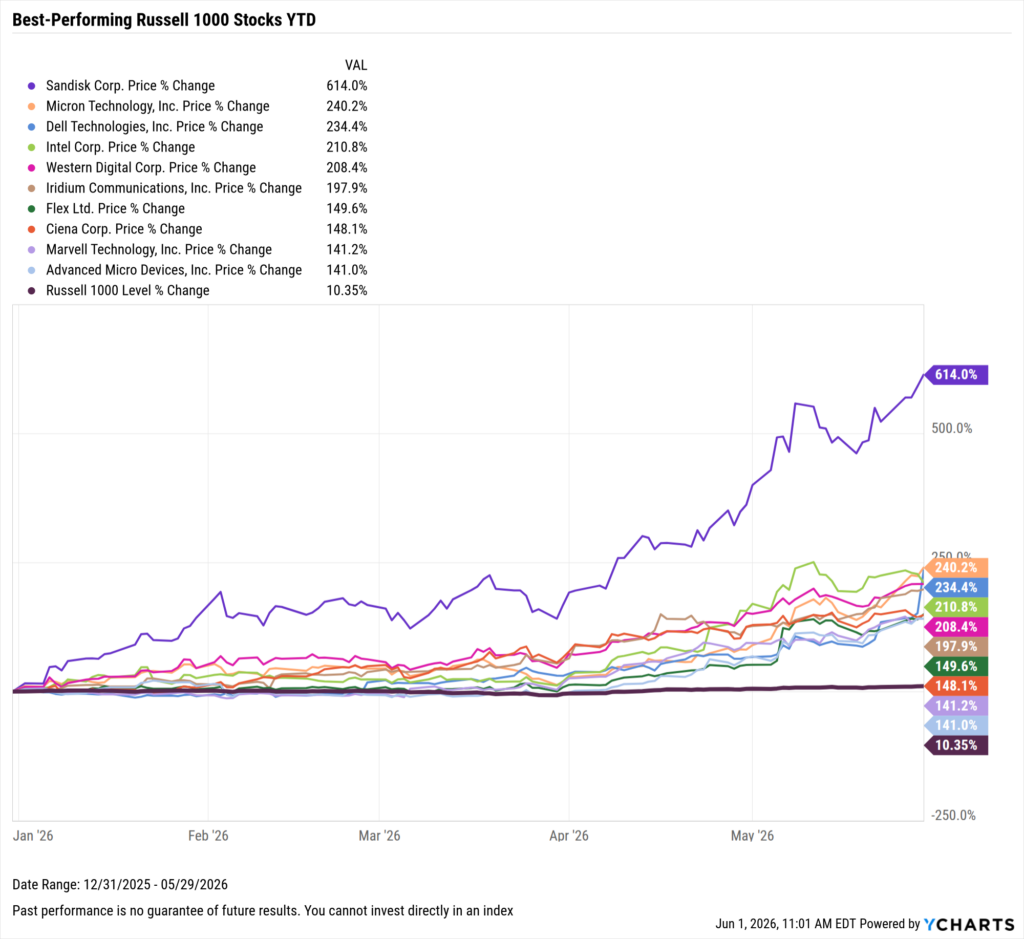
Best Performing Stocks YTD
These are the top-performing stocks year-to-date in 2026, as of May 31st, 2026.
| Ticker | Name | YTD Price Return | YTD Total Return | Market Cap |
|---|---|---|---|---|
| SNDK | Sandisk Corp. | 614.04% | 614.04% | 251.01B |
| MU | Micron Technology, Inc. | 240.21% | 240.37% | 1.095T |
| DELL | Dell Technologies, Inc. | 234.37% | 236.95% | 273.41B |
| INTC | Intel Corp. | 210.79% | 210.79% | 576.38B |
| WDC | Western Digital Corp. | 208.36% | 208.51% | 183.10B |
| IRDM | Iridium Communications, Inc. | 197.93% | 199.72% | 5.475B |
| FLEX | Flex Ltd. | 149.55% | 149.55% | 55.24B |
| CIEN | Ciena Corp. | 148.10% | 148.10% | 82.04B |
| MRVL | Marvell Technology, Inc. | 141.23% | 141.52% | 179.33B |
| AMD | Advanced Micro Devices, Inc. | 140.99% | 140.99% | 841.55B |
View in YCharts | Start a Free Trial to See Full Rankings
Download Visual | Modify in YCharts
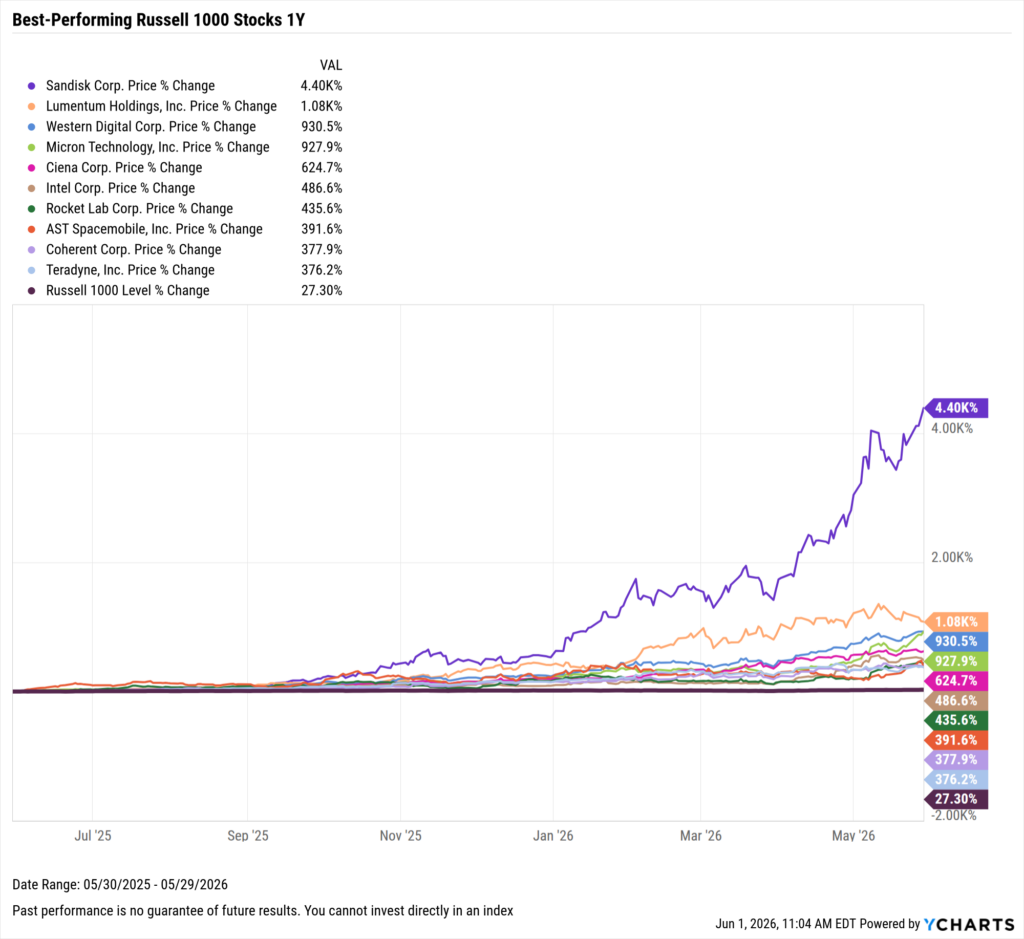
Best Performing Stocks in the Last Year
These are the top-performing stocks between June 1, 2025 and May 31, 2026.
| Ticker | Name | 1Y Price Return | 1Y Total Return | Market Cap |
|---|---|---|---|---|
| SNDK | Sandisk Corp. | 4397.16% | 4397.16% | 251.01B |
| LITE | Lumentum Holdings, Inc. | 1082.84% | 1082.84% | 66.52B |
| WDC | Western Digital Corp. | 930.48% | 934.81% | 183.10B |
| MU | Micron Technology, Inc. | 927.95% | 930.45% | 1.095T |
| CIEN | Ciena Corp. | 624.74% | 624.74% | 82.04B |
| INTC | Intel Corp. | 486.60% | 486.60% | 576.38B |
| RKLB | Rocket Lab Corp. | 435.57% | 435.57% | 83.04B |
| ASTS | AST Spacemobile, Inc. | 391.59% | 391.59% | 33.88B |
| COHR | Coherent Corp. | 377.95% | 377.95% | 70.72B |
| TER | Teradyne, Inc. | 376.22% | 377.40% | 58.60B |
View in YCharts | Start a Free Trial to See Full Rankings
Download Visual | Modify in YCharts
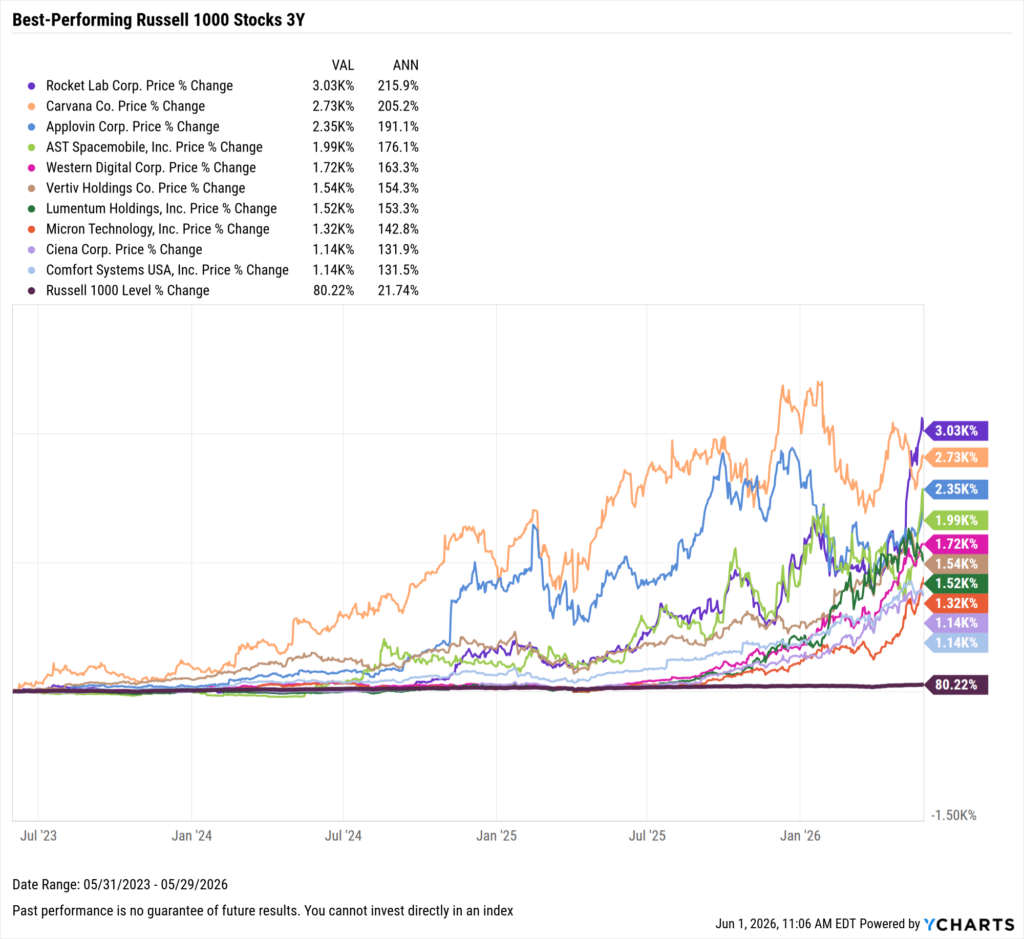
Best Performing Stocks in the Last 3 Years
These are the top-performing stocks between June 1, 2023 and May 31, 2026.
| Ticker | Name | 3Y Price Return | 3Y Total Return | Market Cap |
|---|---|---|---|---|
| RKLB | Rocket Lab Corp. | 3032.75% | 3032.75% | 83.04B |
| CVNA | Carvana Co. | 2725.08% | 2725.08% | 52.29B |
| APP | Applovin Corp. | 2351.38% | 2351.38% | 205.96B |
| ASTS | AST Spacemobile, Inc. | 1992.44% | 1992.44% | 33.88B |
| WDC | Western Digital Corp. | 1715.15% | 1722.79% | 183.10B |
| VRT | Vertiv Holdings Co. | 1535.80% | 1541.29% | 121.27B |
| LITE | Lumentum Holdings, Inc. | 1516.18% | 1516.18% | 66.52B |
| MU | Micron Technology, Inc. | 1323.75% | 1342.31% | 1.095T |
| CIEN | Ciena Corp. | 1141.40% | 1141.40% | 82.04B |
| FIX | Comfort Systems USA, Inc. | 1135.44% | 1148.48% | 64.36B |
View in YCharts | Start a Free Trial to See Full Rankings
Download Visual | Modify in YCharts
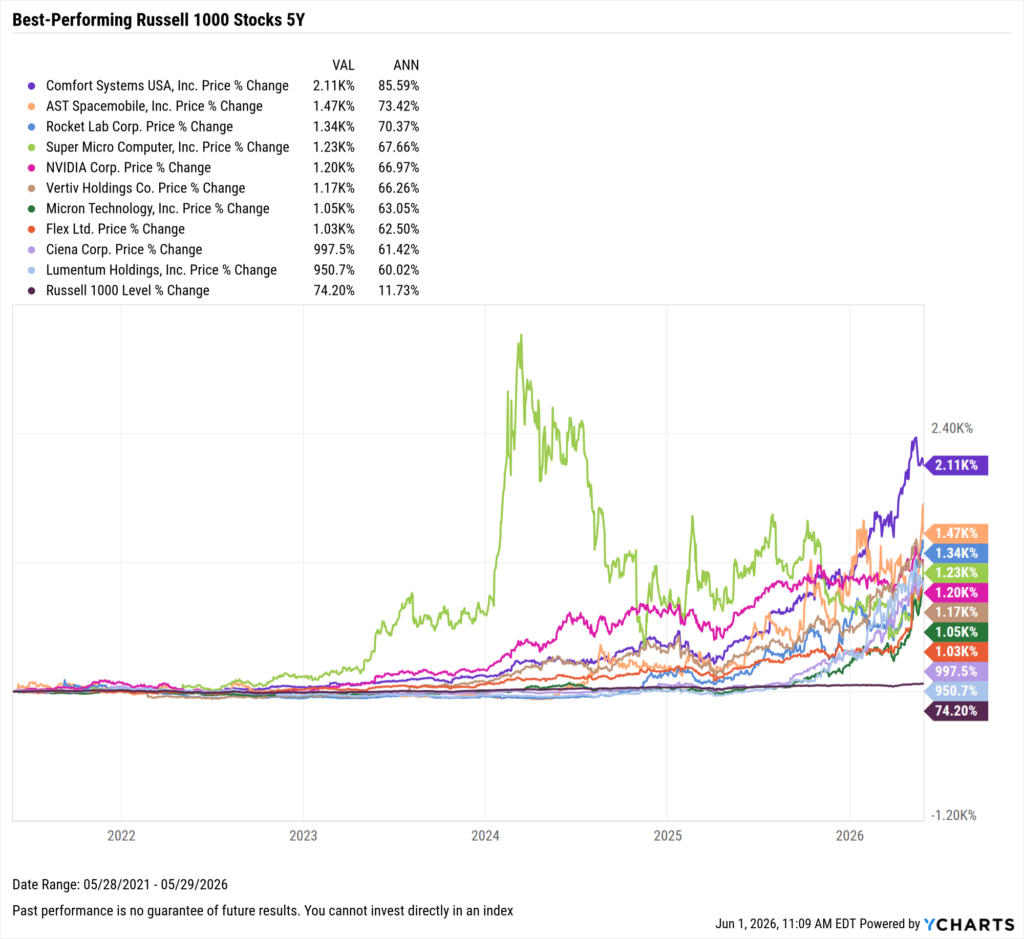
Best Performing Stocks in the Last 5 Years
These are the top-performing stocks between June 1, 2021 and May 31, 2026.
| Ticker | Name | 5Y Price Return | 5Y Total Return | Market Cap |
|---|---|---|---|---|
| FIX | Comfort Systems USA, Inc. | 2105.32% | 2153.35% | 64.36B |
| ASTS | AST Spacemobile, Inc. | 1470.78% | 1470.78% | 33.88B |
| RKLB | Rocket Lab Corp. | 1337.68% | 1337.68% | 83.04B |
| SMCI | Super Micro Computer, Inc. | 1226.71% | 1226.71% | 27.72B |
| NVDA | NVIDIA Corp. | 1199.76% | 1203.01% | 5.114T |
| VRT | Vertiv Holdings Co. | 1172.00% | 1177.73% | 121.27B |
| MU | Micron Technology, Inc. | 1054.03% | 1083.47% | 1.095T |
| FLEX | Flex Ltd. | 1034.58% | 1034.58% | 55.24B |
| CIEN | Ciena Corp. | 997.47% | 997.47% | 82.04B |
| LITE | Lumentum Holdings, Inc. | 950.71% | 950.71% | 66.52B |
View in YCharts | Start a Free Trial to See Full Rankings
Download Visual | Modify in YCharts
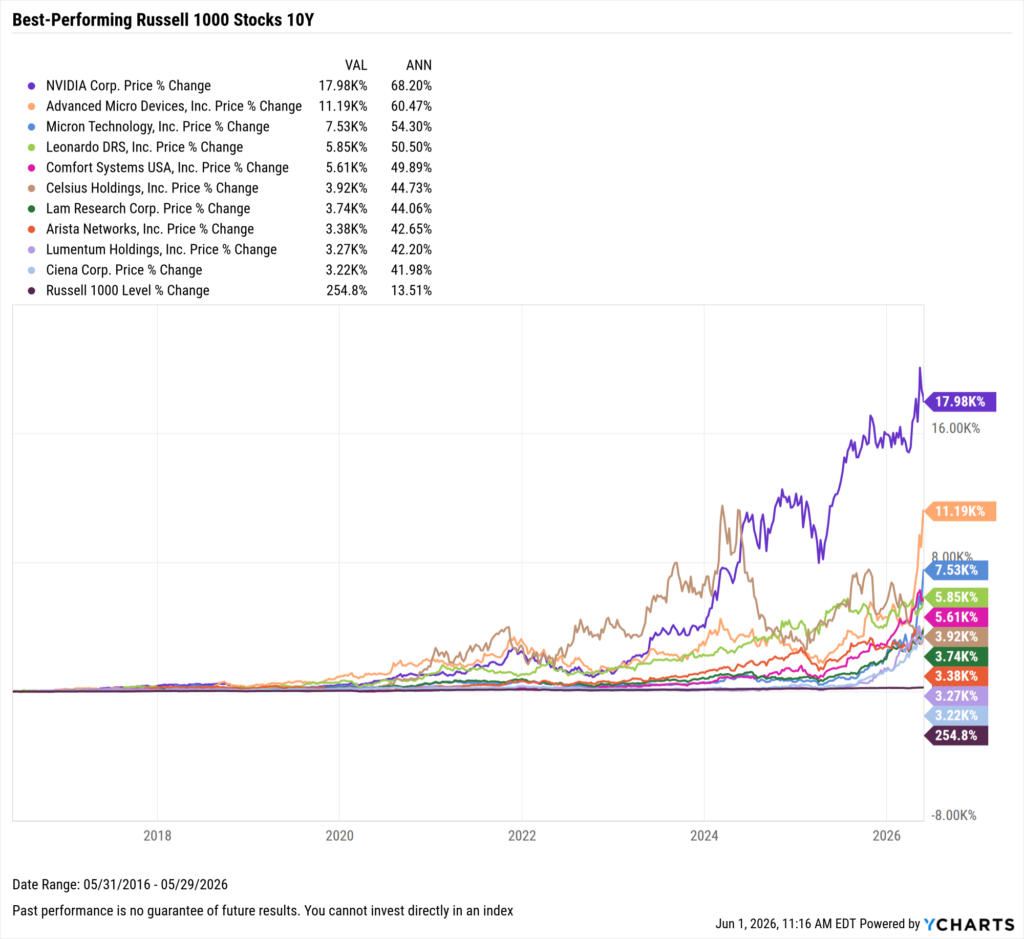
Best Performing Stocks in the Last 10 Years
These are the top-performing stocks between June 1, 2016 and May 31, 2026.
| Ticker | Name | 10Y Price Return | 10Y Total Return | Market Cap |
|---|---|---|---|---|
| NVDA | NVIDIA Corp. | 17977.05% | 18311.83% | 5.114T |
| AMD | Advanced Micro Devices, Inc. | 11193.22% | 11193.22% | 841.55B |
| MU | Micron Technology, Inc. | 7533.65% | 7728.40% | 1.095T |
| DRS | Leonardo DRS, Inc. | 5846.34% | 5929.86% | 13.01B |
| FIX | Comfort Systems USA, Inc. | 5613.16% | 5983.10% | 64.36B |
| CELH | Celsius Holdings, Inc. | 3924.60% | 3924.60% | 8.505B |
| LRCX | Lam Research Corp. | 3742.29% | 4305.89% | 397.91B |
| ANET | Arista Networks, Inc. | 3381.40% | 3381.40% | 200.80B |
| LITE | Lumentum Holdings, Inc. | 3273.95% | 3273.95% | 66.52B |
| CIEN | Ciena Corp. | 3223.20% | 3223.20% | 82.04B |
View in YCharts | Start a Free Trial to See Full Rankings
Download Visual | Modify in YCharts
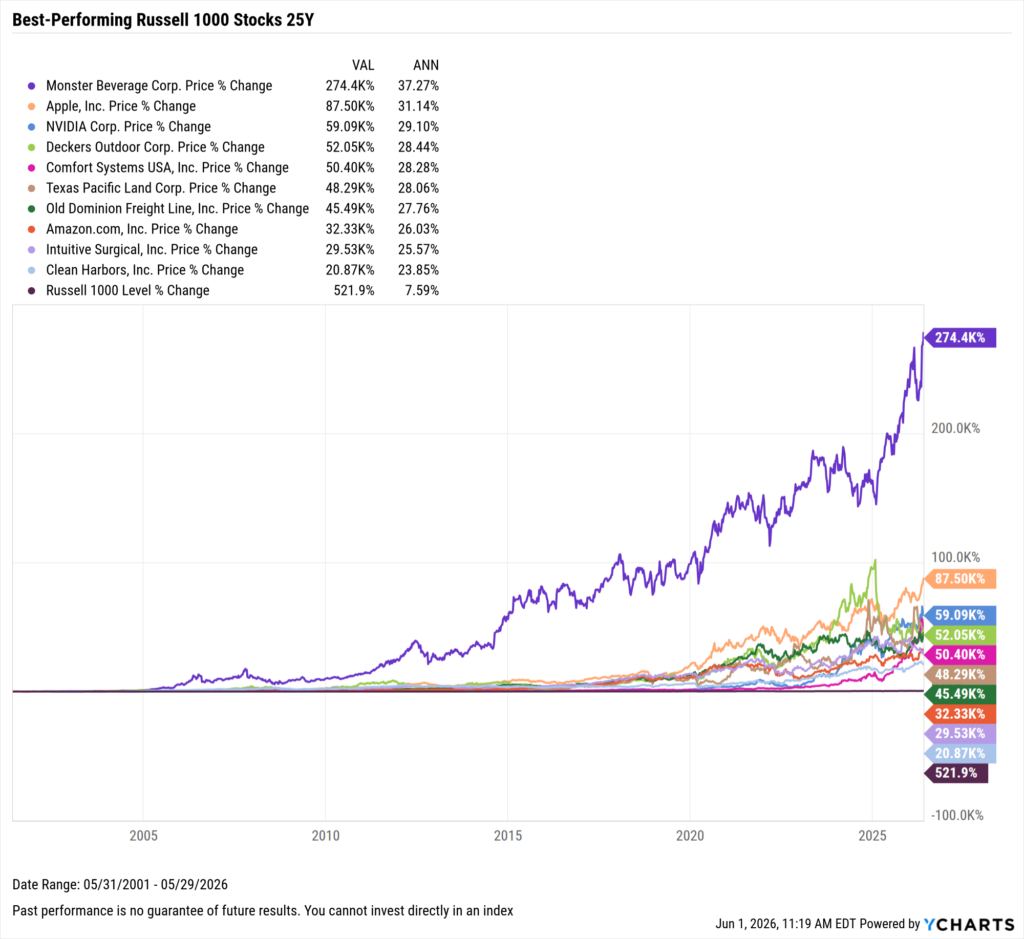
Best Performing Stocks in the Last 25 Years
These are the top-performing stocks between June 1, 2001 and May 31, 2026.
| Ticker | Name | 25Y Price Return | 25Y Total Return | Market Cap |
|---|---|---|---|---|
| MNST | Monster Beverage Corp. | 274437.92% | 274437.92% | 87.03B |
| AAPL | Apple, Inc. | 87495.79% | 104408.77% | 4.507T |
| NVDA | NVIDIA Corp. | 59091.27% | 64454.43% | 5.306T |
| DECK | Deckers Outdoor Corp. | 52045.12% | 52045.12% | 15.54B |
| FIX | Comfort Systems USA, Inc. | 50403.04% | 62979.32% | 62.99B |
| TPL | Texas Pacific Land Corp. | 48285.79% | 60615.65% | 26.26B |
| ODFL | Old Dominion Freight Line, Inc. | 45492.89% | 47389.40% | 47.20B |
| AMZN | Amazon.com, Inc. | 32331.40% | 32331.40% | 2.837T |
| ISRG | Intuitive Surgical, Inc. | 29526.05% | 29526.05% | 148.25B |
| CLH | Clean Harbors, Inc. | 20872.39% | 20872.39% | 14.86B |
View in YCharts | Start a Free Trial to See Full Rankings
Download Visual | Modify in YCharts
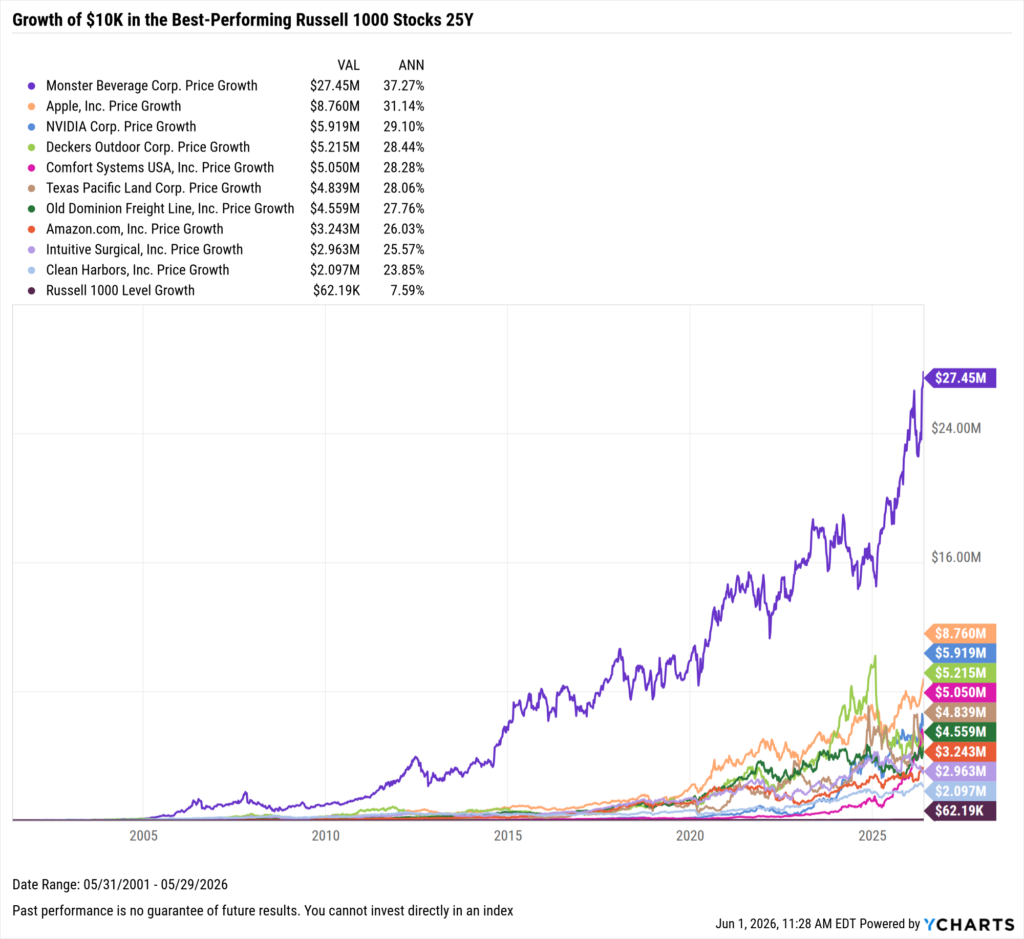
What Was the Growth of $10,000 Over the Last 25 Years?
If you invested $10,000 25 years ago into any of the ten best-performing stocks over the last 25 years, your balance today would be in the millions of dollars.
The best-performing stock in the last 25 years was Monster Beverage (MNST). A $10,000 investment into Monster Beverage 25 years ago would be worth $27.45 million today. Right behind it is Apple (AAPL); $10,000 invested into FIX in 2001 would’ve turned into $8.76 million today, or $10.45 million after dividend reinvestment.
| Ticker | Name | 25Y Price Growth | 25Y Total Return |
|---|---|---|---|
| MNST | Monster Beverage Corp. | $27.45 million | $27.45 million |
| AAPL | Apple, Inc. | $8.760 million | $10.45 million |
| NVDA | NVIDIA Corp. | $5.919 million | $6.455 million |
| DECK | Deckers Outdoor Corp. | $5.215 million | $5.215 million |
| FIX | Comfort Systems USA, Inc. | $5.050 million | $6.308 million |
| TPL | Texas Pacific Land Corp. | $4.839 million | $6.072 million |
| ODFL | Old Dominion Freight Line, Inc. | $4.559 million | $4.749 million |
| AMZN | Amazon.com, Inc. | $3.243 million | $3.243 million |
| ISRG | Intuitive Surgical, Inc. | $2.963 million | $2.963 million |
| CLH | Clean Harbors, Inc. | $2.097 million | $2.097 million |
Start a Free Trial to See Full Rankings
Download Visual | Modify in YCharts
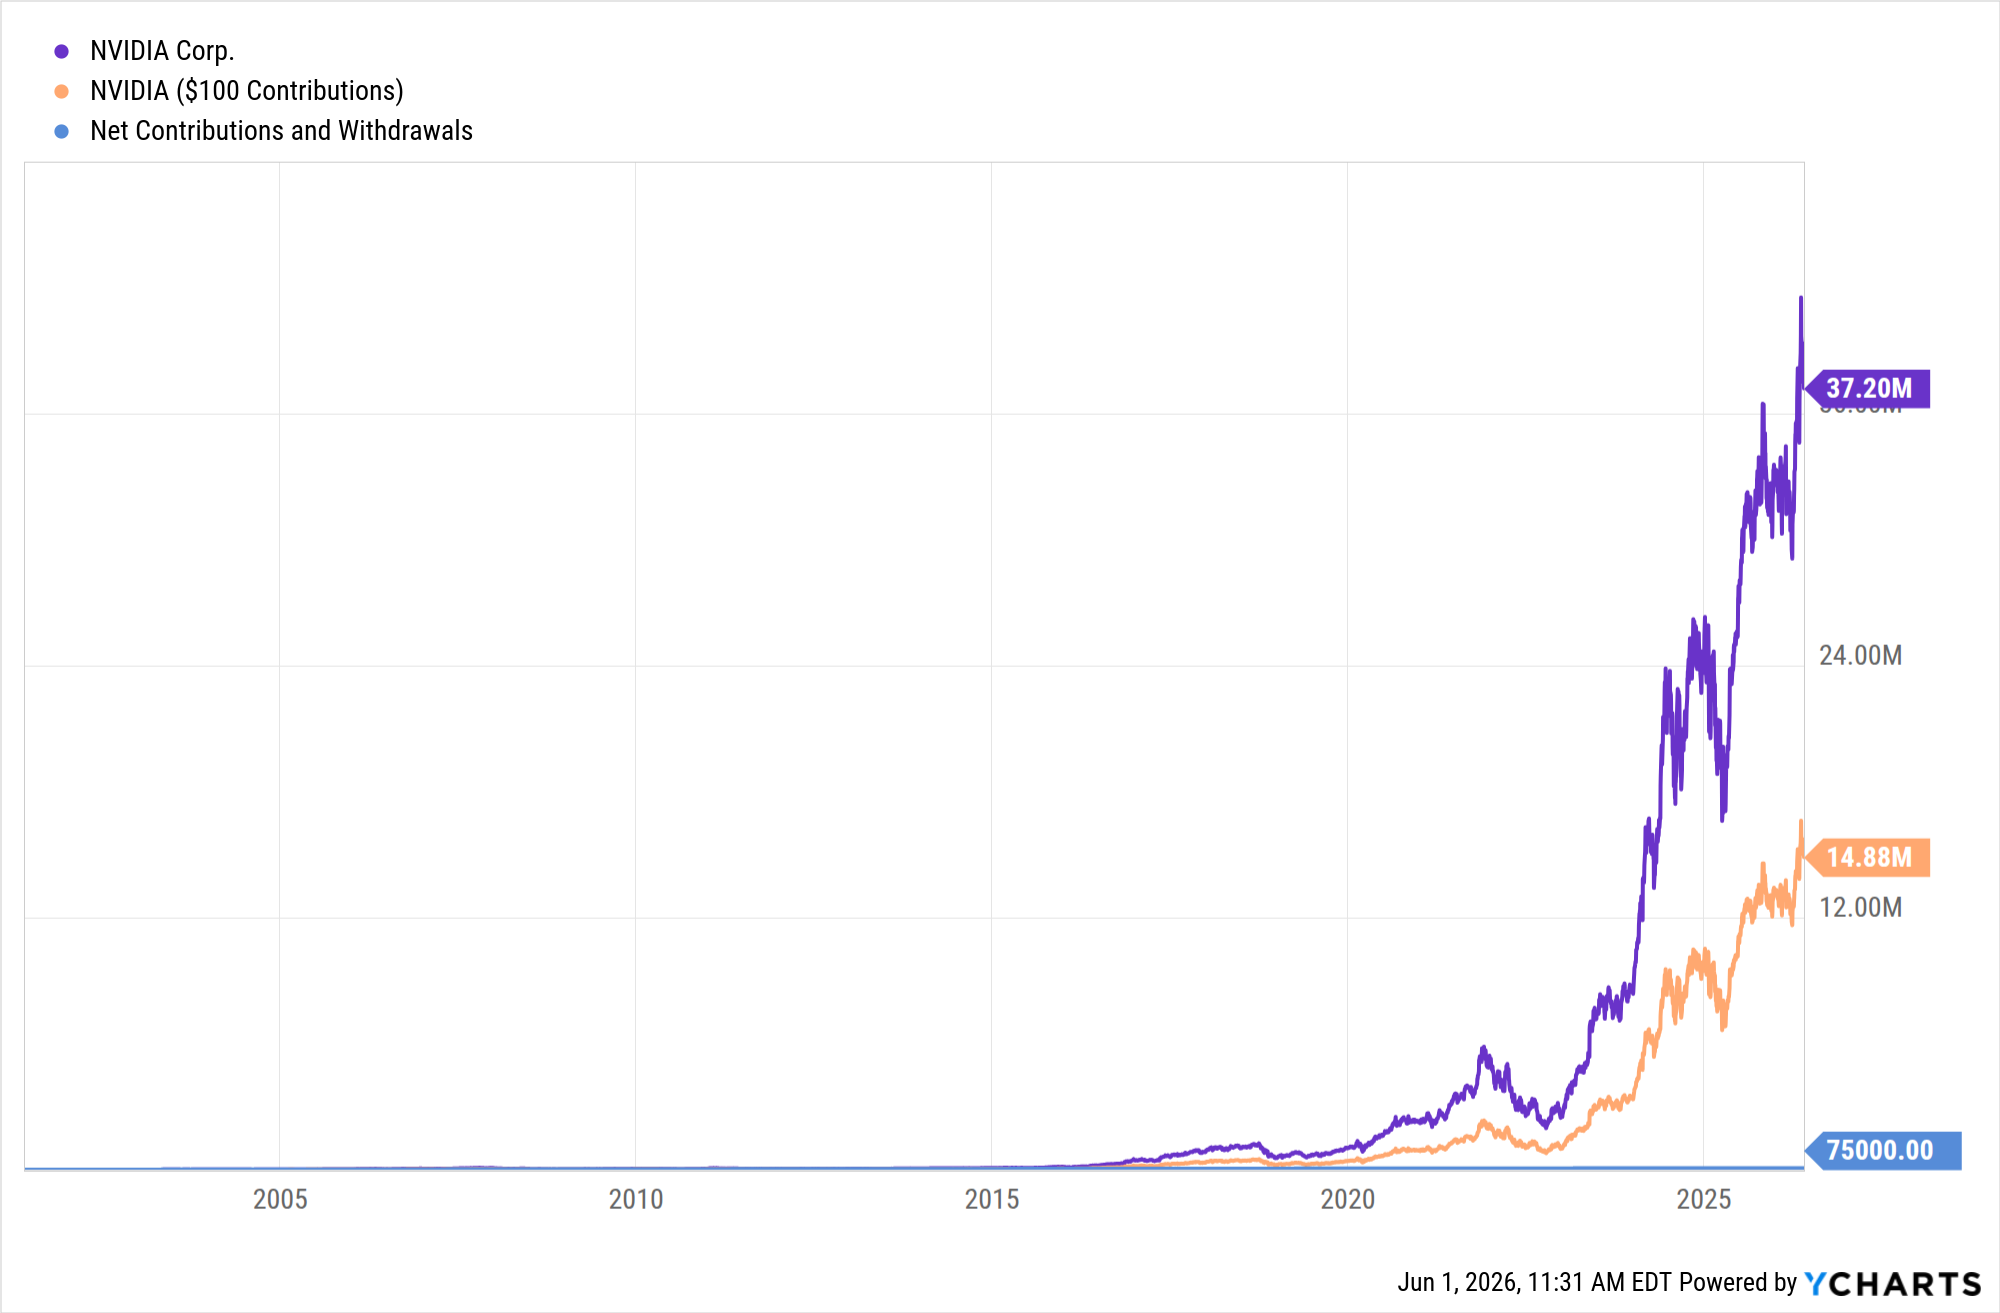
How Would Making Regular Contributions Affect Overall Returns?
Using NVIDIA (NVDA)–the world’s most valuable company and third-best performer over the last 25 years–as an example, contributing $100 each month since June 2001 would’ve equaled a net total contribution of $30,000, with a total return of $14.88 million.
If the monthly contribution was $250 each month ($75,000 total), the net balance after those 25 years would be $37.20 million today.
Download Visual | Create Your Own Scenarios
Though total returns achieved via monthly contributions over the 25 year time horizon wouldn’t have been as large as an upfront lump-sum investment, tools like Scenarios illustrate the importance of “staying the course” as an equity investment strategy to clients.
Whenever you’re ready, there are 3 ways YCharts can help you:
1. Looking for a best-in-class data & visualization tool?
Send us an email at hello@ycharts.com or call (866) 965-7552. You’ll be directly in touch with one of our Chicago-based team members.
2. Want to test out YCharts for free?
Start a no-risk 7-Day Free Trial.
3. Download a copy of The Top 10 Visuals for Client and Prospect Meetings slide deck:
Disclaimer
©2026 YCharts, Inc. All Rights Reserved. YCharts, Inc. (“YCharts”) is not registered with the U.S. Securities and Exchange Commission (or with the securities regulatory authority or body of any state or any other jurisdiction) as an investment adviser, broker-dealer or in any other capacity, and does not purport to provide investment advice or make investment recommendations. This report has been generated through application of the analytical tools and data provided through ycharts.com and is intended solely to assist you or your investment or other adviser(s) in conducting investment research. You should not construe this report as an offer to buy or sell, as a solicitation of an offer to buy or sell, or as a recommendation to buy, sell, hold or trade, any security or other financial instrument. For further information regarding your use of this report, please go to: ycharts.com/about/disclosure
Next Article
Monthly Market Wrap: April 2026Read More →