The Rise of NVIDIA in 5 Charts
Artificial intelligence has been the talk of the markets this year. NVIDIA (NVDA) has been selling the proverbial picks and shovels to the AI gold rush, resulting in the Santa Clara-based chipmaker skyrocketing 221% year-to-date.
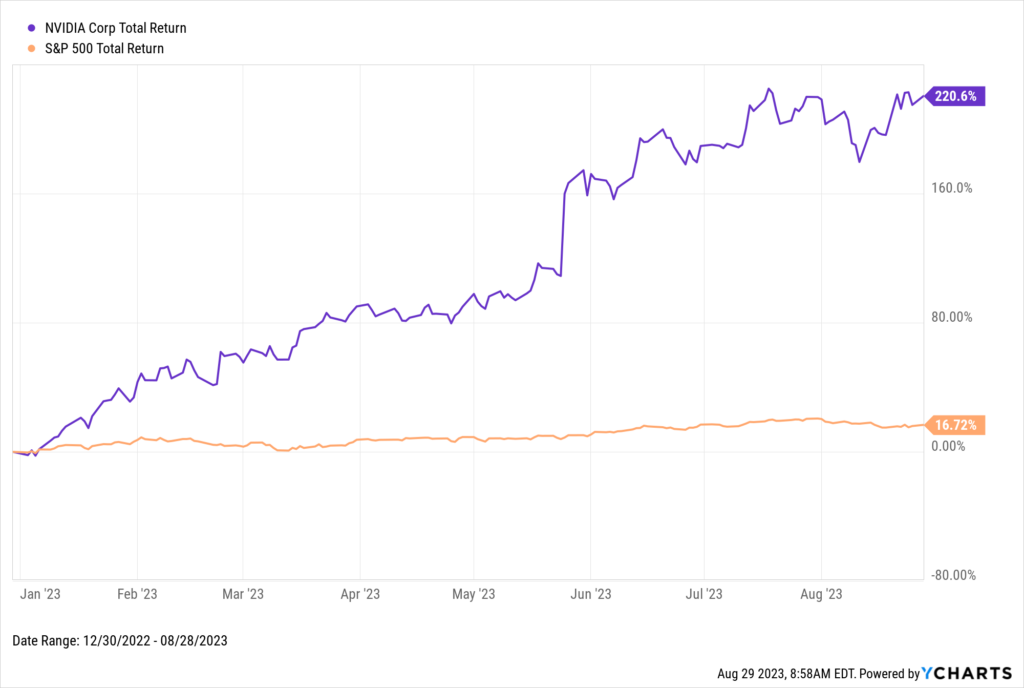
Download Visual | Modify in YCharts
After reporting earnings on August 23rd, the stock soared as much as 9% after hours following guidance that the company would increase its YoY sales by 170% in the next quarter. The guidance led to most analysts reiterating or upgrading their ratings on NVIDIA to buy, with many raising their price targets.
With even more buzz surrounding 2023’s buzziest name, here are five charts that explain NVIDIA’s journey to today:
- NVIDIA’s Growth to $1 Trillion in Market Cap
- NVIDIA’s Performance Since its IPO
- NVIDIA’s Lost Half Decade
- NVIDIA in the Last 20 Years
- What’s Driving NVIDIA’s Success today
NVIDIA’s Growth to $1 Trillion in Market Cap
In June 2023, NVIDIA joined an elite group of companies with a valuation of at least $1 trillion. After reporting its earnings, the company is now comfortably above the trillion-dollar market cap milestone and is currently the world’s 5th-largest publicly traded company.
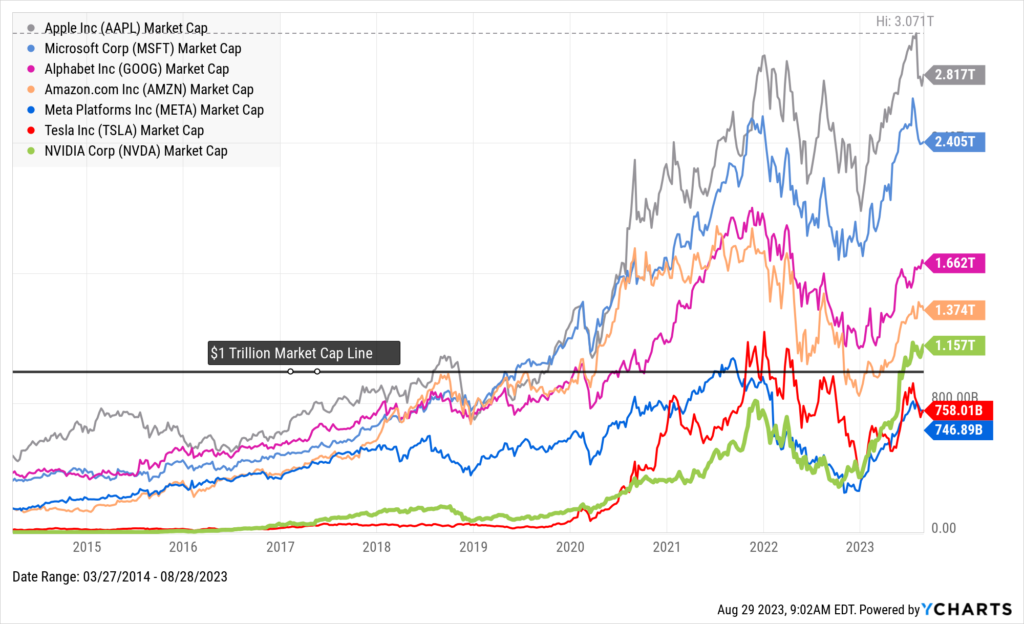
Download Visual | Modify in YCharts
NVIDIA has been at the forefront of technological advancements, specifically with graphics processing units (GPUs) for gaming and professional markets. Over the years, the company has expanded its product offerings and found a way to be a key player in new and emerging markets, such as AI and autonomous vehicles.
NVIDIA’s Performance Since its IPO
Since its IPO on January 22, 1999, NVIDIA’s total return is over 61,000%, translating into a 30% annualized return. This phenomenal growth reflects the company’s ability to innovate and adapt in a rapidly evolving technological landscape.
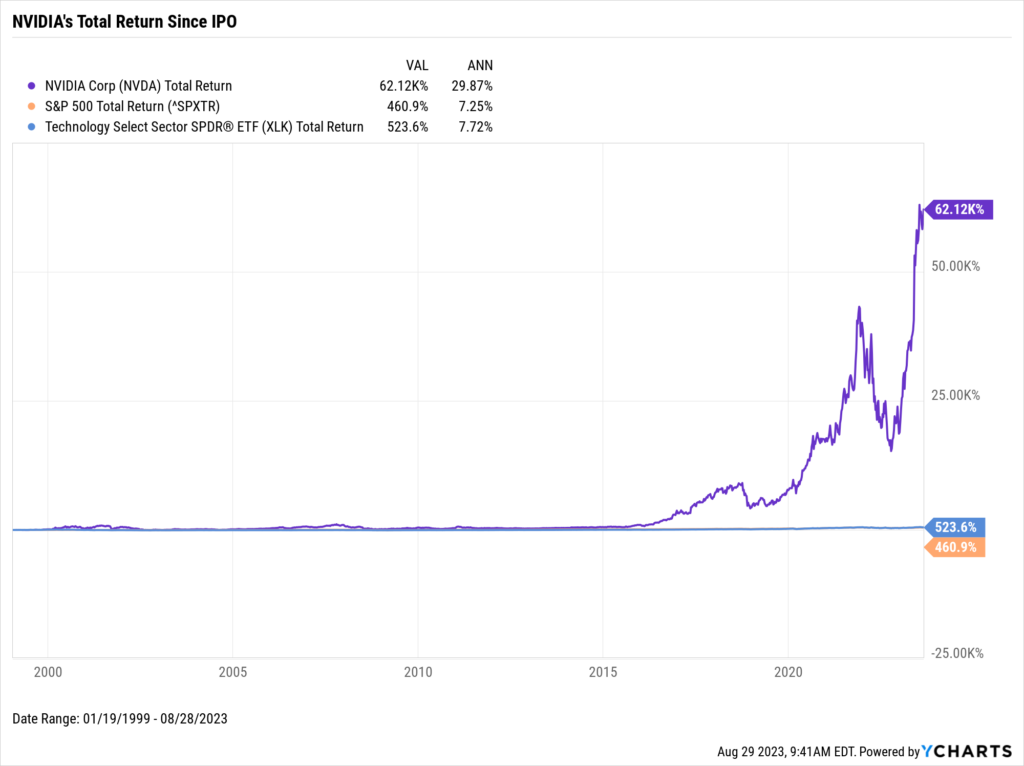
Download Visual | Modify in YCharts
NVIDIA’s Lost Half-Decade
Not everything has been up-and-to-the-right for NVIDIA. If you zoom into the company’s early days as a publicly traded company, the company suffered from a lost half-decade despite significant spikes in the early 2000s. Like many tech companies during this period, NVIDIA faced numerous challenges, including economic downturns, increased competition, and technological shifts.
Despite the technological advancements made during these years, the company struggled to translate these innovations into consistent financial gains, leading to a stagnant period for its stock price.
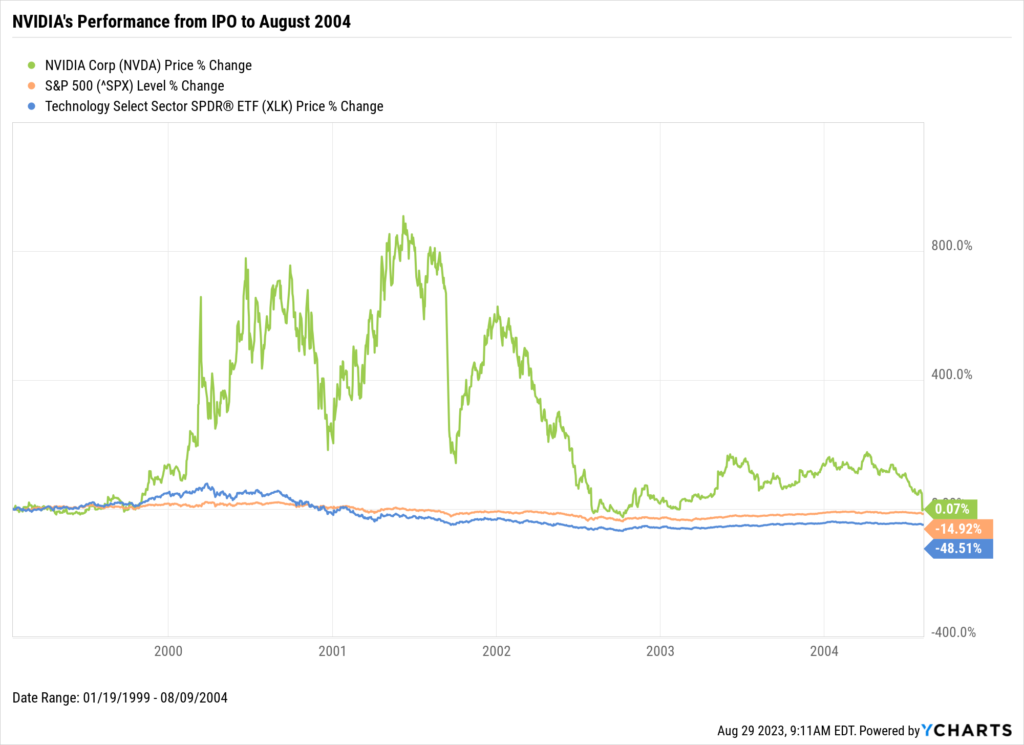
Download Visual | Modify in YCharts
NVIDIA in the Last 20 Years
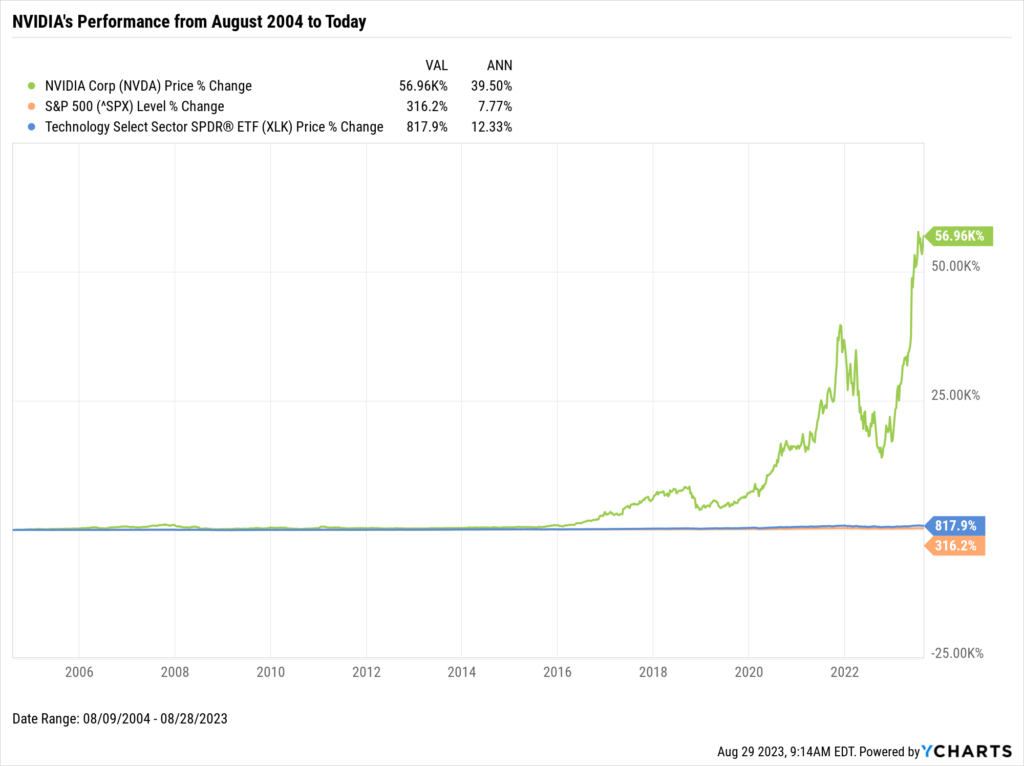
Following the ‘lost half-decade,’ the company and its investors experienced a dramatic reversal of fortune. From August 2004 to today, the company has propelled 39.5% on an annualized basis to deliver 56,930% in price change alone.
A considerable portion of these returns was accumulated in the mid-2010s when companies around the globe began conceptualizing the next iteration of the internet. This required the advanced capabilities of NVIDIA’s chips. This period marked a pivotal transition for NVIDIA as it evolved from being primarily a manufacturer of GPUs for gaming to becoming a key player in various other sectors, including AI, data centers, and autonomous vehicles.
Download Visual | Modify in YCharts
What’s Driving NVIDIA’s Success Today
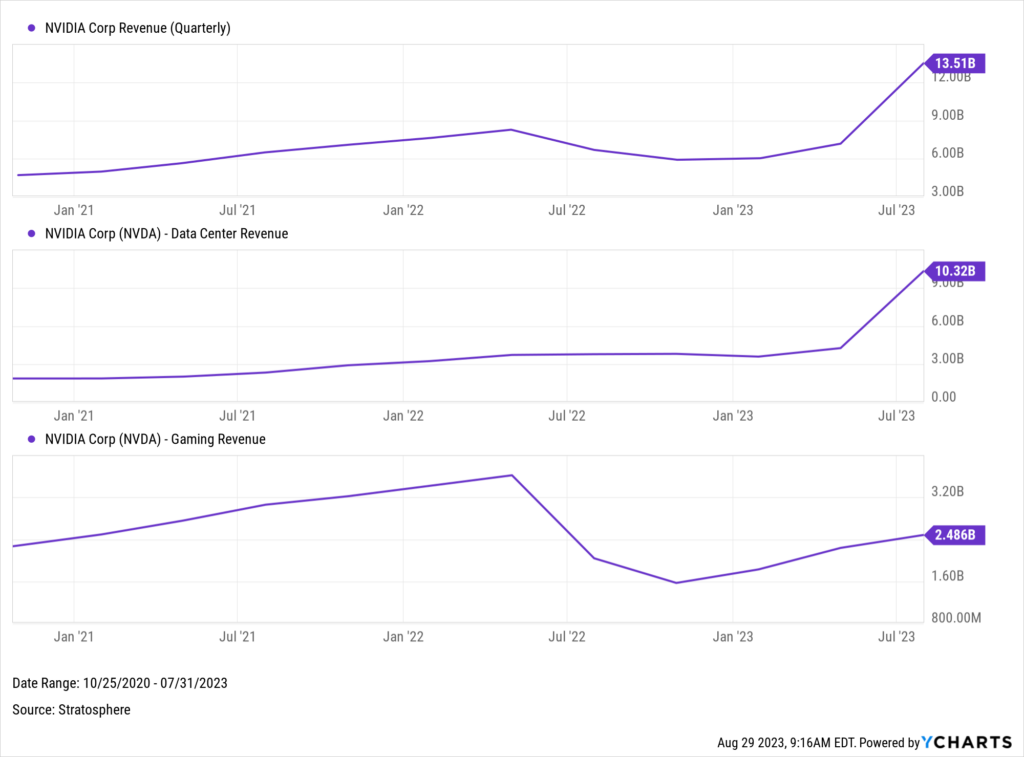
For most of NVIDIA’s history, their GPU chips were limited to gaming purposes. As of November 2021, the company’s total revenue was $7.1 billion—gaming made up 45% of it ($3.22B), while the data center segment comprised 41%.
Today, with the advent of Artificial Intelligence, the primary driver of NVIDIA’s revenue comes from the Data Center segment. Per their last earnings report, data center revenue grew to 76% of NVIDIA’s $13.5B overall top line.
Download Visual | Modify in YCharts
As more companies adopt artificial intelligence, NVIDIA’s “three-chip strategy” data center architecture is the go-to solution for AI model training. Housed within NVIDIA’s advanced data centers are a range of cutting-edge chips, including the H100, which according to NVIDIA, delivers performance that is nine times more efficient than its predecessor and is essential in building large language models (LLMs) like ChatGPT and BARD.
Use YCharts to Find Funds with NVIDIA Exposure
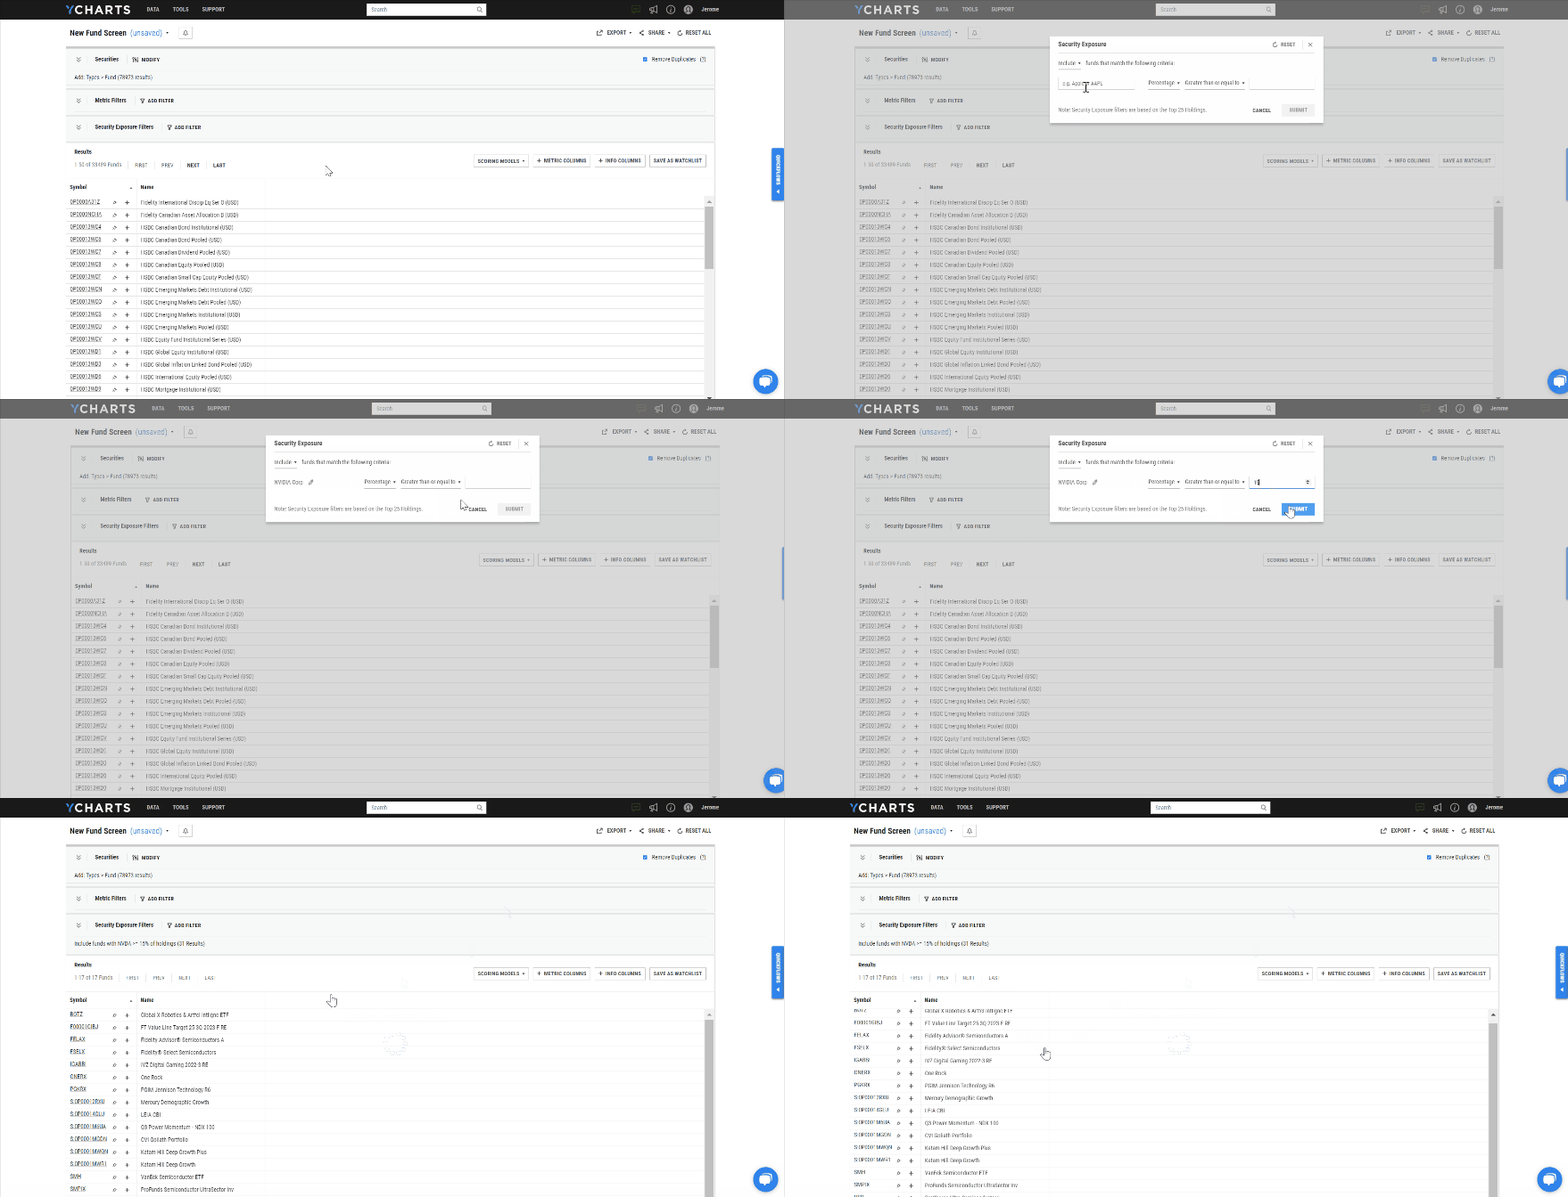
It’s no secret that NVIDIA’s performance has put several indices, index funds, and thematic funds on its back this year. You can use the YCharts Fund Screener to easily identify funds with the most NVIDIA exposure. Once in the Fund Screener, use the “Security Exposure” filter to find the funds that best satisfy your level of appetite for NVIDIA.
Connect with YCharts
To get in touch, contact YCharts via email at hello@ycharts.com or by phone at (866) 965-7552
Interested in adding YCharts to your technology stack? Sign up for a 7-Day Free Trial.
Disclaimer
©2023 YCharts, Inc. All Rights Reserved. YCharts, Inc. (“YCharts”) is not registered with the U.S. Securities and Exchange Commission (or with the securities regulatory authority or body of any state or any other jurisdiction) as an investment adviser, broker-dealer or in any other capacity, and does not purport to provide investment advice or make investment recommendations. This report has been generated through application of the analytical tools and data provided through ycharts.com and is intended solely to assist you or your investment or other adviser(s) in conducting investment research. You should not construe this report as an offer to buy or sell, as a solicitation of an offer to buy or sell, or as a recommendation to buy, sell, hold or trade, any security or other financial instrument. For further information regarding your use of this report, please go to: ycharts.com/about/disclosure
Next Article
The Magnificent Seven Stocks: Post-Q2 Earnings RecapRead More →
