The Risks & Rewards of Leaning into Mega Caps
There are over 29,000 individual stocks listed in the YCharts stock universe. But what if we told you that a typical investor portfolio has as much as one-eighth of its entire value riding on just eight companies?
Given the sheer size of the Mega Cap Stocks—those companies being Apple (AAPL), Microsoft (MSFT), Amazon (AMZN), Netflix (NFLX), Alphabet (GOOG & GOOGL), Meta Platforms (FB), Tesla (TSLA), and NVIDIA (NVDA)—it’s likely few people have avoided exposure to these companies entirely. It’s also worth begging the question, how much impact do Mega Cap Stocks have on the market and portfolio?
Our latest white paper, The Impact of Mega Cap Stocks on Portfolios and the Market, looks at how exposed a typical portfolio is to Mega Cap Stocks, the critical role these securities have played in delivering portfolio returns, and how much they’ve dictated the direction of the market in recent years.
Here, we’ll take a look at what portfolio performance, volatility, and drawdowns would have looked like if you had increased tilts toward Mega Cap Stocks. For a deeper dive into our findings and actions you can take regarding Mega Cap exposure, register for our Thursday, May 12th webinar with Michael Batnick, Director of Research at Ritholtz Wealth Management and co-host of the Animal Spirits podcast.
Download the white paper to read our full findings:
Which Mega Cap Stocks would have had the largest effect on portfolio performance and risk?
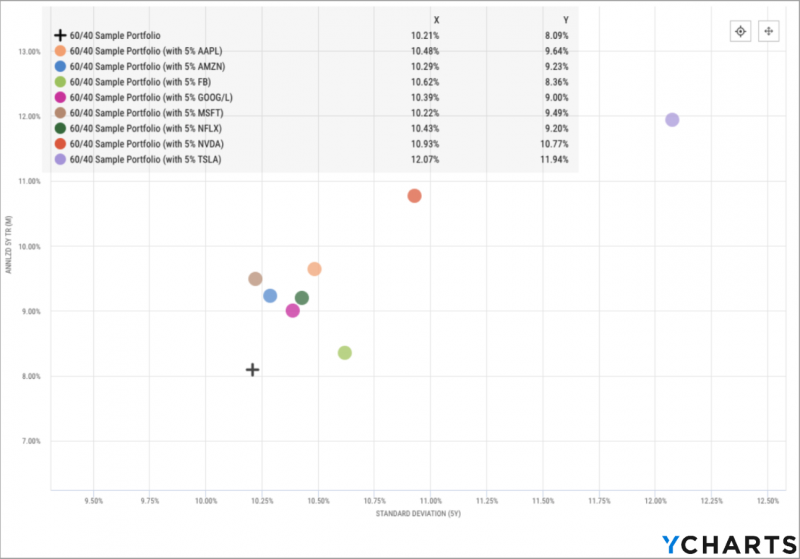
We took a sample 60/40 portfolio with an inception date of May 2012 and added an additional 5% stake to each of the Mega Cap Stocks. Through the lens of risk (x-axis) vs. reward (y-axis), shifting 5% of the equity portion—while still maintaining the 60/40 makeup—to either Microsoft (MSFT), Amazon (AMZN), Netflix (NFLX), or Alphabet (GOOG or GOOGL) would have delivered extra returns with only minimal increases to the portfolio’s standard deviation.
Download the Full Report to Learn More
• 5% additional stake in Microsoft: 140 basis points of marginal annualized return, 1 basis point of marginal annualized standard deviation
• 5% additional stake in Amazon: 114 basis points of marginal annualized return, 8 basis points of marginal annualized standard deviation
• 5% additional stake in Netflix: 111 basis points of marginal annualized return, 22 basis points of marginal annualized standard deviation
• 5% additional stake in Alphabet: 91 basis points of marginal annualized return, 18 basis points of marginal annualized standard deviation
The most high-risk, high-reward play? Tesla (TSLA). Allocating 5% to Elon Musk’s Tesla would have supercharged the typical 60/40 portfolio’s annualized returns by 385 basis points, but annualized standard deviation would have increased 186 basis points.
What would have happened if you bet the house on Mega Cap Stocks?
Just as it’s considered ill-advised to put all your chips on a single horse, most advisors warn against putting all your eggs in one basket.
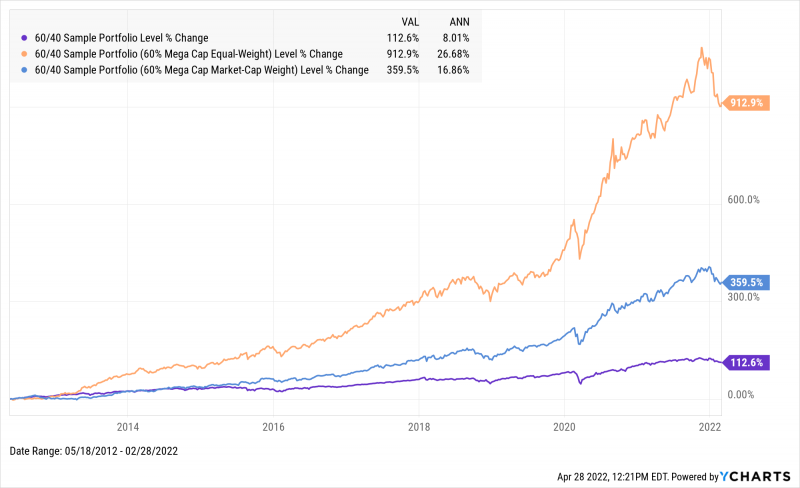
However, considering the above-average returns Mega Cap Stocks have delivered in recent years, it’s worth exploring what sort of performance and risk investors could have expected if all of their equity holdings were invested in these nine names.
Having invested the 60% equity allocation to a market-cap weighted basket of Mega Cap Stocks would have more than doubled annualized return since 2012, from 8% to 16.9%. Moving it to an equal-weight basket rebalanced on a quarterly basis would have more than tripled annualized return to 26.7%.
Download the Full Report to Learn More
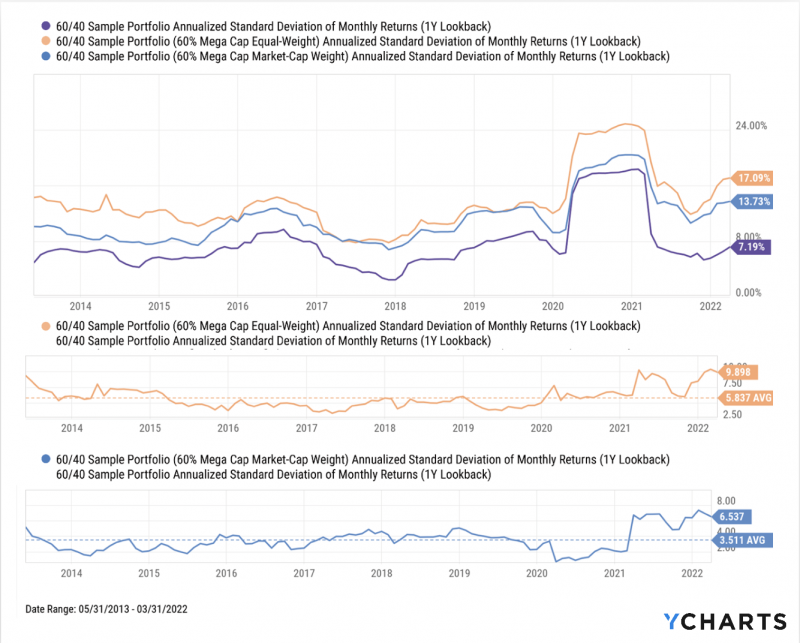
As we all know, however, reward is not easily achieved without enduring some volatility along the way. The 60/40 portfolio containing the market-cap weighted basket of Mega Cap Stocks boasted an average standard deviation 351 basis points greater than the baseline 60/40 portfolio. For the equally-weighted 60/40 portfolio, the same metric was 584 basis points higher.
Download the Full Report to Learn More
To see the full effects of Mega Cap Stocks on portfolios and the market, download the FREE white paper:
Connect with YCharts
To get in touch, contact YCharts via email at hello@ycharts.com or by phone at (866) 965-7552
Interested in adding YCharts to your technology stack? Sign up for a 7-Day Free Trial.
Disclaimer
©2022 YCharts, Inc. All Rights Reserved. YCharts, Inc. (“YCharts”) is not registered with the U.S. Securities and Exchange Commission (or with the securities regulatory authority or body of any state or any other jurisdiction) as an investment adviser, broker-dealer or in any other capacity, and does not purport to provide investment advice or make investment recommendations. This report has been generated through application of the analytical tools and data provided through ycharts.com and is intended solely to assist you or your investment or other adviser(s) in conducting investment research. You should not construe this report as an offer to buy or sell, as a solicitation of an offer to buy or sell, or as a recommendation to buy, sell, hold or trade, any security or other financial instrument. For further information regarding your use of this report, please go to: ycharts.com/about/disclosure
Next Article
How Oil and Gas Prices Impact the EconomyRead More →