Treasury Yields Edge Higher Amid Inflation Data and Tariff Concerns
Introduction: Why Treasury Yields Are Rising in February 2025
In February 2025, Treasury yields have experienced an upward trajectory as investors respond to higher-than-anticipated inflation data and concerns over proposed U.S. import tariffs. The 10-year Treasury yield, a critical benchmark for fixed-income investors, has risen to 4.56%, reflecting market adjustments to these economic indicators.
With bond market volatility on the rise, asset managers and financial advisors should consider reassessing portfolio allocations to optimize yields and manage duration risk. This article delves into the recent movements in Treasury yields, their implications for fixed-income investments, and how financial professionals can leverage YCharts’ tools to make informed decisions.
February 2025 Treasury Yield Trends: Key Takeaways
10-Year Treasury Yield: Increased to 4.56%, its highest level since late 2024.
2-Year Treasury Yield: Rose to 4.94%, maintaining an inverted yield curve, which often signals recession concerns.
Inflation Impact: January CPI data showed a 3.0% YoY increase, surpassing expectations and potentially delaying anticipated rate cuts by the Federal Reserve.
Tariff Concerns: Proposed tariffs on imports, including steel and aluminum, have introduced uncertainty regarding economic growth and inflation.
Treasury Yield Trends Over the Last 12 Months
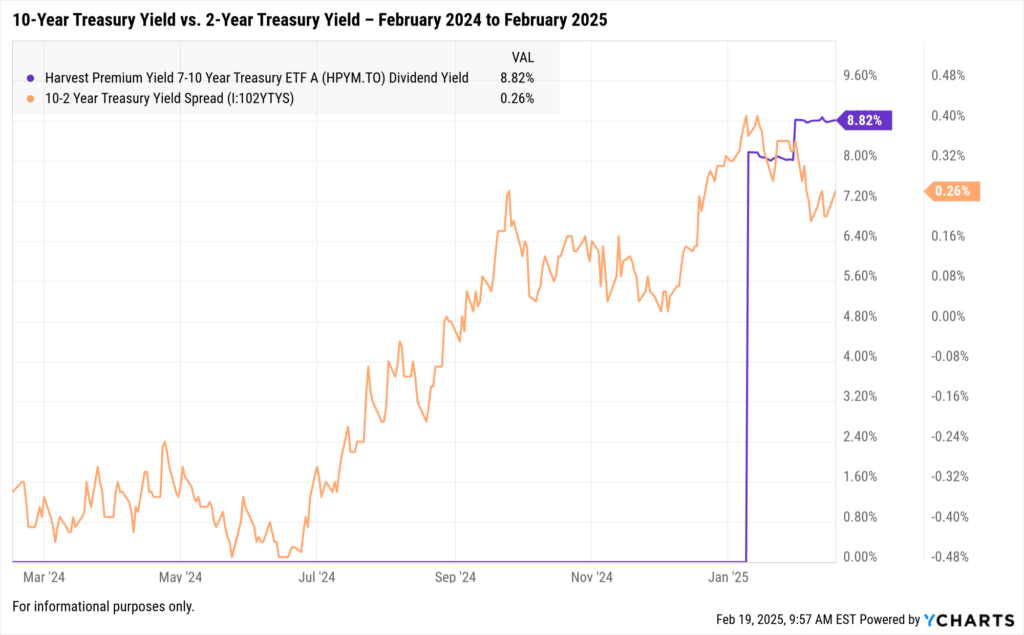
Data for 10-Year Treasury Yield and 2-Year Treasury Yield:
Initially, the 10-2 Year Treasury Yield Spread (difference between 10-Year and 2-Year yields) was negative, indicating that the 2-year yield was higher than the 10-year yield at the beginning of the period in February 2024.
The yield spread began to narrow throughout 2024 and turned positive in September 2024, suggesting an inversion had been corrected as the 10-year yield increased relative to the 2-year yield.
By the end of the period, the spread remained positive and stabilized around 0.25% to 0.31% in early 2025.
Why Treasury Yields Are Rising: Inflation & Tariff Uncertainty
1. Inflation Exceeds Expectations, Delaying Rate Cut Hopes
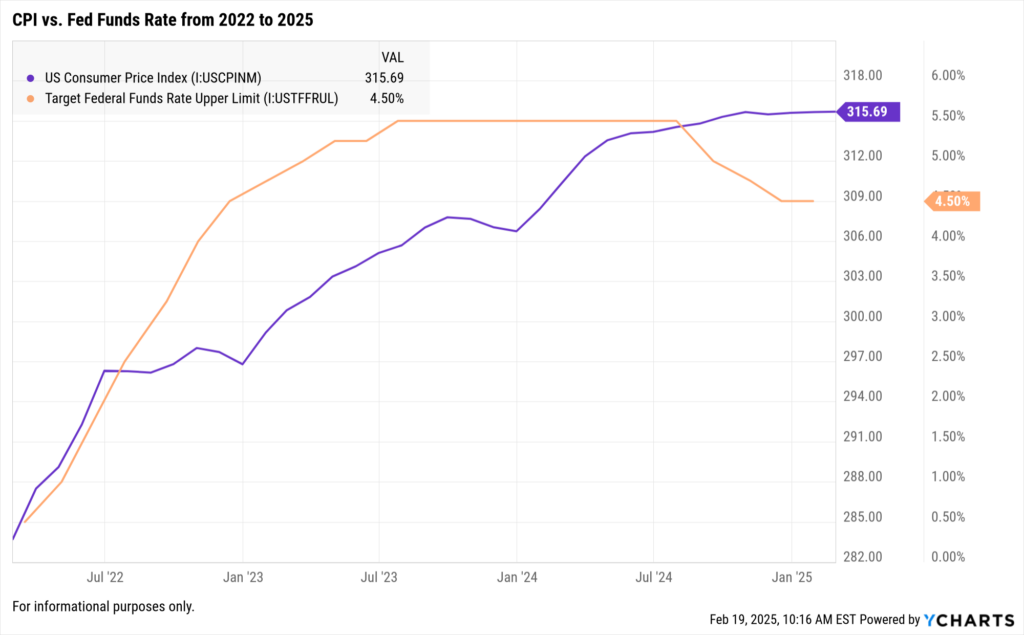
The January 2025 CPI report revealed that inflation rose by 0.5% on a seasonally adjusted basis, leading to a 3.0% year-over-year increase. This uptick in inflation suggests that the Federal Reserve may postpone any rate cuts previously anticipated for the near future.
Key Data Points:
Core CPI (excluding Food & Energy): Increased by 0.4% in January, with a 3.3% year-over-year rise, indicating persistent inflation in sectors such as shelter and services.
Shelter Costs: Rose by 0.4% month-over-month, continuing to exert upward pressure on overall inflation.
What It Means for Advisors: Fixed-income investors may want to prepare for the possibility that the Federal Reserve will maintain current interest rates longer than previously expected, especially if inflation remains above the 2% target. Short-duration bonds may offer more attractive yields with reduced interest rate risk in this environment.
Related Blog: Breaking Down the January 2025 CPI Report
2. Treasury Yields Respond to Tariff Concerns
The administration’s recent proposal to reinstate Section 232 tariffs on imports, particularly targeting steel and aluminum, has added complexity to the economic landscape.
Potential Effects on Treasuries:
Inflationary Pressures: Tariffs on imported goods can lead to higher consumer prices, contributing to sustained inflation.
Economic Growth Uncertainty: Trade tensions may dampen business investment and consumer spending, potentially slowing economic growth and increasing demand for safe-haven assets like Treasuries.
What It Means for Advisors:
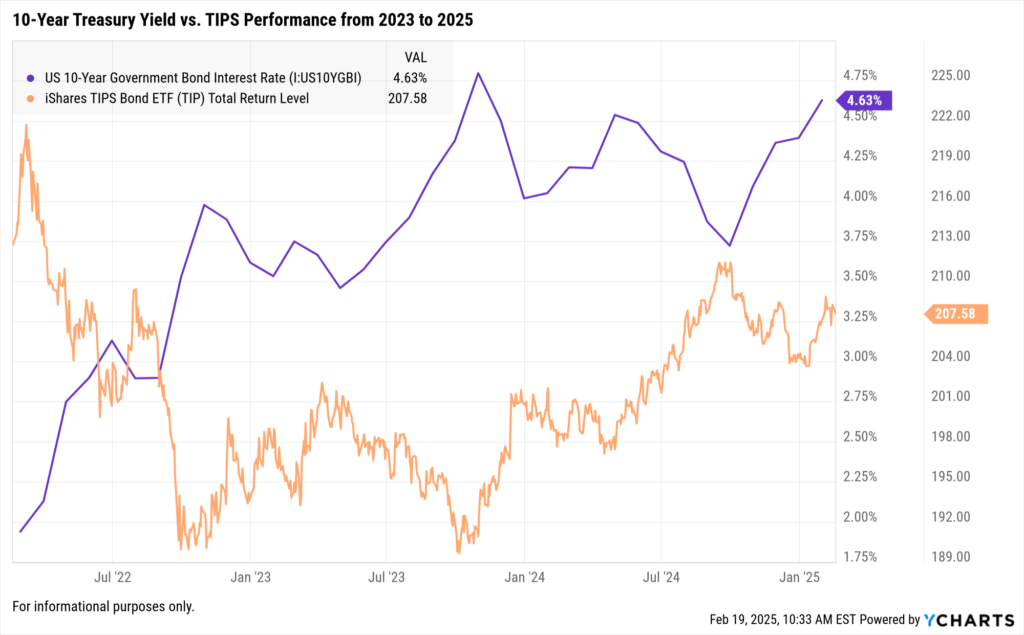
Consider Treasury Inflation-Protected Securities (TIPS): These may serve as a hedge against unexpected inflation resulting from tariff-induced price increases.
Diversify Fixed-Income Portfolios: Incorporating a mix of durations and credit qualities may help manage potential volatility in response to trade policy developments.
Strategies for Advisors & Asset Managers Amid Fixed-Income Volatility
With bond market volatility increasing, advisors may want to assess portfolio duration, yield curve positioning, and inflation hedges.
1. Adjusting Duration in a Potentially Prolonged High-Rate Environment
Short-Duration Bonds (1-3 years): These instruments may offer higher yields with less sensitivity to interest rate fluctuations, making them appealing during periods of rate uncertainty.
Laddered Bond Portfolios: This approach involves holding bonds with varying maturities, which can help mitigate reinvestment risk and provide a steady income stream.
Investment-Grade Corporate Bonds: These bonds may offer spreads above Treasuries, providing additional income potential while maintaining credit quality.
2. Incorporating Inflation-Protected Assets
With inflation risk still present, asset managers may want to incorporate assets that can maintain purchasing power:
Treasury Inflation-Protected Securities (TIPS) – Can adjust for CPI increases.
Floating-Rate Bonds – Coupon payments can rise alongside interest rates.
Commodities & Real Assets – Can hedge against prolonged price increases.
How YCharts Can Help Advisors Navigate Fixed-Income Volatility
YCharts offers a full suite of tools to track, analyze, and visualize Treasury yield movements and inflation trends.
Track Treasury Yields in Real Time
Use the YCharts Economic Indicators feature to monitor Treasury yields and interest rate movements.
Compare historical trends and shifts in Treasury yields across different rate cycles.
Analyze Fixed-Income Portfolio Exposure
Use YCharts’ Fundamental Charts to visualize yield trends and bond market performance.
Generate Client-Ready Reports
Create Custom Reports that explain yield movements and portfolio adjustments.
Use Scenario Analysis to stress-test portfolios for different interest rate environments.
Start Your Free Trial Today Ready to take control of bond market volatility? Sign up for a free trial on YCharts to track Treasury yields, analyze inflation trends, and optimize portfolio decisions.
Conclusion: Preparing for Rate Volatility in 2025
With inflation still running above target and new tariff uncertainties, Treasury yields are likely to remain volatile. Advisors may want to focus on managing duration risk, incorporating inflation-protected assets, and leveraging YCharts’ tools to make data-driven portfolio decisions.
By staying ahead of rate trends and using YCharts’ analytics, financial professionals can better navigate the evolving fixed-income landscape in 2025.
Whenever you’re ready, there are three ways YCharts can help you:
Have questions about how YCharts can help you grow AUM and prepare for meetings?
Email us at hello@ycharts.com or call (866) 965-7552. You’ll get a response from one of our Chicago-based team members.
Unlock access to all three tools by becoming a client.
Dive into YCharts with a no-obligation 7-Day Free Trial now.
Sign up for a copy of our Fund Flows Report and Visual Deck:
Disclaimer
©2025 YCharts, Inc. All Rights Reserved. YCharts, Inc. (“YCharts”) is not registered with the U.S. Securities and Exchange Commission (or with the securities regulatory authority or body of any state or any other jurisdiction) as an investment adviser, broker-dealer or in any other capacity, and does not purport to provide investment advice or make investment recommendations. This report has been generated through application of the analytical tools and data provided through ycharts.com and is intended solely to assist you or your investment or other adviser(s) in conducting investment research. You should not construe this report as an offer to buy or sell, as a solicitation of an offer to buy or sell, or as a recommendation to buy, sell, hold or trade, any security or other financial instrument. For further information regarding your use of this report, please go to: ycharts.com/about/disclosure
Next Article
Winning AUM in Active Fixed Income: 3 Tools for Distribution TeamsRead More →