Twitter, Floating Rate Bonds, Fed Rate Hikes | What’s Trending on YCharts?
What’s Trending on YCharts? pulls back the cover on YCharts data to reveal the stocks, funds, and economic indicators that people are searching for most (on both YCharts and Google).
In April 2022, trending topics included Twitter and Elon Musk’s acquisition, floating rate (or bank loan) ETFs, and several treasury yields in light of the Fed Board’s 0.50% rate hike.
To get the full scoop on everything that’s currently trending, watch here:
Hottest Company Pages
These stock data pages had the largest month-over-month unique pageview growth in April 2022, as compared to March 2022.
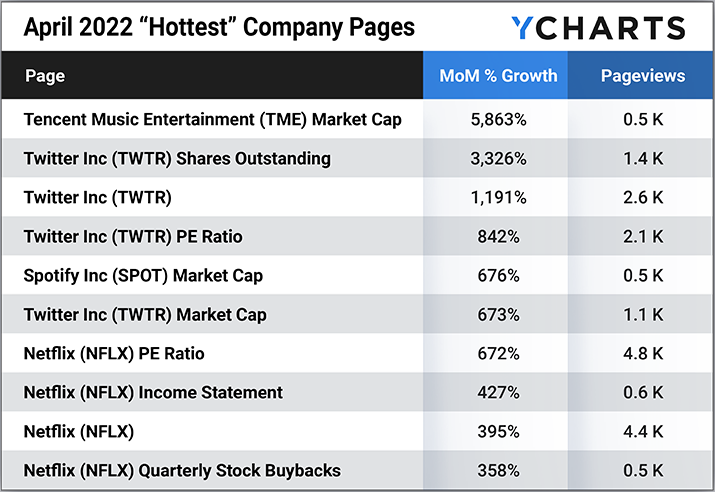
• Tencent Music Entertainment (TME) Market Cap
• Twitter Inc (TWTR) Shares Outstanding
• Spotify Inc (SPOT) Market Cap
• Twitter Inc (TWTR) Market Cap
• Netflix (NFLX) Income Statement
• Netflix (NFLX) Quarterly Stock Buybacks
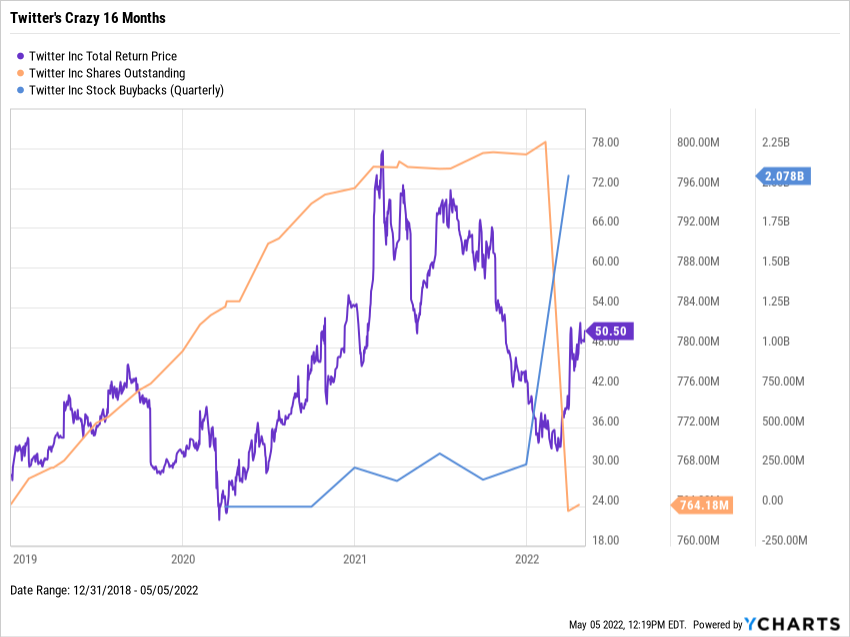
While fully acknowledging that Elon Musk’s acquisition is the biggest news currently surrounding Twitter (TWTR), the stock has been on quite the path since the start of 2021. Twitter shares set a new all-time high early in the year, drew down 30%, then mostly recovered. When management announced a $4 billion buyback plan in late 2021, shares declined in what would become a 50% slide. Around the same time, $2 billion worth of Twitter stock was repurchased by the company and Elon Musk’s takeover plans materialized. And now, Twitter’s stock price is basically right back where it started 2021. So… all of that for nothing?
Download Visual | Modify in YCharts
Hottest Fund Pages
These mutual fund and ETF pages had the largest month-over-month unique pageview growth in April 2022, as compared to March 2022.
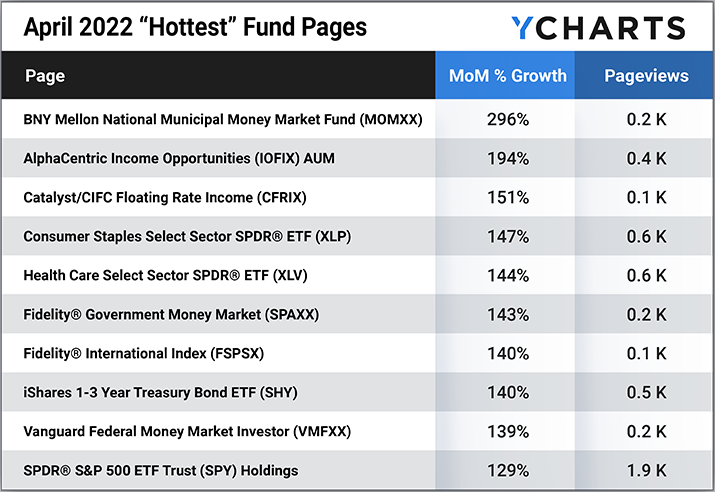
• BNY Mellon National Municipal Money Market Fund (MOMXX)
• AlphaCentric Income Opportunities (IOFIX) AUM
• Catalyst/CIFC Floating Rate Income (CFRIX)
• Consumer Staples Select Sector SPDR® ETF (XLP)
• Health Care Select Sector SPDR® ETF (XLV)
• Fidelity® Government Money Market (SPAXX)
• Fidelity® International Index (FSPSX)
• iShares 1-3 Year Treasury Bond ETF (SHY)
• Vanguard Federal Money Market Investor (VMFXX)
• SPDR® S&P 500 ETF Trust (SPY) Holdings
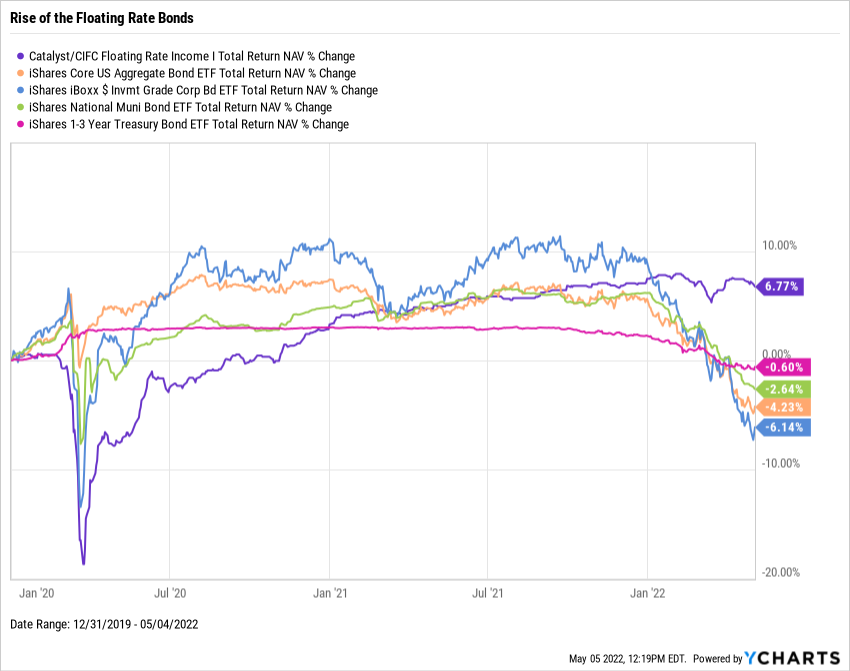
With interest rates on the rise, fixed income funds’ net asset value (NAV) returns are suffering. And this chart clearly shows why floating rate bond funds (also called bank loan funds) are so popular right now. Floating rate bonds are uniquely positioned to maintain their yield spreads while rates are rising, and they are gaining a lot of attention from yield-hungry investors.
Download Visual | Modify in YCharts
Hottest Econ Data Pages
These economic data pages had the largest month-over-month unique pageview growth in April 2022, as compared to March 2022.
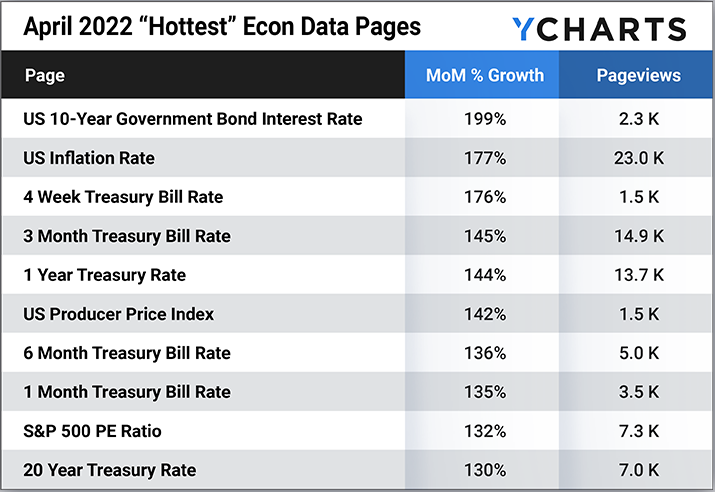
• US 10-Year Government Bond Interest Rate
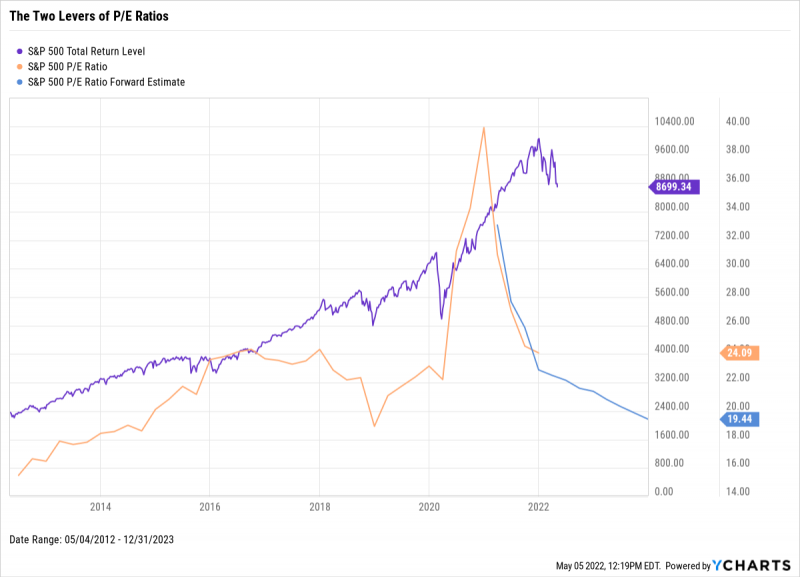
A major trend in the post-COVID-19 stock market has been the contraction, then rapid expansion of corporate earnings. This chart shows that earnings growth eventually caught up with price growth in 2021, bringing the market price-to-earnings (P/E) ratio back in line with 2018’s high. Looking ahead in 2022, as prices begin to pull back, will the S&P 500’s P/E ratio continue declining, as it’s forecasted to? And if so, will that decline be caused by further earnings expansion? Or a worsening sell-off for stocks?
Download Visual | Modify in YCharts
Connect with YCharts
To learn more, call us at (773) 231-5986, or email hello@ycharts.com.
Want to add YCharts to your technology stack? Sign up for a 7-Day Free Trial to see YCharts for yourself.
Disclaimer
©2022 YCharts, Inc. All Rights Reserved. YCharts, Inc. (“YCharts”) is not registered with the U.S. Securities and Exchange Commission (or with the securities regulatory authority or body of any state or any other jurisdiction) as an investment adviser, broker-dealer or in any other capacity, and does not purport to provide investment advice or make investment recommendations. This report has been generated through application of the analytical tools and data provided through ycharts.com and is intended solely to assist you or your investment or other adviser(s) in conducting investment research. You should not construe this report as an offer to buy or sell, as a solicitation of an offer to buy or sell, or as a recommendation to buy, sell, hold or trade, any security or other financial instrument. For further information regarding your use of this report, please go to: ycharts.com/about/disclosure.