US Index of Consumer Sentiment Monthly Update

The US Index of Consumer Sentiment is a crucial economic indicator that gauges the overall health of the economy as perceived by consumers. Compiled by the University of Michigan, this index reflects consumers’ attitudes regarding their financial situation, the overall economy, and buying conditions. Understanding this sentiment is vital for economists, businesses, and investors as it influences consumer behavior, spending, and economic policy decisions. For more detailed insights, visit the University of Michigan Surveys of Consumers page.
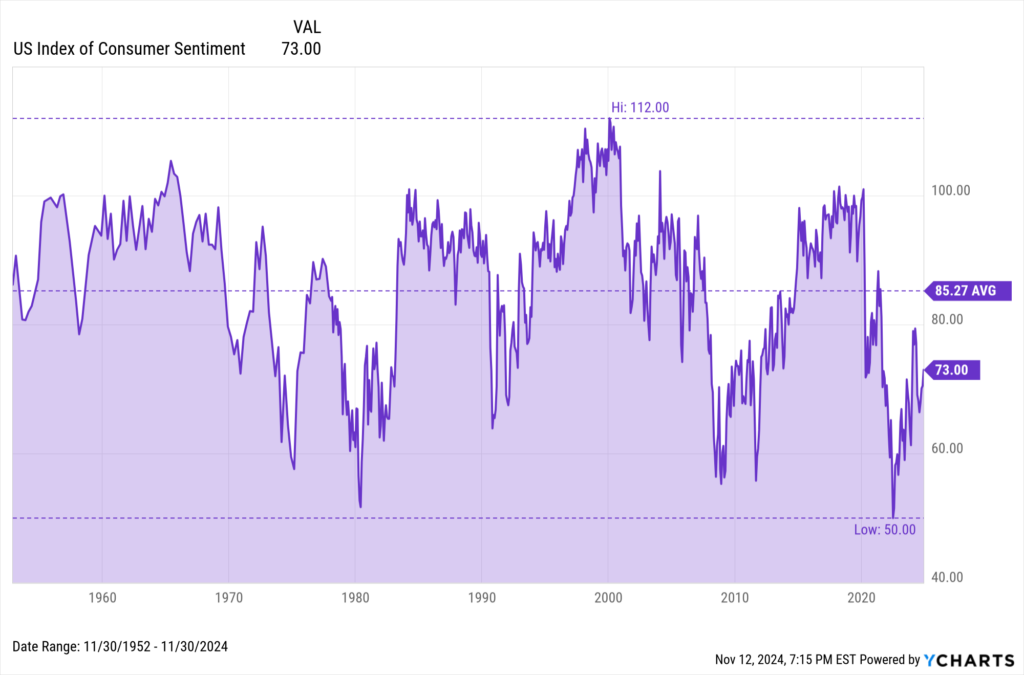
Latest Data Release
The latest report on the US Index of Consumer Sentiment was released on November 8th, 2024. According to the report, the index saw a solid increase from 70.5 in October to 73.0 in November. The chart below shows the Consumer Sentiment trend over the past year, illustrating fluctuations and providing context for the latest figures.
Download Visual | Modify in YCharts
Analysis and Insights
The University of Michigan Consumer Sentiment Index is in an upward trend since setting an all-time low of 50 in June 2022, and the 2.5 point increase in November. However, Consumer Sentiment remains below its historical long-term average of 85.27.
Per Surveys of Consumers Director Joanne Hsu, “Heading into the election, consumer sentiment improved for the fourth consecutive month, rising 3.5% to its highest reading in six months. While current conditions were little changed, the expectations index surged across all dimensions, reaching its highest reading since July 2021. Expectations over personal finances climbed 6% in part due to strengthening income prospects, and short-run business conditions soared 9% in November. Long-run business conditions increased to its most favorable reading in nearly four years. Sentiment is now nearly 50% above its June 2022 trough but remains below pre-pandemic readings.”
The index also notes that “interviews for this release concluded on Monday and thus do not capture any reactions to election results.”
Analyzing the latest Consumer Sentiment data reveals interesting trends when compared to previous months and years. Historical data shows that consumer sentiment is often a leading indicator of economic conditions. For example, declines in sentiment typically precede economic slowdowns, as cautious consumers reduce spending. Conversely, rising sentiment often signals economic recovery and increased consumer spending. Expert insights from economists suggest that the current sentiment is influenced by factors such as inflation rates, employment levels, and geopolitical tensions.
Access long-term US Index of Consumer Sentiment data on YCharts by following these simple steps:
1. Log on to YCharts.com.
2. Type “US Index of Consumer Sentiment” into the search bar from anywhere on the platform and click on the result.
3. Once on the indicator page, users can toggle the navigation bar to browse historical data on a month-by-month basis or view data in an interactive chart.
Clicking “View Full Chart” will open data in an interactive Fundamental Chart to compare against other economic indicators, such as the target Federal Funds Rate. Additionally, users can export historical data to a CSV file for offline analysis by clicking the “Export” button.
Related Financial Indicators
YCharts’ Surveys of Consumers Indicators contains several additional related indicators to the US Index of Consumer Sentiment and is conducted by the Survey Research Cneter at the University of Michigan. The surveys ask consumers questions regarding their current and future financial standings and their thoughts on the economy at the present time and in the near future. Other indicators from this survey include:
- US Current Economic Conditions Index
- US Expected Change in Inflation Rates: Next 5 Years
- US Expected Change in Inflation Rates: Next Year
- US Index of Consumer Expectations
Implications for Businesses, Investors, and Other Stakeholders
Changes in Consumer Sentiment significantly impact various groups, including businesses, investors, policymakers, consumers, and financial institutions. Understanding these implications helps each group make informed decisions and adapt strategies.
Businesses
Businesses are directly influenced by consumer sentiment as it dictates spending behavior. Increased confidence leads to higher spending, while declines may prompt caution. To navigate these shifts, businesses should focus on consumer-friendly strategies, enhance marketing efforts, and monitor sentiment closely to adjust their business models accordingly.
Investors
Investors use consumer sentiment to gauge economic health and make investment decisions. Positive sentiment indicates a bullish market, while negative sentiment suggests caution. Investors should focus on sectors tied to consumer spending during high sentiment periods, consider defensive investments, and diversify their portfolios during low sentiment.
Policymakers
Policymakers use sentiment data to shape economic policies. High sentiment encourages growth-sustaining measures, while low sentiment prompts economic stimulation. They should implement fiscal or monetary policies to boost confidence during low sentiment, ensure stability during high sentiment, and communicate policies clearly to the public.
Consumers
Consumers’ financial decisions are influenced by overall sentiment. Understanding sentiment helps individuals make better personal finance choices. During high sentiment periods, consumers can make informed spending, saving, and investment decisions, while during low sentiment, they should consider building an emergency fund or reducing discretionary spending.
Financial Institutions
Financial institutions monitor sentiment to adjust lending and credit conditions. During high sentiment, banks can expand credit to support consumer spending, while during low sentiment, they may need to tighten lending criteria. Financial institutions should also offer products tailored to consumer needs based on sentiment data.
Historical examples, such as the 2008 financial crisis, demonstrate the importance of tracking consumer sentiment to navigate the economic landscape effectively.
YCharts Feature Highlights
YCharts offers powerful tools that enhance financial analysis and decision-making. Here’s a look at how you can leverage YCharts features for monitoring and analyzing economic data, including the University of Michigan Surveys of Consumers Indicators.
Model Portfolios
YCharts’ Model Portfolios allow you to build, backtest, and compare investment strategies. This feature enables advisors to simulate different economic scenarios and automate comprehensive portfolio performance reports.
Fundamental Charts
Fundamental Charts in YCharts help visualize and analyze data. Create and customize charts to compare multiple metrics and identify trends and correlations.
Dashboards
YCharts Dashboards consolidate various charts and data points into one view. Monitor performance, track key indicators in real-time, and easily share insights with clients or colleagues.
By utilizing these YCharts features, financial advisors can make data-driven decisions, stay ahead of market trends, and provide greater value to their clients.
Custom Alerts
Stay updated with YCharts’ Custom Alerts. Set alerts for specific economic indicators or portfolio changes, and receive notifications to ensure you never miss critical updates.
Economic Indicators Library
This library provides access to a wide range of economic data. Users can track key indicators, create customizable dashboards, and analyze historical data to identify trends and make informed forecasts.
Conclusion
The latest Consumer Sentiment report provides valuable insights into the current economic landscape. The US Index of Consumer Sentiment, compiled by the University of Michigan, is a crucial economic indicator reflecting consumer attitudes toward their financial situations, the economy, and buying conditions. The latest data release on October 11, 2024, shows a slight decrease from 70.1 in September to 68.9 in October. This trend, along with historical context and expert insights, highlights the importance of monitoring consumer sentiment as it often serves as a leading indicator of economic conditions.
To arm yourself with YCharts’ extensive library of economic indicators, charting software, and analysis tools, get in touch for a personalized information session or start a free trial.
Whenever you’re ready, there are 3 ways YCharts can help you:
1. Looking to better communicate the importance of economic events to clients?
Send us an email at hello@ycharts.com or call (866) 965-7552. You’ll be directly in touch with one of our Chicago-based team members.
2. Want to test out YCharts for free?
Start a no-risk 7-Day Free Trial.
3. Download a copy of the Quarterly Economic Update slide deck:
Disclaimer
©2024 YCharts, Inc. All Rights Reserved. YCharts, Inc. (“YCharts”) is not registered with the U.S. Securities and Exchange Commission (or with the securities regulatory authority or body of any state or any other jurisdiction) as an investment adviser, broker-dealer or in any other capacity, and does not purport to provide investment advice or make investment recommendations. This report has been generated through application of the analytical tools and data provided through ycharts.com and is intended solely to assist you or your investment or other adviser(s) in conducting investment research. You should not construe this report as an offer to buy or sell, as a solicitation of an offer to buy or sell, or as a recommendation
Next Article
Effective Federal Funds Rate Monthly Update: Key Insights & AnalysisRead More →