US ISM Manufacturing PMI Monthly Update

The ISM Manufacturing Purchasing Managers’ Index (PMI) is a key economic indicator in the United States, published monthly by the Institute for Supply Management (ISM). It measures the level of business activity in the manufacturing sector based on surveys of purchasing managers at more than 300 manufacturing firms across the country. The PMI is derived from five major components: new orders, production, employment, supplier deliveries, and inventories.
A PMI reading above 50 indicates expansion in the manufacturing sector, while below 50 indicates contraction. It serves as a crucial gauge of economic health, influencing market sentiment and policy decisions.
The Institute for Supply Management’s Report On Business® is the source of Manufacturing PMI data.
Latest Data Release
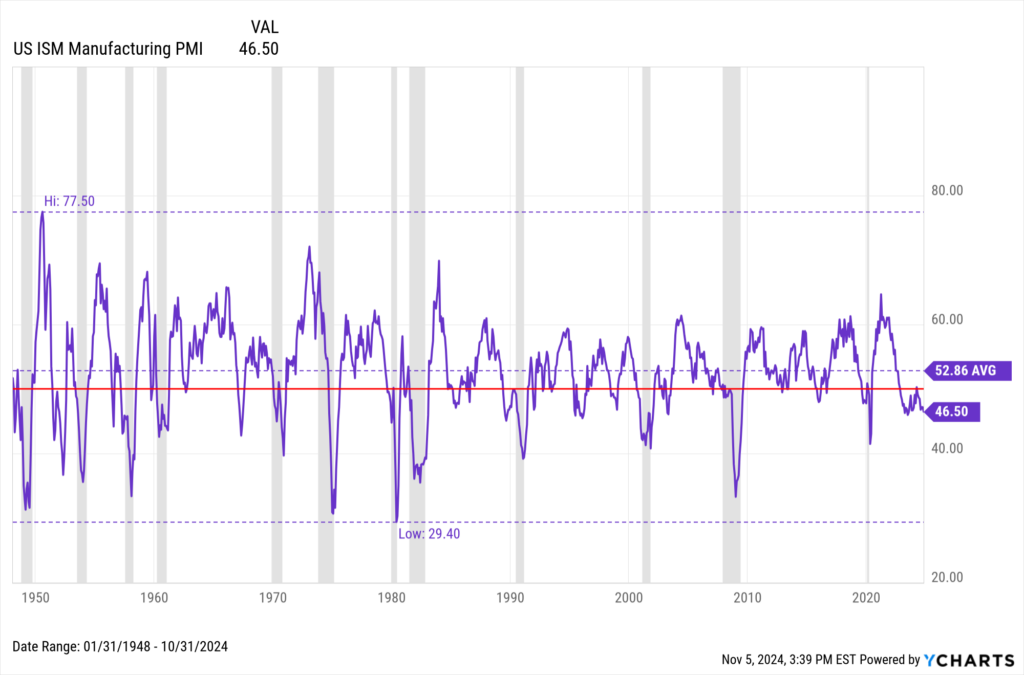
ISM released its latest weekly Manufacturing PMI data on Friday, November 1st, 2024. The ISM Manufacturing PMI is at a current level of 46.50, down from 47.20 last month and down from 46.70 one year ago. The following chart shows the PMI’s trend over time, with the red line serving as the demarcation line between expansion (over 50) and contraction (under 50) territory.
Download Visual | Modify in YCharts
Analysis and Insights
The ISM Manufacturing PMI has posted a contraction reading of below 50 for the eighth month this year and remained below its historical average of 52.87 for 27 consecutive months. While readings below 50 don’t necessarily indicate the immediate presence of a recession, recessions have historically occurred when the PMI stays below 50 for prolonged periods of time. There have been 12 U.S. recessions since 1948, and the PMI was in contraction territory during all 12 of them.
Historical ISM Manufacturing PMI data on YCharts dates back to 1948, providing a holistic view of how the U.S. manufacturing sector–and broader economy–have evolved over time. Users can create interactive charts to visualize trends and correlate them with other economic indicators. This can help in analyzing the impacts of monetary policy decisions on financial markets and the broader economy.
Access ISM Manufacturing PMI data on YCharts by following these simple steps:
- Log on to YCharts.com.
- From anywhere on the platform, type any of the following keywords: “US ISM Manufacturing PMI” into the search bar and click on the result.
- Once on the indicator page, users can toggle the navigation bar to browse historical data on a month-by-month basis or view data in an interactive chart.
Clicking “View Full Chart” will open data in an interactive Fundamental Chart to compare against other economic indicators, such as the ISM Services PMI. Recession periods can also be added to the backdrop on any chart. Additionally, users can export historical data to a CSV file for offline analysis by clicking the “Export” button.
Related Financial Indicators
YCharts’ aggregated report, ISM Manufacturing Report On Business, contains several additional indicators related to the Manufacturing PMI. Many of the indicators on YCharts are sourced directly from ISM’s reports. The indicators on YCharts’ report include:
- US ISM Services PMI
- US ISM Manufacturing Backlog Index
- US ISM Manufacturing Customer’s Inventories Index
- US ISM Manufacturing Employment Index
- US ISM Manufacturing Exports Index
- US ISM Manufacturing Imports Index
- US ISM Manufacturing Inventories Index
- US ISM Manufacturing New Orders Index
- US ISM Manufacturing Prices Paid Index
- US ISM Manufacturing Production Index
- US ISM Manufacturing Supplier Deliveries Index
Implications for Investors and Policymakers
The ISM Manufacturing Purchasing Managers’ Index (PMI) influences investment strategies and policy decisions in several ways:
Investment Strategies:
- Sector Rotation: Investors often adjust their portfolios based on PMI readings. A strong PMI indicating manufacturing expansion may lead investors to favor stocks in sectors like industrials, materials, and technology that benefit from increased production and business activity.
- Cyclical vs. Defensive Stocks: High PMI readings typically favor cyclical stocks, which are tied to economic cycles and benefit from increased consumer spending and business investment. Conversely, low PMI readings may prompt a shift towards defensive sectors like utilities and consumer staples.
- Commodities: PMI data affects commodity prices, especially industrial metals and energy products. Higher PMI readings suggesting robust manufacturing activity can boost demand for commodities, influencing commodity-related investments.
- Bond Markets: Bond yields often react to PMI data. Strong PMI readings indicating economic growth may lead to expectations of higher inflation and interest rates, prompting investors to adjust their bond portfolios accordingly.
Policy Decisions:
- Monetary Policy: Central banks, such as the Federal Reserve in the U.S., closely monitor PMI data as part of their decision-making process on interest rates. A strong PMI suggesting economic expansion might lead to expectations of tighter monetary policy to prevent overheating, influencing bond yields and currency markets.
- Fiscal Policy: Government policymakers use PMI data to assess the health of the manufacturing sector and broader economy. Strong PMI readings may support policies aimed at promoting investment and infrastructure development, while weak readings could prompt stimulus measures to spur economic activity.
- Trade Policy: PMI data provides insights into the competitiveness of domestic manufacturing industries. Policy decisions on tariffs, trade agreements, and export promotion often consider PMI trends to gauge the impact on manufacturing output and employment.
Strategic Implications:
- Long-Term Planning: Businesses use PMI data to anticipate demand trends and plan production levels, affecting corporate investment and hiring decisions.
- International Perspectives: Global investors and multinational corporations consider U.S. PMI data as part of their global strategy formulation, impacting cross-border investments and supply chain management.
Overall, the ISM Manufacturing PMI serves as a crucial indicator influencing investment strategies across sectors and guiding policy decisions at both the monetary and fiscal levels. Its impact extends beyond financial markets to shape broader economic strategies and corporate planning worldwide.
YCharts Feature Highlights
Fundamental Charts
Visualize PMI movement over time by building a Fundamental Chart. Additional economic indicators, securities, funds, and indices can be added for an enhanced visual comparison. Emphasize critical junctures with interactive annotations, static Min, Max, and Average annotation lines, as well as aesthetic modifications such as custom colors or an Area Chart.
All charts are equipped with a recession overlay feature, which provides shaded gray boxes during periods of U.S. recessions. This is especially useful for showing correlations between falling asset performance and PMI contractions during recessions.
Timeseries Analysis
Import one or several PMI indicators into Timeseries Analysis to conduct a thorough historical lookback across custom frequency periods. Data can be exported into CSV format for analysis in YCharts’ Excel Add-in or as a standalone file.
Comp Tables
Pull the Manufacturing PMI indicator in Comp Tables along with additional data points to compare movements over time, spot trends, and make informed investment decisions. Results can be exported to a CSV file or even a printable PDF for convenient, single-page analysis.
Conclusion
The ISM Manufacturing PMI is a critical tool for understanding the current and future state of the U.S. manufacturing sector, influencing investment decisions, policy-making, and broader economic forecasts. Monitoring future releases will be crucial to assess any shifts in economic conditions and potential adjustments in business strategies and policy responses.
Available on YCharts.com, the Manufacturing PMI indicator offers valuable insights into the health of the U.S. manufacturing sector and economy as a whole.
To arm yourself with YCharts’ extensive library of economic indicators, charting software, and analysis tools, get in touch for a personalized information session or start a free trial.
Whenever you’re ready, there are 3 ways YCharts can help you:
1. Looking to better communicate the importance of economic events to clients?
Send us an email at hello@ycharts.com or call (866) 965-7552. You’ll be directly in touch with one of our Chicago-based team members.
2. Want to test out YCharts for free?
Start a no-risk 7-Day Free Trial.
3. Download a copy of the Quarterly Economic Update slide deck:
Disclaimer
©2024 YCharts, Inc. All Rights Reserved. YCharts, Inc. (“YCharts”) is not registered with the U.S. Securities and Exchange Commission (or with the securities regulatory authority or body of any state or any other jurisdiction) as an investment adviser, broker-dealer or in any other capacity, and does not purport to provide investment advice or make investment recommendations. This report has been generated through application of the analytical tools and data provided through ycharts.com and is intended solely to assist you or your investment or other adviser(s) in conducting investment research. You should not construe this report as an offer to buy or sell, as a solicitation of an offer to buy or sell, or as a recommendation to buy, sell, hold or trade, any security or other financial instrument. For further information regarding your use of this report, please go to: ycharts.com/about/disclosure
Next Article
Federal Reserve Easing: Long-term Treasury Purchases UpdateRead More →