Why Treasury Yields Are Spiking and What It Means for Your Portfolio
What’s Fueling the Treasury Yield Surge – And Why Markets Are Paying Attention
U.S. bond markets are flashing red. Surging Treasury yields, dismal auction results, and an escalating national debt are stoking fears over fiscal discipline and long-term economic stability. With interest costs climbing and investor behavior shifting, financial professionals are facing a pivotal moment: re-evaluate fixed income strategy or risk being caught off guard.
So what’s driving the selloff in bonds? How should fund managers respond? And what does this environment mean for the broader economy?
In this blog, we cover:
- • The root causes of the recent bond market turmoil
- • Why Treasury yields are surging — and what’s driving investor retreat
- • The policy and macroeconomic backdrop, including the controversial tax bill
- • What fund managers and advisors need to adjust in their fixed income strategy
- • Tools on YCharts that help track, stress test, and communicate bond market impact
Recent Developments in the U.S. Bond Market and Treasury Yields
Weak Treasury Auction Triggers Yield Spike
A $16 billion auction of 20-year Treasury bonds drew the weakest demand since the pandemic. The bid-to-cover ratio fell well below historical norms, forcing the U.S. Treasury to offer higher yields just to find takers.
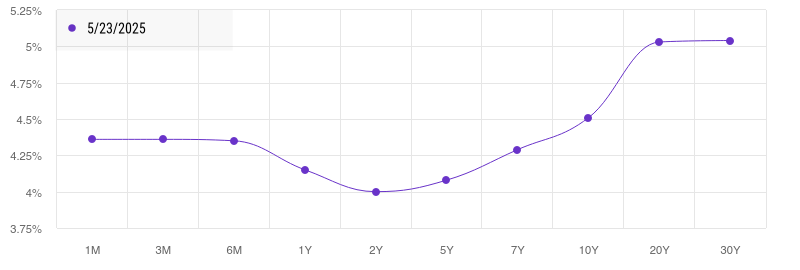
Markets responded with swift repricing. The 30-year Treasury yield breached 5%, and the 10-year Treasury yield surged above 4.5% – levels not seen consistently since the Fed’s aggressive tightening in 2023. Equity markets recoiled in response, with major indices dropping 1.5–2% in a single session, demonstrating just how intertwined bond stability is with risk assets.
Fiscal Policy: Pouring Gasoline on the Fire
Just ahead of the weak auction, the House advanced a bill to extend key provisions of the 2017 Tax Cuts and Jobs Act (TCJA), effectively making Trump-era tax cuts permanent. While proponents argue this could boost long-term GDP growth by approximately 60 basis points, the near-term fiscal impact is staggering: an estimated $3.8 trillion increase in federal debt and a $4 trillion loss in tax revenue over the next decade.
The Congressional Budget Office (CBO) still assumes a long-term interest rate of 3.6%. But we’re already above 5.1%. Each 1% increase above that assumption adds roughly $350 billion annually in interest expenses. It’s a feedback loop: more debt leads to higher yields, which increases borrowing costs, which leads to… more debt.
Investor Behavior Shifts in Response to Surging Treasury Yields
Investors aren’t waiting for the Fed to act – they’re voting with their feet. The iShares 20+ Year Treasury Bond ETF (TLT) is down roughly 3.5% year-to-date, and capital continues to rotate out of long-duration assets.
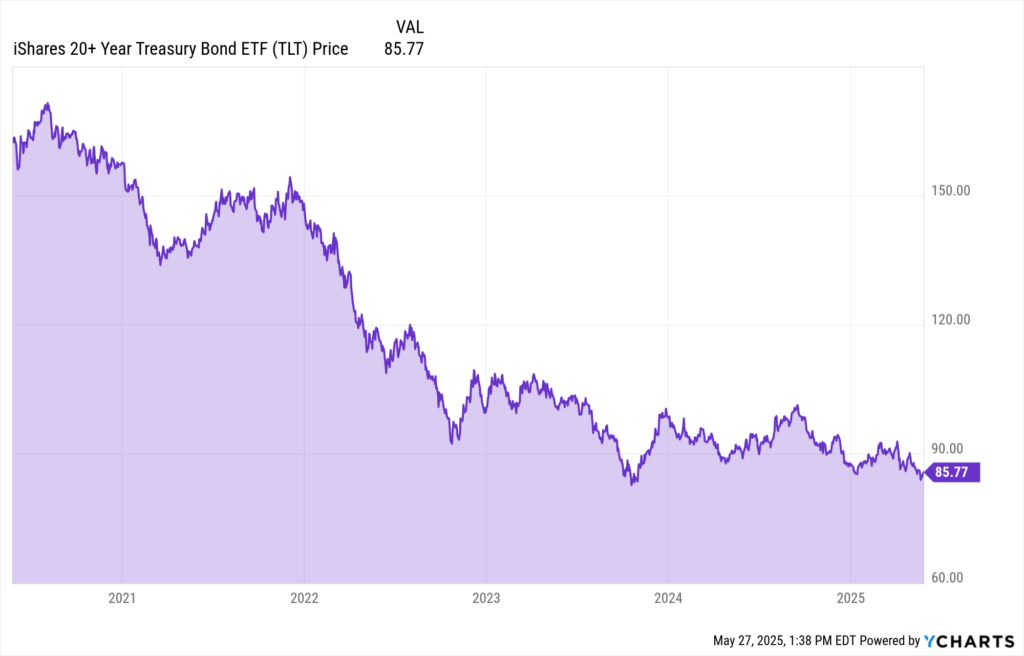
This is more than just a price reaction – it’s a behavioral shift. Institutional allocators, wealth managers, and retail investors alike are questioning the long-held assumption that Treasuries represent “safe money.” In the absence of Fed buying, and with inflation still sticky, the demand side is evaporating.
Implications for Financial Professionals
How Rising Treasury Yields Are Reshaping Portfolio Strategy
Fixed income is no longer the predictable ballast it once was. Portfolio construction must evolve:
- May want to shift toward shorter-duration instruments, such as T-Bills or floating-rate notes.
- May want to diversify exposure with Treasury Inflation-Protected Securities (TIPS), municipal bonds, or defensive credit sectors.
- Reconsider passive duration exposure in core bond funds – the index weightings may no longer reflect prudent risk management.
- Explore laddering or barbell strategies to smooth reinvestment risk and take advantage of curve steepening.
Repricing Risk Across Asset Classes
As Treasury yields approach equity earnings yields, the equity risk premium shrinks – making stocks look expensive by comparison. This compresses valuations, especially for growth and tech sectors reliant on future cash flows.
Meanwhile, cash-flowing sectors like energy, utilities, and defense are outperforming, reflecting a market preference for yield and stability. Advisors must recalibrate allocation assumptions accordingly.
Client Communication and Expectations Management
In moments of volatility, trust and transparency are paramount:
- Educate clients on why bond prices fall as yields rise.
- Demonstrate strategic shifts with scenario models that show the impact of current moves.
- Reframe bonds not as static safe havens, but as tools within an actively managed income strategy.
Global Echoes: Japan, the Yen Carry Trade, and Foreign Demand
One of the most under-discussed risks in the current market environment is foreign demand erosion – especially from Japan.
Japan, the largest foreign holder of U.S. Treasuries, just experienced its worst 40-year bond auction since the 1980s. Yields surged from 2.5% to 3.5%, and the pressure to repatriate capital is mounting. If Japanese institutions begin selling Treasuries to shore up domestic portfolios, it could trigger a reversal in the yen carry trade – where investors borrow in yen to buy higher-yielding U.S. assets.
A decline in Japanese demand, combined with weak domestic auctions, could push U.S. borrowing costs even higher, just to maintain funding operations.
From Fed-Centric to Fiscal Fragility
Perhaps the most sobering realization for market participants: this isn’t a Fed-driven cycle.
This is bond market discipline in action.
The rise in yields is not being led by central bank hikes — it’s being driven by supply-demand imbalances, fiscal policy missteps, and waning investor confidence in U.S. debt sustainability.
Key implications:
- • Fiscal policy has overtaken monetary policy as the key driver of bond prices.
- • The Fed may be forced into market operations (such as QE or balance sheet extensions) not to fight inflation — but to restore basic Treasury market function.
- • This marks a return to market-based price discovery. And with it comes volatility.
Leveraging YCharts to Navigate Bond Market Risk
YCharts offers a suite of tools that help advisors analyze, visualize, and respond to this complex fixed income environment:
1. Yield Curve Tool
• Visualize the shape of the U.S. Treasury yield curve across multiple timeframes.
• Compare today’s curve with historical curves to identify steepening, flattening, or inversion trends.
• Use curve shifts to inform rate expectations, recession risk, and duration positioning.
2. Fundamental Charts
- • Track real-time and historical yields across Treasury maturities.
- • Compare fixed income ETFs, corporate bond indices, and benchmark rates.
- • Visualize trends and reversals in bond market behavior to guide allocation changes.
3. Scenarios & Stress Testing
- • Model the impact of rising rates on portfolios heavy in duration or credit exposure.
- • Build custom scenarios — inflation surge, recession shock, liquidity crunch — to stress test resilience.
- • Use YCharts’ Scenario Tool to model parallel or non-parallel shifts in the yield curve.
4. BD-Approved Reports & Client Communication
- • Generate branded, compliance-friendly reports that explain market shifts.
- • Integrate visuals from your YCharts dashboard directly into PDF reports.
- • Use reports to reassure clients with transparent, data-backed portfolio decisions.
Final Thoughts: No Room for Complacency
The bond market is not just signaling concern – it’s issuing a warning.
For over a decade, advisors operated in a low-yield environment where fixed income offered stability. That era is over. What’s emerging is a structurally different landscape, where fiscal decisions, geopolitical shifts, and global supply-demand dynamics will dictate bond pricing more than central bank guidance.
In this new regime:
- • Reassess bond holdings with a focus on flexibility and liquidity.
- • Avoid overexposure to long-duration risk unless hedged or actively managed.
- • Lean into analytical tools to separate short-term noise from long-term shifts.
The margin for error is gone. Adaptation is no longer optional – it’s the strategy.
Whenever you’re ready, here’s how YCharts can help you:
1. Looking to Move On From Your Investment Research and Analytics Platform?
2. Want to test out YCharts for free?
Start a no-risk 7-Day Free Trial.
3. Sign up for a copy of our Fund Flows Report and Visual Deck to stay on top of ETF trends:
Sign up to recieve a copy of our monthly Fund Flows Report:Disclaimer
©2025 YCharts, Inc. All Rights Reserved. YCharts, Inc. (“YCharts”) is not registered with the U.S. Securities and Exchange Commission (or with the securities regulatory authority or body of any state or any other jurisdiction) as an investment adviser, broker-dealer or in any other capacity, and does not purport to provide investment advice or make investment recommendations. This report has been generated through application of the analytical tools and data provided through ycharts.com and is intended solely to assist you or your investment or other adviser(s) in conducting investment research. You should not construe this report as an offer to buy or sell, as a solicitation of an offer to buy or sell, or as a recommendation to buy, sell, hold or trade, any security or other financial instrument. For further information regarding your use of this report, please go to: ycharts.com/about/disclosure.
Next Article
April 2025 Fund Flows: Where Money Moved During Market MayhemRead More →