Trade War Escalation in 2025: Portfolio Moves Amid Trump’s Tariff Threats
In early June 2025, the global financial landscape experienced significant upheaval following the United States’ announcement of escalated trade war policies. President Trump’s decision to double tariffs on steel and aluminum imports to a staggering 50% marks an aggressive intensification of protectionist policies, introducing new complexities for financial advisors and asset managers striving to navigate volatile market conditions. These tariffs significantly affect industries, consumer prices, and global supply chains. For detailed insights into industry impacts, see our analysis on Tariff Shock: Top S&P 500 Winners and Losers.
Understanding the New Tariff Landscape: Beyond the Headlines
The recent tariff increases carry substantial implications requiring deeper analysis beyond initial market reactions.
Direct Cost Burden on Domestic Industries
Industries like automotive, aerospace, and manufacturing face increased input costs directly linked to the new tariffs. Companies must strategically manage these costs, either absorbing them or passing them on to consumers. The broader economic impact of this scenario is explored comprehensively in our recent Economic Update: Reviewing Q1 2024.
Intensified Global Retaliation
Major trading partners such as the European Union and China swiftly opposed these tariffs, potentially initiating retaliatory measures against U.S. exports. This cycle of retaliation adds considerable geopolitical risk, heightening the importance of understanding market trends through economic indicators.
Heightened Market Volatility and Uncertainty
Tariffs introduce uncertainty in industries with international supply chains or significant export exposure, resulting in increased volatility. Advisors must proactively monitor market fluctuations closely, using comprehensive economic data and insights.
Strategic Portfolio Adjustments: Adapting to the Tariff Environment
To navigate this environment effectively, consider these portfolio strategies:
Sector Rotation for Resilience
Heavily impacted sectors—such as manufacturing and construction—face significant headwinds. Advisors might shift towards sectors less affected by tariffs, like healthcare and technology. Explore detailed strategic sector allocation recommendations in our guide, Sector Rotation Strategy: Where to Allocate Capital in 2025.
Strategic Diversification: Beyond Domestic Borders
Diversification into international markets less impacted by U.S. tariffs can mitigate domestic risk. Investors should consider geographical and currency diversification, as outlined in our analysis of effective hedging methods in 7 Best Asset Classes to Hedge Against Inflation.
Calculated Commodity Exposure
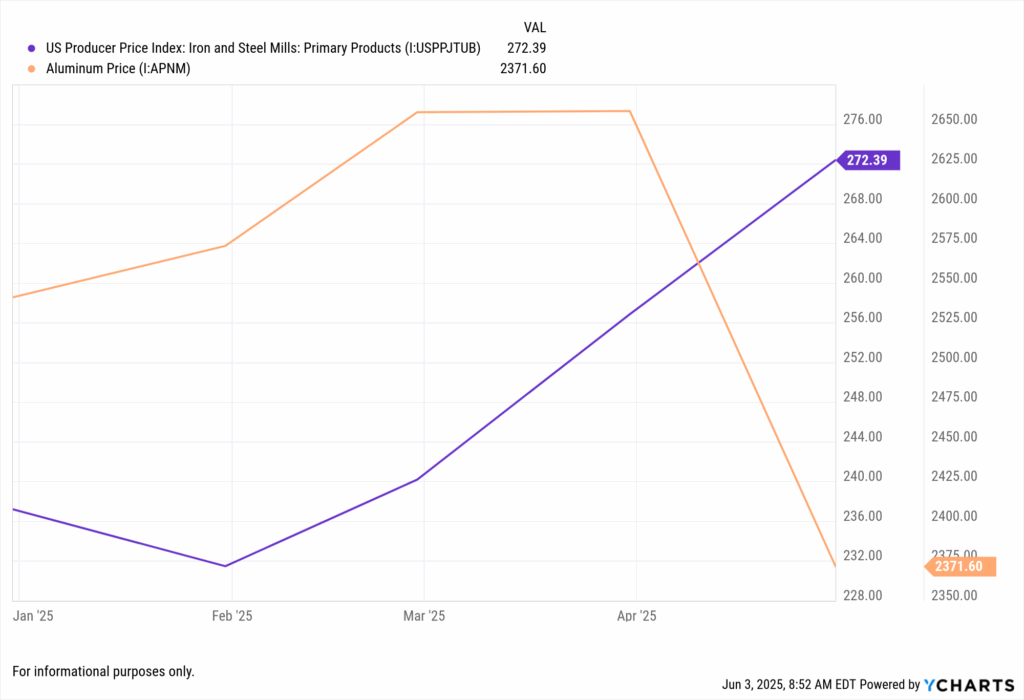
The volatility in steel and aluminum markets presents unique investment opportunities. Financial professionals might consider using commodity ETFs or metals-focused investments as inflation hedges. Our recent post, A Closer Look at April 2024 Fund Flows, offers further insights into commodity-related fund strategies.
Fixed Income Reassessment for Rate and Credit Risk
Rising inflation due to tariffs could lead to increased interest rates, necessitating adjustments in fixed income holdings—particularly duration and credit quality. For an in-depth look at fixed-income market reactions, read who is leading the charge in Active Fixed-Income ETFs.
Leveraging YCharts for Informed Decisions
YCharts equips financial advisors with powerful analytical tools necessary to address tariff-induced volatility.
Economic Indicators Monitoring
Advisors can effectively monitor critical economic indicators—like Manufacturing PMI, Producer Price Index, and consumer confidence—to assess tariff impacts. Our article, Understanding Economic Indicators with YCharts, provides a comprehensive guide on leveraging these metrics effectively.
Sector & Industry Analysis
YCharts’ sector analysis capabilities help advisors quickly identify trends and investment opportunities in tariff-impacted markets. Our recent guide on Maximizing Returns Through Portfolio Optimization shows how advisors can effectively leverage sector data to enhance portfolio outcomes.
Company-Specific Deep Dive
Evaluate company-level exposure through critical metrics such as Gross Profit Margin and Inventory Turnover, readily accessible via YCharts’ Fundamental Charts. Advisors looking to streamline such analyses can reference Simplifying Portfolio Transitions with YCharts to ensure efficient portfolio adjustments.
Conclusion: Agility and Data-Driven Strategy in a Tariff-Driven Market
The 2025 escalation of the trade war underscores the importance of agile, data-driven strategies in portfolio management. Advisors can leverage YCharts to navigate these complexities, strategically adjusting portfolios and capitalizing on emerging market opportunities amidst heightened trade tensions.
Whenever you’re ready, here’s how YCharts can help you:
1. Looking to Move On From Your Investment Research and Analytics Platform?
2. Want to test out YCharts for free?
Start a no-risk 7-Day Free Trial.
Disclaimer
©2025 YCharts, Inc. All Rights Reserved. YCharts, Inc. (“YCharts”) is not registered with the U.S. Securities and Exchange Commission (or with the securities regulatory authority or body of any state or any other jurisdiction) as an investment adviser, broker-dealer or in any other capacity, and does not purport to provide investment advice or make investment recommendations. This report has been generated through application of the analytical tools and data provided through ycharts.com and is intended solely to assist you or your investment or other adviser(s) in conducting investment research. You should not construe this report as an offer to buy or sell, as a solicitation of an offer to buy or sell, or as a recommendation to buy, sell, hold or trade, any security or other financial instrument. For further information regarding your use of this report, please go to: ycharts.com/about/disclosure
Next Article
Monthly Market Wrap: May 2025Read More →