Year-End Tax Planning That Turns Success Into Client Readiness
- Anticipate capital gains distributions and reduce year-end tax planning surprises with Cap Gains Valet.
- Identify tax-loss harvesting opportunities across client portfolios and reframe underperformance as planning value.
- Use Transition Analysis and Scenarios to guide tax-efficient reallocations and visualize long-term outcomes.
Interested in testing out YCharts for free? Start a no-risk
As 2025 winds down, clients are closing the year with strong portfolio gains and looming tax implications. Capital gains, fund distributions, and late-year moves will shape their 2026 tax bills. That’s why year-end planning matters: protecting what’s earned, avoiding surprises, and positioning portfolios for the year ahead.
Table of Contents
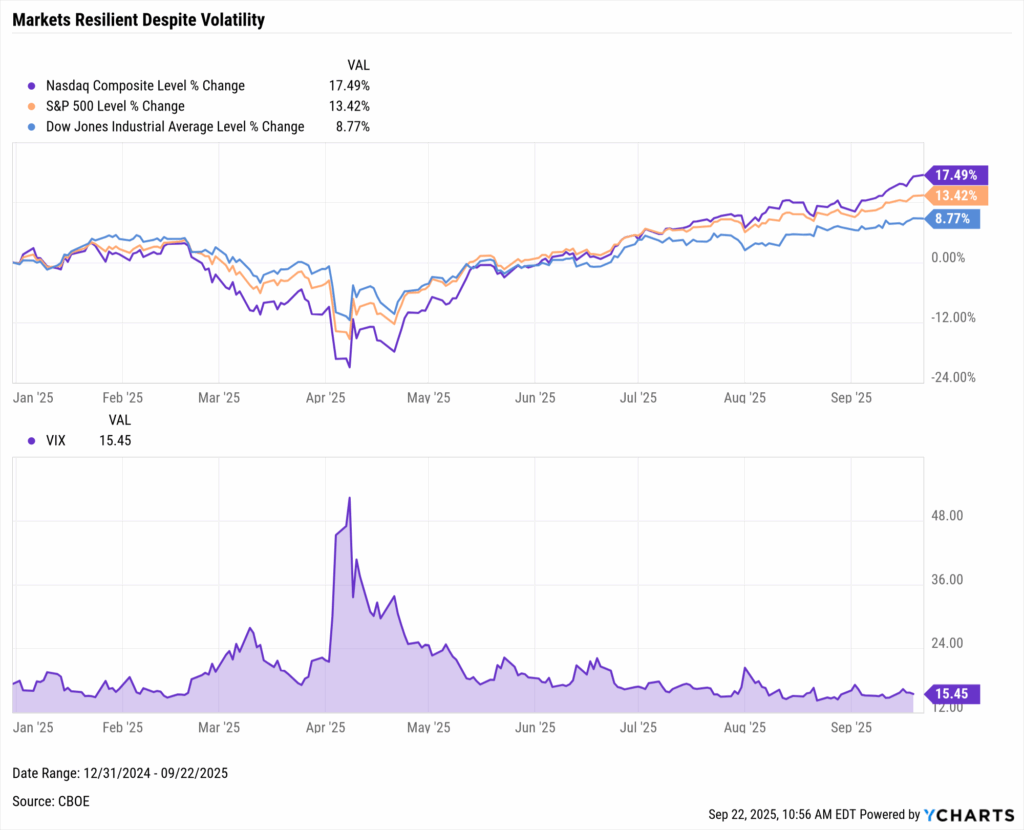
Markets Prove Resilient Amid Volatility
Through the first three quarters of 2025, U.S. equities have delivered another year of strong performance. As of late September, the Nasdaq is up nearly 17.5%, the S&P 500 has gained 13.4%, and the Dow has advanced 8.8%.
This trajectory has not been smooth. April’s “Liberation Day” tariffs triggered the steepest drawdown of the year and sent the VIX to its peak. As tariffs were partially paused, markets clawed back, but uncertainty remained high through early summer.
Download Visual | Modify in YCharts
Confidence improved in July as corporate earnings delivered one of the strongest second quarters in years. September then brought a turning point when the Federal Reserve cut rates by 25 basis points and forecast two additional cuts before year-end.
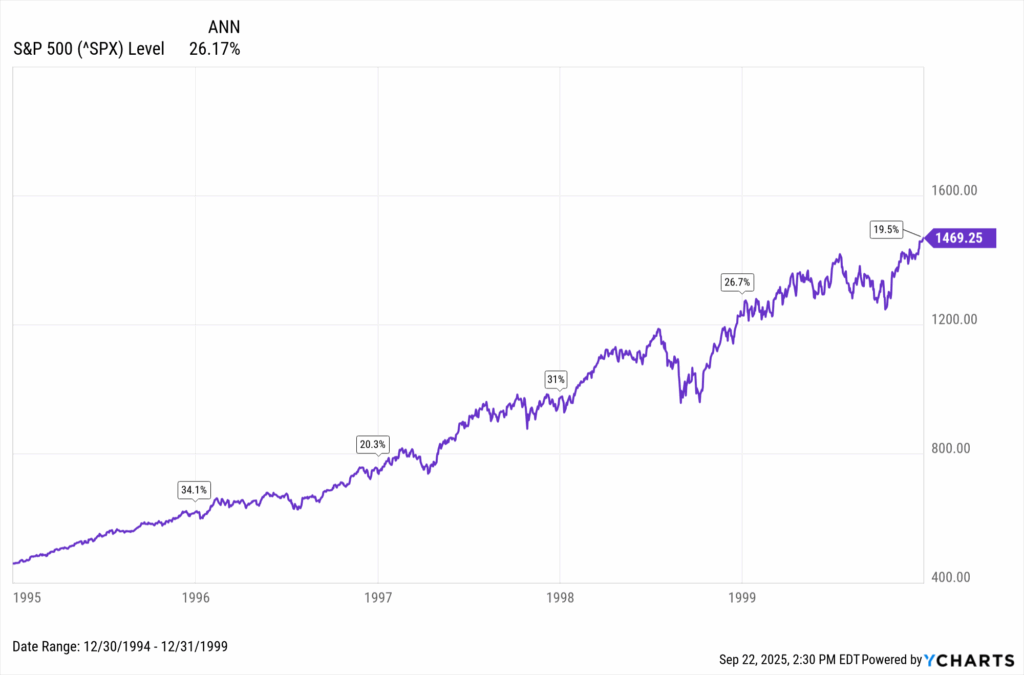
The S&P 500 is on pace to finish 2025 near its third consecutive year of 20 percent gains, something not seen in three decades. The last comparable stretch came from 1995 to 1999, when the index finished just half a percentage point shy of five straight years at that level.
Download Visual | Modify in YCharts
Looking for more strategies? Check out the latest YCharts University session, 3 Year-End Tax Moves to Prioritize This Fall, for practical ideas you can implement with clients today.
Turn Gains to Guidance
Strong market returns are worth celebrating, but they also create an immediate layer of complexity. Gains realized in 2025 will become liabilities in 2026, and waiting until April leaves little room to manage them.
This is why year-end reviews matter. They give advisors the chance to address distributions, harvest losses, and plan transitions before tax bills are finalized. Acting now turns portfolio success into forward-looking guidance that reduces surprises for clients.
Identify Sources of Tax Liability
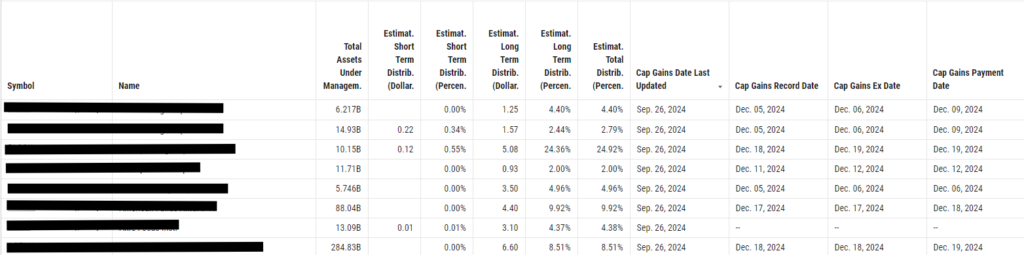
In a year of strong market gains, the biggest surprise for many clients is the tax bill that follows. Even without trading, mutual funds and ETFs often pass capital gains distributions to investors as taxable events.
Clients hate surprise distributions. Cap Gains Valet projects fund distributions in advance by breaking them down by income, short-term, and long-term gains, so you prepare clients early instead of reacting in April.
Quickflows make those insights actionable. “Holdings Cap Gains” pinpoints the biggest tax drivers, while “Cap Gains Analysis for Similar Funds” finds lower-distribution alternatives, helping advisors present more efficient options.
Turn Losses Into Planning Opportunities
Lagging positions can become planning opportunities through tax-loss harvesting, where realized losses offset gains elsewhere. For clients sitting on sizable unrealized gains after this year’s rally, realizing losses from weaker funds can reduce tax exposure without disrupting long-term allocation goals.
Even strong markets leave laggards. The fund screener below highlights some of the largest equity funds by AUM with the weakest 1-year total returns. Funds like these become candidates for harvesting when paired with tax-efficient reallocations.
| Symbol | Name | Total Assets Under Management | 1 Year Total Returns | Equity Style |
|---|---|---|---|---|
| EISMX | Eaton Vance Atlanta Capital SMID-Cap Fund I | 13.99B | -7.72% | Small Cap/Blend |
| SOXL | Direxion Daily Semiconductor Bull 3X Shares | 12.07B | -4.44% | Large Cap/Growth |
| VGHAX | Vanguard Health Care Fund Admiral | 35.43B | -13.51% | Large Cap/Blend |
| VHT | Vanguard Health Care Index Fund ETF | 17.56B | -9.05% | Large Cap/Value |
| VNQ | Vanguard Real Estate Index Fund ETF | 65.73B | -3.78% | Mid Cap/Blend |
| XLV | Health Care Select Sector SPDR Fund | 32.86B | -10.54% | Large Cap/Value |
YCharts helps surface these opportunities quickly. Fundamental Charts reveal underperformers against benchmarks like the S&P 500, while Screeners and Comparison Tables extend that visibility across portfolios to uncover harvesting opportunities at scale.
By reframing short-term losses as tools for tax efficiency, advisors can show clients how even underperformance can contribute to securing better long-term outcomes. See how YCharts identifies tax-loss harvest opportunities in seconds.
Simplify Tax-Efficient Portfolio Transitions
Shifting clients out of legacy funds or concentrated positions often raises tax concerns, even when a new allocation is more efficient.
Transition Analysis helps remove that barrier. The tool models the transactions required to shift from a current portfolio to a proposed one, realizes losses first, and works through gains in the most tax-efficient order. The result is a precise estimate of what a transition will cost today and how it improves efficiency.
For advisors, it replaces guesswork with a client-ready PDF, turning a difficult conversation into a transparent one. Generate client-ready transition reports instantly with YCharts. (trial link)
Plan Beyond 2025
The One Big Beautiful Bill extended TCJA brackets and deductions, removing the risk of an automatic tax hike in 2026. That stability does not erase the tax impact of today’s market gains. Realized sales and distributions still create liabilities, and the timing of those decisions shapes long-term outcomes.
Consider a client with a $100,000 taxable portfolio and $25,000 in unrealized gains:
- If realized now: A $3,750 tax bill at the 15% long-term capital gains rate leaves $96,250 to reinvest.
- If deferred: Taxes arrive later, but the portfolio compounds longer on the full $100,000.
- Over time: Each decision produces a different after-tax outcome.
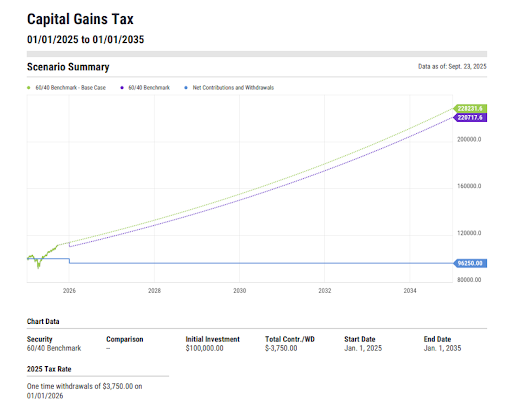
Download Visual | Modify in YCharts
With YCharts, year-end planning becomes preparation, not reaction. Use these tools to show clients where tax exposure lies, what transitions cost, and how today’s decisions shape tomorrow’s outcomes. Start a free trial today to see these strategies in action.
Ready to Move On From Your Investment Research and Analytics Platform?
Follow YCharts Social Media to Unlock More Content!
Disclaimer
©2025 YCharts, Inc. All Rights Reserved. YCharts, Inc. (“YCharts”) is not registered with the U.S. Securities and Exchange Commission (or with the securities regulatory authority or body of any state or any other jurisdiction) as an investment adviser, broker-dealer or in any other capacity, and does not purport to provide investment advice or make investment recommendations. This report has been generated through application of the analytical tools and data provided through ycharts.com and is intended solely to assist you or your investment or other adviser(s) in conducting investment research. You should not construe this report as an offer to buy or sell, as a solicitation of an offer to buy or sell, or as a recommendation to buy, sell, hold or trade, any security or other financial instrument. For further information regarding your use of this report, please go to: ycharts.com/about/disclosure.
Next Article
Unlocking Organic Growth: Why Proposal Generation Matters for Large RIAsRead More →