Do You Know Your Exposure To Mega Cap Stocks?
We’ve all grown used to seeing monikers like FAANG, FAMGA, FAANGM, and the ninety-seven other iterations that scroll across our computer and TV screens daily. But has familiarity led us to complacency?
High-growth tech stocks like Apple (AAPL), Microsoft (MSFT), Amazon (AMZN), Alphabet (GOOG & GOOGL), Meta Platforms (FB), Netflix (NFLX) have led the US stock market, the S&P 500, and most of our portfolios higher for the better part of a decade. We’re all accustomed to seeing these stocks outperform, but now the script has flipped in 2022.
Nearly all of the “mega cap stocks”, labeled so because their market caps dwarf those of the other 490+ constituents within the S&P 500, are dragging the index lower. The FAANGMs, now joined by Tesla (TSLA) and NVIDIA (NVDA) as some of the largest constituents in the S&P 500, are falling victim to rapid inflation, economic uncertainty, and stymied consumer sentiment. Having the worst go of it are Meta Platforms, Tesla, NVIDIA, and Netflix, all down more than 40% on the year, as of writing.
The sell-off to start 2022 has investors worried, but how worried should they be? Just how much exposure to these names does the average individual actually carry? And what problems can this holdings concentration cause when markets sell off? Our latest white paper, The Real Impact of Mega Cap Stocks on Your Portfolio and the Market, answers these questions and more. Download your free copy below, or keep reading for a preview of our findings.
Download the free White Paper to see our full findings:
The Typical Investor’s REAL Exposure to Mega Cap Stocks
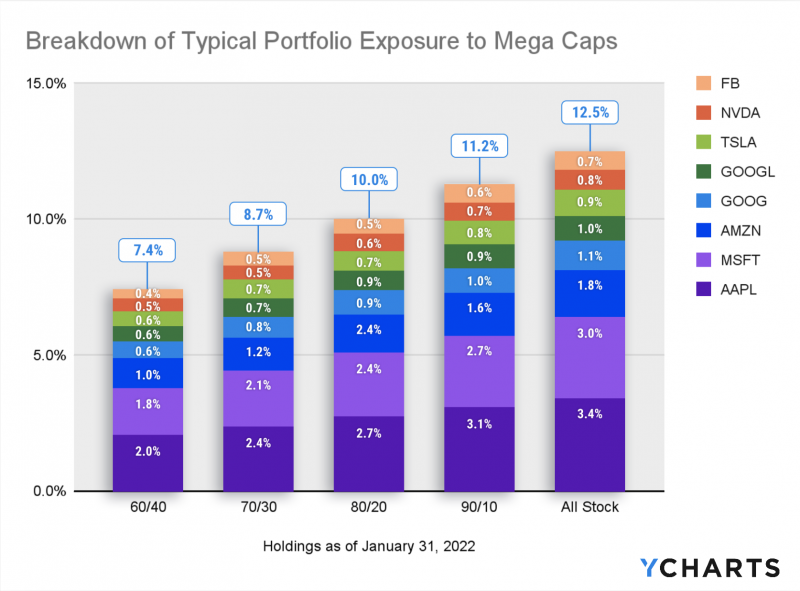
FAANG and similar acronyms were created as shorthand for a cohort of high-growth tech stocks that led the market for years. But as popular index funds, or any market cap-weighted investment vehicle, account for these stocks’ market cap growth, they have also sneakily become the average investor’s largest holdings.
Most already know these companies are huge, even relative to other large cap stocks, and make up about a quarter of the S&P 500. But even in typical allocation portfolios, when looking past the mutual funds and ETFs that are so popular today, these exposure levels are pretty eye-popping:
Get the FREE White Paper & Download This Visual
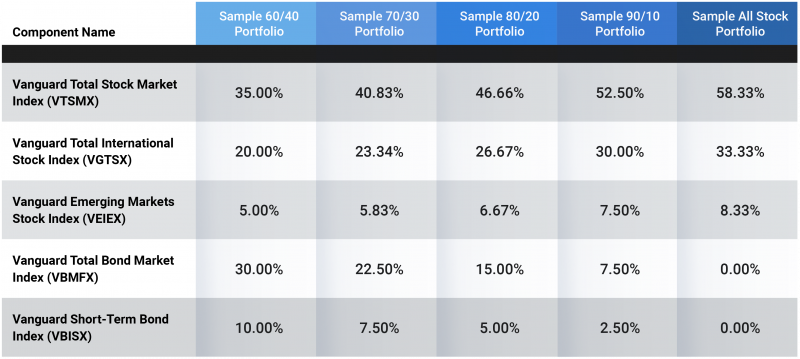
Below are the holdings and weights used to construct the sample portfolios above. All are among the largest and most pervasive mutual funds available:
Mega Cap Concentration + Mega Cap Sell Off = Mega Sadness
It is worth acknowledging that without these stocks, most of our portfolio returns—and certainly the S&P 500’s performance—would look much different over the last decade. On a ten year lookback, most investors would appreciate everything these stocks have done for their portfolio growth. But on a year-to-date lookback, the picture is much more grim.
Going back to 2016, our research identified at least three periods in which three or more “mega cap stocks” were selling off rapidly, and the market cap-weighted investor simply had to brave the storm. The mega caps giveth, and they can certainly taketh away.
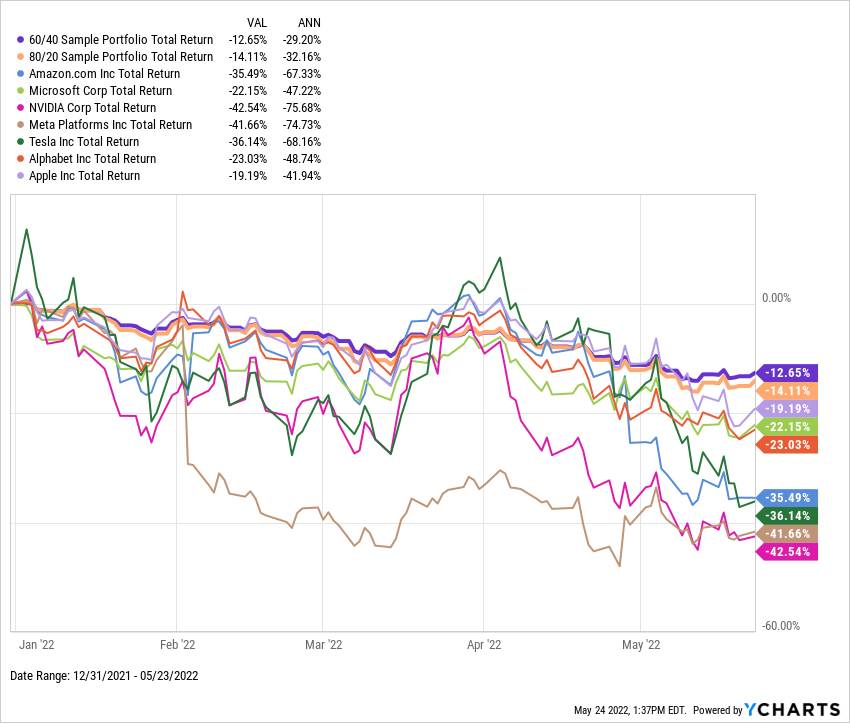
Here’s how mega caps are pulling down a 60/40 Sample Portfolio and an 80/20 allocation in 2022:
Get the FREE White Paper & Download This Visual
What’s Next for Mega Cap Stocks?
Depending on your views regarding allocation strategies and portfolio construction, the prevailing concentration in mega cap stocks may or may not be a major concern. While current market conditions have equaled headwinds for large cap growth and tech stocks, things could change just as rapidly as they have before.
Regardless of your stance, it’s interesting that investors used to frequently ask, “Should I buy Tesla?”. And now, “These ETFs don’t have any Tesla in them, do they?”
Download the free White Paper to see our full findings:
Connect with YCharts
To get in touch, contact YCharts via email at hello@ycharts.com or by phone at (866) 965-7552
Interested in adding YCharts to your technology stack? Sign up for a 7-Day Free Trial.
Disclaimer
©2022 YCharts, Inc. All Rights Reserved. YCharts, Inc. (“YCharts”) is not registered with the U.S. Securities and Exchange Commission (or with the securities regulatory authority or body of any state or any other jurisdiction) as an investment adviser, broker-dealer or in any other capacity, and does not purport to provide investment advice or make investment recommendations. This report has been generated through application of the analytical tools and data provided through ycharts.com and is intended solely to assist you or your investment or other adviser(s) in conducting investment research. You should not construe this report as an offer to buy or sell, as a solicitation of an offer to buy or sell, or as a recommendation to buy, sell, hold or trade, any security or other financial instrument. For further information regarding your use of this report, please go to: ycharts.com/about/disclosure
Next Article
Is the 60/40 Portfolio Drowning?Read More →