Government Shutdown October 2025: Analyzing Market Impact and Sector Performance
Current Market Dashboard
Table of Contents
Historical Context: Learning from Past Shutdowns
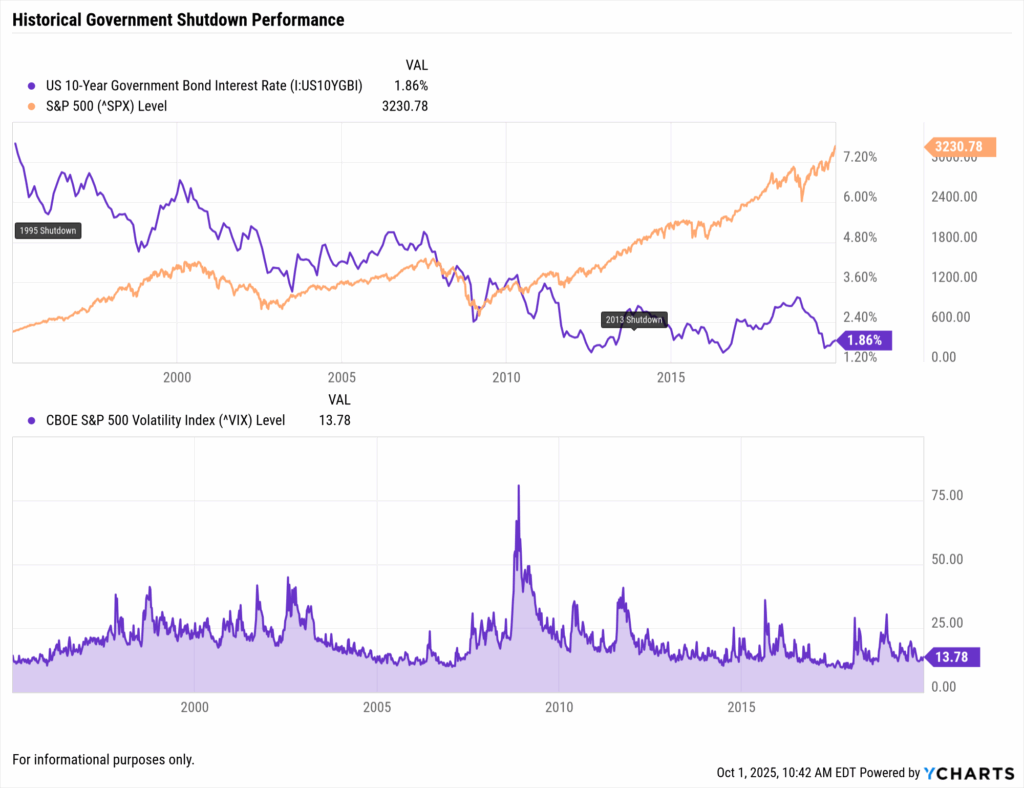
Government shutdowns have become an increasingly common feature of the U.S. political landscape, with notable occurrences providing valuable insights for investors. The 35-day shutdown from December 22, 2018 to January 25, 2019 remains the longest in U.S. history, during which the S&P 500 rallied 10.3% from the shutdown’s start to its conclusion. However, this gain represented a sharp rebound from December 2018’s oversold conditions driven by Federal Reserve rate hikes rather than a positive reaction to the shutdown itself.
The October 1-17, 2013 shutdown, lasting 16 days, saw the market gain approximately 2.4% during the period, with the S&P 500 actually hitting a new all-time high on the shutdown’s final day. Standard & Poor’s estimated this shutdown cost $24 billion to the economy. The 1995-1996 period involved two separate shutdowns: November 14-19, 1995 (5 days) and December 16, 1995 to January 6, 1996 (21 days), with the S&P 500 gaining 0.1% during the first and 3.3% during the second.
What distinguishes the current shutdown is the broader macroeconomic context. With the Federal Reserve maintaining a data-dependent stance on monetary policy and inflation concerns still present, this shutdown introduces additional complexity to an already uncertain economic environment. The 10-Year Treasury yield at 4.09% reflects a flight to safety as yields fell across the curve.
Sector Impact Analysis
| Sector | Shutdown Impact | Sector ETF | Day 1 Change | Key Considerations |
|---|---|---|---|---|
| Healthcare | Safe Haven | XLV | +3.09% | Major flight to quality, shutdown-insulated sector |
| Government Services | Surging | CACI | +3.28% | Services contractors rally on catch-up expectations |
| Technology | Resilient | XLK | +0.98% | Tech buying on shutdown seen as opportunity |
| Utilities | Defensive Bid | XLU | +0.96% | Classic defensive rotation beginning |
| Small Caps | Lagging | IWM | +0.22% | Underperforming large caps, risk-off signal |
| Defense & Aerospace | Unchanged | ITA | 0.00% | Hardware stable, services rallying |
| Real Estate | Flat | XLRE | 0.00% | Wait-and-see approach |
| Financials | Weak | XLF | -0.89% | Economic uncertainty weighing on banks |
|
Powered by
|
||||
Defense Contractors Face Immediate Pressure
Contrary to expectations, defense contractors displayed a striking split on Day 1 of the shutdown. Traditional defense manufacturers showed remarkable stability, with the group averaging just -0.01% decline. Lockheed Martin (LMT) edged down 0.04% to $499.00, while Boeing (BA) actually gained 0.01% to $215.20. Raytheon Technologies (RTX) rose 0.04% to $167.20, demonstrating that markets see defense budgets as largely insulated from shutdown impacts.
The real story emerged in government services contractors, which surged dramatically. CACI International (CACI) led all defense-related stocks with a 3.28% jump to $515.16. Booz Allen Hamilton (BAH) rose 2.65% to $102.60, while SAIC gained 1.77% to $101.13. Leidos Holdings (LDOS) added 1.41% to reach $191.63. This 2.28% average gain for services contractors versus -0.01% for defense primes suggests investors expect these firms to benefit from eventual catch-up spending once the shutdown ends.
Key Market Indicators Signal Moderate Concern
The VIX volatility index at 16.39 remains well below the 20-25 range that typically signals significant market stress. During the 2018-2019 shutdown, VIX peaked at 30.41, while the 2013 shutdown saw it reach 20.3. Current levels suggest investors view this as a manageable political event rather than a systemic risk.
Treasury markets showed a classic but muted flight-to-quality pattern with the 10-Year Treasury yield falling 3 basis points to 4.12%. The modest bond rally indicates investors are seeking some safety but aren’t panicking about the shutdown’s economic impact.
The US Dollar Index (DXY) at 97.75 was essentially flat, declining just 0.04%, showing no significant flight to or from the dollar during the initial shutdown period.
Economic Impact Assessment
The Congressional Budget Office’s analysis of the 2018-2019 shutdown found that it reduced quarterly GDP by 0.1% in Q4 2018 ($3 billion) and 0.2% in Q1 2019 ($8 billion). These are quarterly impacts, not weekly rates as sometimes misreported. Goldman Sachs estimates shutdowns reduce GDP growth by approximately 0.2 percentage points per week, though most of this impact is recovered once the government reopens and back pay is distributed.
Academic research from Baker and Yannelis (2017) found that federal workers reduced overall spending by approximately 10% during the 2013 shutdown, with furloughed workers cutting spending by 14% and those working without pay reducing it by 7%. This is significantly less than the 20-25% income loss these workers experienced, showing some consumption smoothing despite liquidity constraints.
Federal Reserve policy implications add complexity. Chicago Fed President Austan Goolsbee noted the shutdown would delay critical economic data from the Bureau of Labor Statistics, Census Bureau, and Bureau of Economic Analysis, creating a “data desert” at a crucial time for monetary policy decisions. The Fed must rely on alternative sources like ADP payrolls and regional Fed nowcasting models during shutdowns.
Investment Strategy Considerations
Historical patterns show three distinct phases of market behavior during shutdowns. We’re currently in the initial reaction phase, characterized by defensive positioning and risk reduction. Defense contractors and government services firms typically face immediate pressure, as we’re seeing today. The consolidation phase (days 2-10) often sees volatility moderate as investors assess duration probabilities. The resolution rally phase typically begins when credible negotiations emerge.
Since 1976, the S&P 500 has risen 55% of the time during government shutdowns with an average return of 0.3%. More importantly, markets are higher 86% of the time twelve months after a shutdown ends, with average gains of 12.7%. This suggests long-term investors should avoid overreacting to shutdown volatility.
Defensive sectors historically outperform during shutdowns, following classic defensive sector rotation strategies that advisors use during periods of market uncertainty. The Utilities Select Sector SPDR (XLU) and Healthcare Select Sector SPDR (XLV) are showing early relative strength. Conversely, iShares Russell 2000 ETF (IWM) typically underperforms as small-caps are more vulnerable to economic disruption.
Historical Shutdown Performance Table
| Shutdown Period | Duration | S&P 500 Performance | VIX Peak | Post-Resolution Rally |
|---|---|---|---|---|
| Dec 22, 2018 – Jan 25, 2019 | 35 days | +10.3% | 36.2 | +4.9% (30 days) |
| October 1-17, 2013 | 16 days | +2.4% | 20.3 | +3.1% (30 days) |
| Nov 14-19, 1995 | 5 days | +0.1% | 14.2 | +2.3% (30 days) |
| Dec 16, 1995 – Jan 6, 1996 | 21 days | +3.3% | 15.8 | +5.1% (30 days) |
| October 1, 2025 (Current) | Day 1 | +0.34% | 13.32 | TBD |
|
Powered by
|
||||
Looking Forward: Resolution Scenarios
Three primary resolution scenarios emerge based on historical precedent and current political dynamics. A quick resolution (within 1-2 weeks) would likely trigger a relief rally, particularly in oversold government contractors and small-cap stocks. History shows defense contractors typically recover rapidly once resolution appears imminent.
A medium-duration shutdown (2-4 weeks) would cause more significant economic damage but might prompt Federal Reserve accommodation, potentially benefiting rate-sensitive sectors. The Real Estate Select Sector SPDR (XLRE) and high-dividend yielding equities could outperform in this environment.
An extended shutdown exceeding four weeks—unlikely but possible given the unprecedented threat of permanent federal layoffs rather than temporary furloughs, would raise systemic concerns. In this scenario, defensive assets including U.S. Treasuries would likely see continued demand despite the fiscal irony.
Key Takeaways for Investors
- Markets Defy Shutdown Fears: S&P 500 actually gained 0.34% on Day 1, showing resilience despite political uncertainty
- Services Beat Hardware: Government services contractors surged (CACI +3.28%, BAH +2.65%) while defense manufacturers barely moved (-0.01% average)
- Healthcare Leads Flight to Quality: XLV jumped 3.09% as investors sought shutdown-insulated defensive sectors
- No Panic in Markets: VIX rose only 0.45% to 13.32, well below levels indicating serious market stress
Conclusion
The October 2025 government shutdown’s first day delivered a surprising message: markets aren’t particularly concerned. The S&P 500’s gain of 0.34% to 6,684.50 and the minimal rise in the VIX to just 16.21 indicate investors view this as a temporary political disruption rather than a genuine economic threat.
The remarkable divergence between government services contractors (up 2.28% on average) and defense manufacturers (down 0.01%) reveals sophisticated market positioning. Investors are differentiating between companies facing immediate payment delays and those likely to benefit from eventual catch-up spending. Healthcare’s 3.09% surge confirms the classic defensive rotation pattern, but without the panic typically seen in crisis situations.
Historical patterns strongly suggest patience will be rewarded. Government shutdowns, while disruptive, have consistently proven temporary. With volatility remaining contained and defensive sectors performing as expected, investors should maintain discipline, avoid dramatic portfolio changes, and prepare for the resolution rally that history suggests is likely to follow. The market’s Day 1 message is clear: this shutdown, like those before it, shall pass.
Ready to Move On From Your Investment Research and Analytics Platform?
Follow YCharts Social Media to Unlock More Content!
Next Article
Monthly Market Wrap: September 2025Read More →