The Best Performing Dividend ETFs & How to Find Them
The “bird-in-hand” theory suggests that, due to uncertainty of the future, investors prefer stock dividends to potential capital gains. While good in principle, that’s not always the case in practice. So if you value a bird in the hand, but at the same time want a chance at those in the bush, what investment vehicles are out there to get the best of both worlds?
Enter: dividend exchange-traded funds (ETFs). Dividend ETFs are structured to invest in a basket of stocks with above-average dividend yields. Historical data also shows how some funds in the category have stood out on performance. Given relatively lower yields coming from bonds and other fixed-income products, dividend stocks and ETFs have become even more attractive.
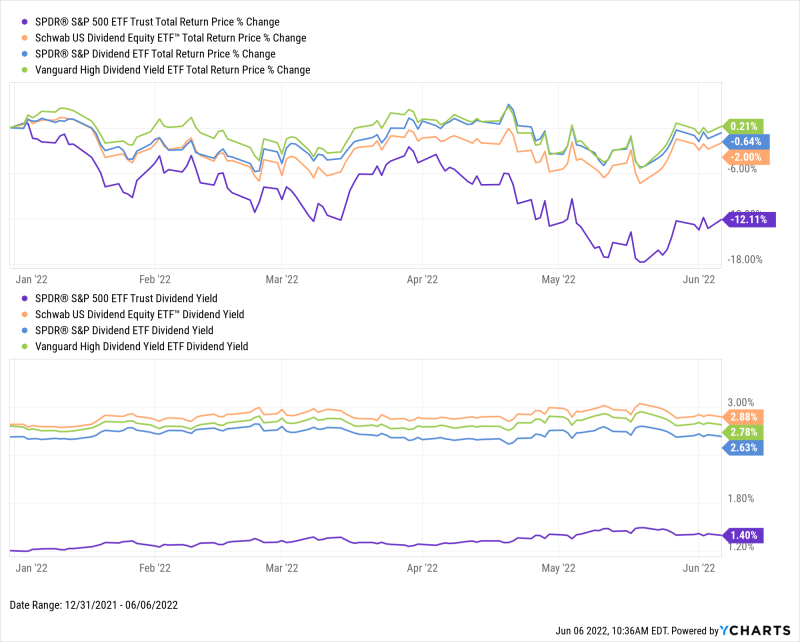
Performance of the broader market so far in 2022 has reinforced the value propositions of dividend ETFs.The S&P 500, illustrated by the SPDR S&P 500 ETF Trust (SPY) in the chart below, is down 12% year-to-date as of writing. Yet, some of the largest dividend ETFs are just slightly negative, or even above water in 2022. Their dividend yields are also about twice as high as SPY’s.
Download Visual | Modify in YCharts
The Best Performing Dividend ETFs
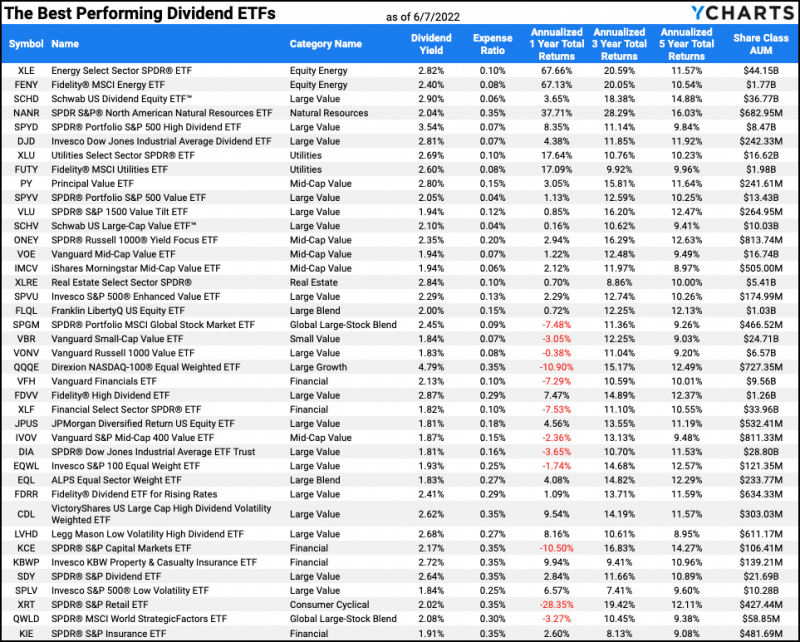
The following 40 best performing dividend ETFs were identified with the YCharts Fund Screener, using YCharts’ pre-built “Top Performing Dividend ETFs” screening template. Starting from a universe of over 4,000 ETFs, filters were added to identify equity ETFs with at least 3 years consistent dividend payments and top 50% rankings for dividend yield, annualized 3-year total returns, annualized 5-year total returns, and low expense ratios. Then, an objective Scoring Model was added to rank the resulting 40 best dividend ETFs using an equal-weighted score that considers dividend yield, annualized 1-year, 3-year, and 5-year total returns, and expense ratio.
The following list of best performing dividend ETFs is ordered from best to worst according to the scoring model, and includes funds in the Large Value, Mid-Cap Value, and Energy categories, among others:
Download Visual | Modify in YCharts
Uses for Dividend ETFs
Beyond the normal diversification benefits that ETFs can provide, dividend ETFs also vary based on dividend strategies—they can include holdings that offer dividend consistency, dividend appreciation, or both. As is the case with dividends from individual stocks, dividends paid by ETFs can be reinvested or taken as investment income.
While some ETFs include “dividend” in their names and are marketed as such, plenty of others achieve high dividend yields just as a result of their investment strategies.
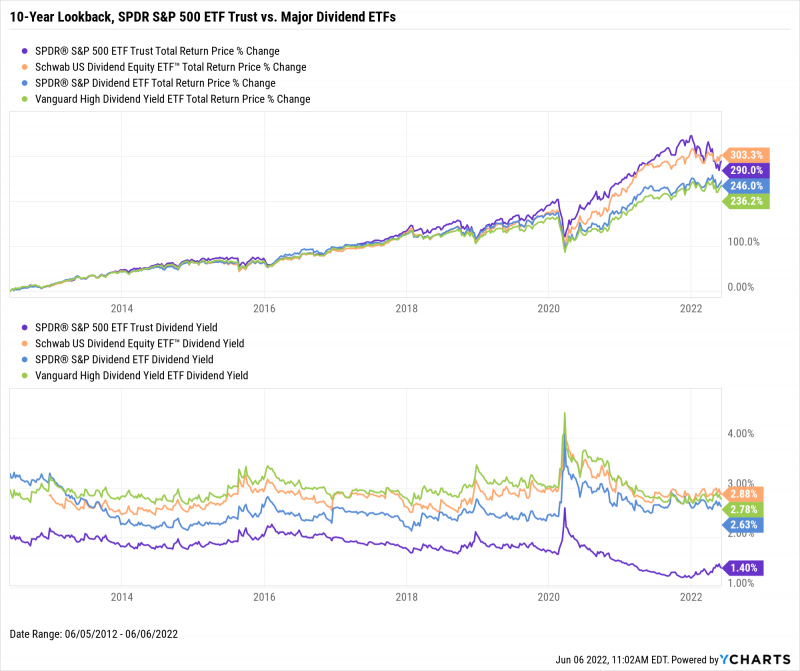
Dividend ETFs also tend to provide higher levels of stability and income than the broader market. While the previously-cited major dividend ETFs have underperformed the S&P 500 over much of the last decade, all three have lower betas and greater dividend yields than the broader market index. In fact, the market corrections in 2020 and 2022 have allowed both the SPDR S&P Dividend ETF (SDY) and Vanguard High Dividend Yield ETF (VYM) to close in on SPY’s 10-year total return, while the Schwab US Dividend Equity ETF (SCHD) recently surpassed it.
Download Visual | Modify in YCharts
The Benefits of Dividend ETFs
Equity income is the primary benefit of high-yield dividend ETFs. After all, dividends are meant to provide current income to company shareholders. Beyond income, dividend ETFs can provide portfolio stability, diversification, and usually lower than average fees.
Dividends and stability sometimes come as a package. Blue-chip industry leaders like Procter & Gamble (PG), Verizon (V), and Pfizer (PFE) are widely considered stable investments thanks to their long track records of corporate profits. But their ability to pay consistent dividends to shareholders also contributes to their images of stability.
While most dividend-paying companies are large or mega-cap firms, dividend ETFs can also offer diversification across levels of market capitalizations. In fact, while some dividend ETFs use basic strategies that simply select dividend-paying companies from the S&P 500, more advanced strategies will add sector tilts, focus on emerging markets, or invest in small-cap stocks that pay dividends. Examples include:
• Diversified High Dividend ETF: SoFi Weekly Dividend ETF (WKLY)
• International Diversified High Dividend ETF: Fidelity International High Dividend ETF (FIDI)
• Dividend REIT: Invesco KBW Premium Yield Equity REIT ETF (KBWY)
• Technology ETF: iShares Semiconductor ETF (SOXX)
• Oil ETF: First Trust Natural Gas ETF (FCG)
• Small Cap Value: VictoryShares US Small Cap High Dividend Volatility Wtd ETF (CSB)
• Mid-Cap Value: Principal Value ETF (PY)
• Large Cap Blend: SPDR® SSGA US Large Cap Low Volatility ETF (LGLV)
Finally, because a strategy that targets dividend yield is relatively basic and easy to employ, expense ratios for dividend ETFs tend to be below average, even rivaling fees of broad index ETFs. Some dividend ETFs carry management expense ratios lower than 0.1%.
Important Metrics to Track Dividend ETF Performance
These are the most important factors to consider when evaluating dividend ETF performance and their holdings or when performing ETF comparisons.
Dividend Yield: the sum of all dividends paid, divided by current share price; a higher dividend yield indicates a larger payout
Dividend Payout Ratio: the percentage of company net income paid as dividends to shareholders; a higher dividend payout ratio is better
Dividend Growth: period over period growth of dividends paid, usually expressed as trailing twelve month (TTM) growth; higher dividend growth is better
Dividend Consistency: the track record of paying dividends to shareholders at a regular interval, usually quarterly, over a given lookback period; a company cutting or canceling a dividend payment is a negative event, but dividend ETFs with plenty of holdings can mitigate that risk
Total Returns: unlike price return, total return includes paid dividends in addition to security price appreciation; a higher total return is better
Expense Ratio: the percentage of fund assets that shareholders pay as management fees and operating expenses; a lower expense ratio means less fees (luckily, dividend ETFs tend to have relatively lower expenses)
Market Cap Allocation: the percentage of fund assets invested in large-cap, mid-cap, and small-cap stocks; greater exposure to large-cap companies tends to be preferred among dividend ETF investors
Current Yield: a fund’s annual interest income from bond holdings, divided by current share price; while dividends come from equity holdings, an equity-bond blended fund may also provide interest income and be relevant for income-seeking investors.
The Bottom Line
With higher dividends than both the broad market and many individual companies, dividend ETFs may be the way to go if a bird in the hand is more valuable to you than two in the bush. Because dividend ETFs often invest in groups of individual stocks, they can provide inherent diversification, along with capital appreciation during bull markets and capital preservation amid market declines. YCharts contains over 1400 funds with dividend yields of 2% or more, meaning there are sure to be dividend ETFs suitable for your clients!
Using YCharts to Find Dividend ETFs
Several YCharts tools and pre-built templates enable you to find high-yield dividend ETFs and facilitate more informed comparisons of dividend ETFs. Below are a few examples:
Identify the Best Performing ETFs using the Fund Screener
As noted previously, some dividend ETFs have underperformed the broader market in recent years. Here’s how YCharts helps you find high-yield dividend ETFs that outperform their peers.
Pre-built Screening Templates: The Fund Screener’s Top Performing Dividend ETFs screen is one of many pre-built templates available on YCharts. Used to identify the current 40 best performing dividend ETFs listed above, in just a few clicks this template locates equity ETFs with above-average dividend yields and total returns over several lookback periods, below-average management fees, and a track record of consistent dividend payments.
Other pre-built templates, such as Best Performing Value ETFs and Best Performing Growth ETFs, can be further modified with dividend-related metric filters to hone in on the best ETFs for your clients.
Dividend Growth ETFs: YCharts gives you access to proprietary lists that can easily identify dividend ETFs that have consistently paid dividends, or have regularly grown their dividends over time. Using the YCharts Fund Screener, click Modify, then Dividend Policies, and select Dividend Growth or Dividend Consistency.
Monthly Dividend ETFs: Most ETFs distribute dividend income quarterly, but if you’re looking for more frequent income, some ETFs pay monthly dividends. Using the Fund Screener, click Modify, then Dividend Policies, and select Monthly Dividend Frequency.
Generate Custom Dividend ETF Comparison Reports
FINRA-reviewed Comparison PDF Reports analyze and compare portfolios, mutual funds, and other securities using clean and client-friendly visuals in a PDF format. PDF reports are customizable with your firm’s logo, colors, and disclosures.
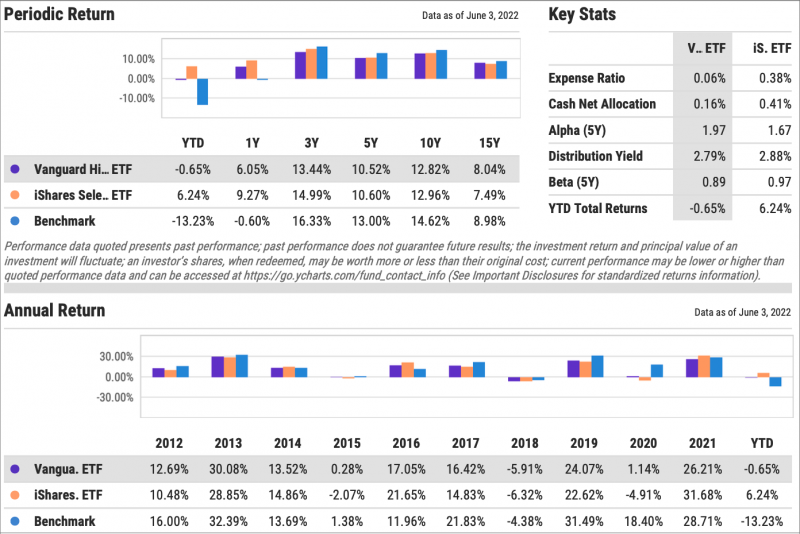
Use Side-by-Side Comparison Reports to examine the performance, key metrics, and holdings of two dividend ETFs, like the Vanguard High Dividend Yield ETF (VYM) and BlackRock iShares Select Dividend ETF (DVY). In the following example, VYM has outperformed DVY over the last 15 years, but DVY currently carries a higher dividend yield and better performance year-to-date. This ETF Comparison report is generated within seconds, saving you time and energy to focus your attention on other tasks.
Click here to learn more about Custom PDF Reports
Use Comp Tables to Evaluate ETFs Head-to-Head
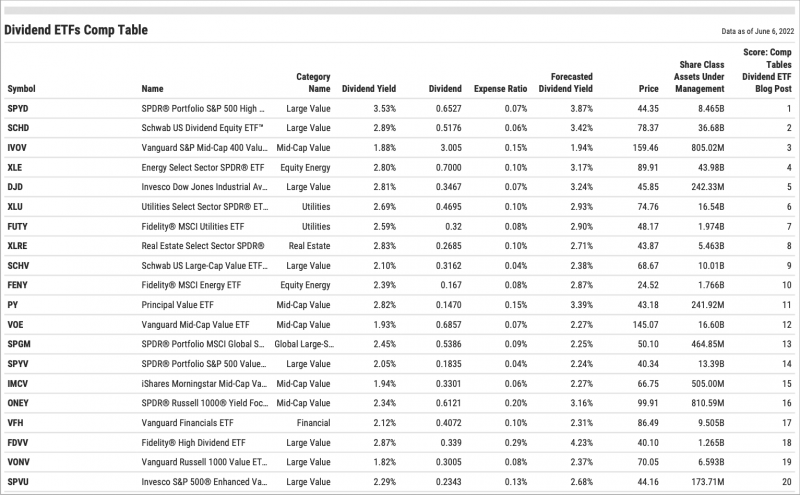
With YCharts Comp Tables, you can define the specific financial metrics for a set of dividend ETFs and how they stack up against one another. Comp Tables make it easy for you to identify each ETF’s strengths and weaknesses. Use custom Scoring Models to establish an objective ranking based on the financial metrics you value most to ensure you find the best performing dividend ETFs.
It’s easy to input tickers, import results from a watchlist or screen, or do both. Using the 40 dividend ETFs identified from the Fund Screener’s Top Performing Dividend ETFs template, the SPDR Portfolio S&P 500 High Dividend ETF (SPYD), Schwab US Dividend Equity ETF (SCHD), and Vanguard S&P Mid-Cap 400 Value ETF (IVOV) are the top three securities when ranked evenly across Dividend Yield, Dividend, Expense Ratio, and Forecasted Dividend Yield. Performing a comparison using Comp Tables and Scoring Models helps you drill down on the best performing dividend ETFs through different lenses.
Click to learn more about Comp Table PDF Reports
Evaluate Dividend ETFs faster with Pre-built Quickflows
YCharts Quickflows leverage already powerful tools and data to conduct higher quality research in less time. Based on investment research best practices and the most common workflows, our Quickflows blog shares more details on how to automate your analyses.
The Tax Adjusted Return Comparison Quickflow evaluates up to 12 ETFs for total return, tax cost ratio, and tax-adjusted total return over several periods. Because investors face income tax for dividends collected, this pre-built analysis helps you find dividend ETFs that outperform net of taxes paid. Click here to see the Quickflow’s results for several dividend ETFs.
Similarly, the Equity Style Exposure Quickflow compares holdings of multiple ETFs based on their allocations to Morningstar’s nine equity style boxes. Click here to see an example.
Connect With YCharts
To get in touch, contact YCharts via email at hello@ycharts.com or by phone at (866) 965-7552
Interested in adding YCharts to your technology stack? Sign up for a 7-Day Free Trial.
Disclaimer
©2022 YCharts, Inc. All Rights Reserved. YCharts, Inc. (“YCharts”) is not registered with the U.S. Securities and Exchange Commission (or with the securities regulatory authority or body of any state or any other jurisdiction) as an investment adviser, broker-dealer or in any other capacity, and does not purport to provide investment advice or make investment recommendations. This report has been generated through application of the analytical tools and data provided through ycharts.com and is intended solely to assist you or your investment or other adviser(s) in conducting investment research. You should not construe this report as an offer to buy or sell, as a solicitation of an offer to buy or sell, or as a recommendation to buy, sell, hold or trade, any security or other financial instrument. For further information regarding your use of this report, please go to: ycharts.com/about/disclosure
Next Article
Big Tech PE Ratios, Mortgage Rates, Market Neutral Funds | What's Trending on YCharts?Read More →
