Big Tech PE Ratios, Mortgage Rates, Market Neutral Funds | What’s Trending on YCharts?
With every edition of What’s Trending on YCharts?, we reveal the stocks, funds, and economic data that generated the most traffic each month on YCharts. Are any of these names or data points on your radar?
In May 2022, YCharts pageview data showed that falling P/E ratios for big tech stocks, the 30 Year Mortgage Rate, and “market neutral” funds have been catching the market’s attention.
To see everything that’s been trending on YCharts, watch the full episode here:
Most Popular Company Pages
These stock data pages had the most unique pageviews in May 2022.
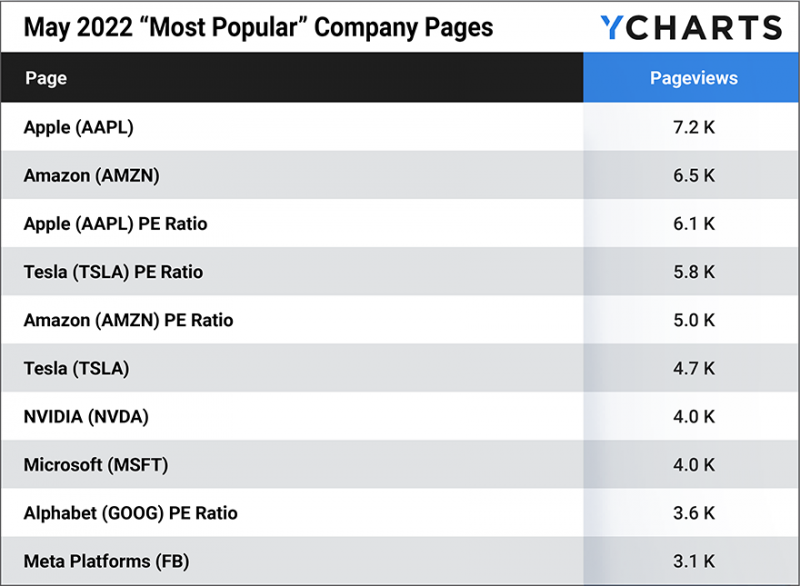
1. Apple (AAPL)
6. Tesla (TSLA)
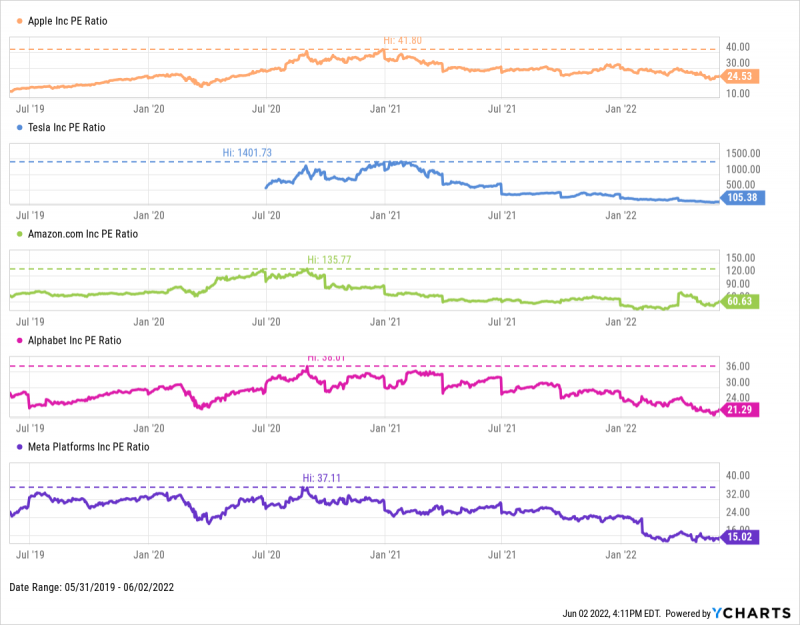
Although downward price momentum is mostly to blame, price-to-earnings (P/E) ratios are on the decline, representing a reduction of heightened equity valuations. For some of the biggest public companies around, like Apple, Tesla and Amazon, P/E ratios peaked in late 2021 but have fallen considerably this year.
At what prices do these companies become cheap enough to trigger meaningful buying?
Download Visual | Modify in YCharts
Hottest Mutual Fund & ETF Pages
These mutual fund and ETF pages had the largest month-over-month unique pageview growth in May 2022, as compared to April 2022.
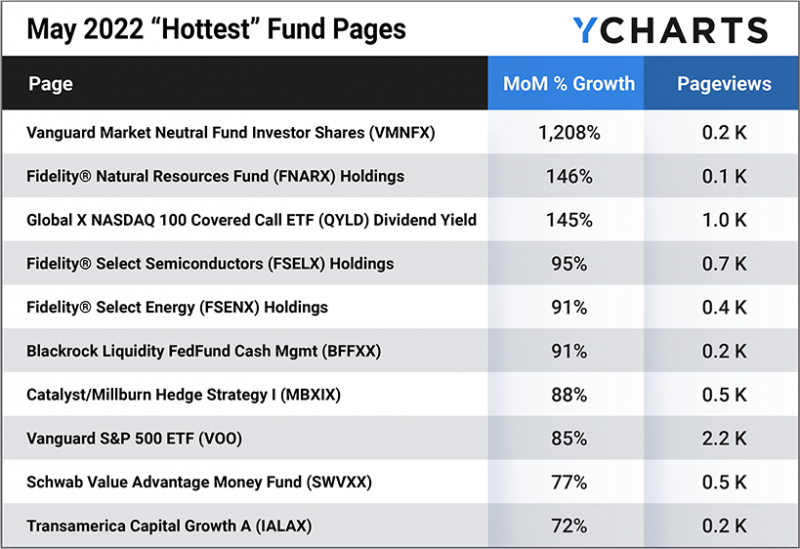
1. Vanguard Market Neutral Fund Investor Shares (VMNFX)
2. Fidelity® Natural Resources Fund (FNARX) Holdings
3. Global X NASDAQ 100 Covered Call ETF (QYLD) Dividend Yield
4. Fidelity® Select Semiconductors (FSELX) Holdings
5. Fidelity® Select Energy (FSENX) Holdings
6. Blackrock Liquidity FedFund Cash Mgmt (BFFXX)
7. Catalyst/Millburn Hedge Strategy I (MBXIX)
9. Schwab Value Advantage Money Fund (SWVXX)
10. Transamerica Capital Growth A (IALAX)
This chart is a great illustration of “market neutral” funds and their potential benefits relative to the S&P 500. While Beta for Vanguard’s Market Neutral Fund Investor Shares (VMNFX) has always fluctuated around 0.00, its Alpha has lifted considerably during the S&P’s pullback in 2022. There’s certainly a time and place for market neutrality—we’re living through one such time right now—but VMNFX, and market neutral funds like it, pale over the long run compared to an index ETF such as SPY.
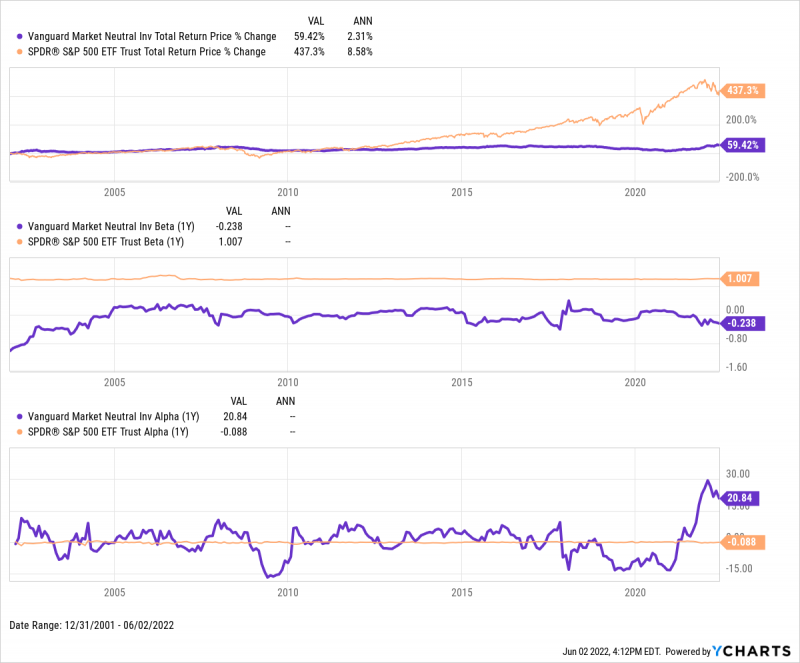
Download Visual | Modify in YCharts
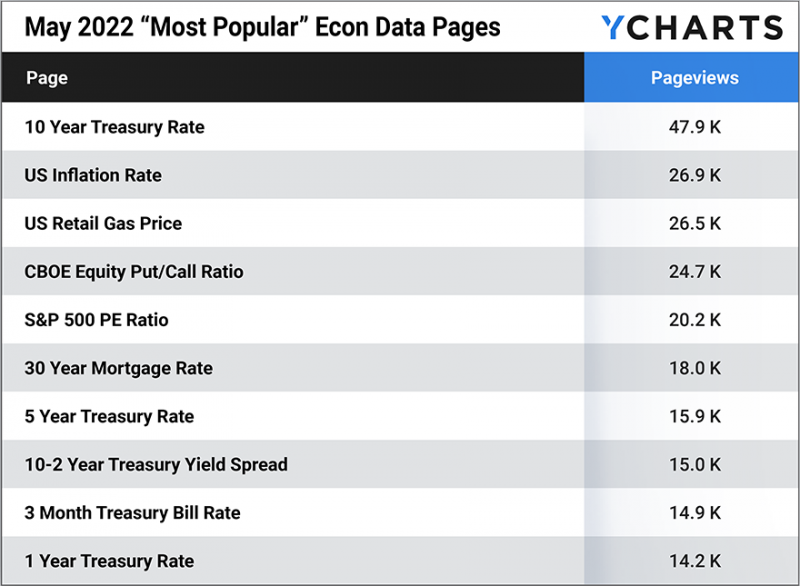
Most Popular Econ Data Pages
These economic data pages had the most unique pageviews in May 2022.
8. 10-2 Year Treasury Yield Spread
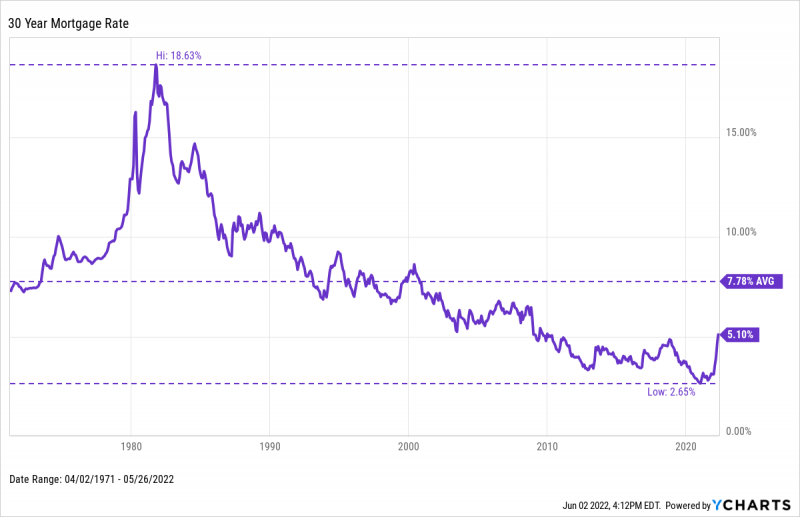
Despite clocking in at an all-time low of 2.65%, then a decade-high of 5.3% in the span of just nine months, the 30-Year Mortgage Rate most recently sat at 5.1%—still 268 basis points below its long-term average of 7.78%. This chart illustrates just how much the housing (and lending) market has evolved since sky-high rates of the 1980s. It also shows us just how much mortgage rates can swing year-over-year.
Download Visual | Modify in YCharts
Connect with YCharts
To learn more, call us at (773) 231-5986, or email hello@ycharts.com.
Want to add YCharts to your technology stack? Sign up for a 7-Day Free Trial to see YCharts for yourself.
Disclaimer
©2022 YCharts, Inc. All Rights Reserved. YCharts, Inc. (“YCharts”) is not registered with the U.S. Securities and Exchange Commission (or with the securities regulatory authority or body of any state or any other jurisdiction) as an investment adviser, broker-dealer or in any other capacity, and does not purport to provide investment advice or make investment recommendations. This report has been generated through application of the analytical tools and data provided through ycharts.com and is intended solely to assist you or your investment or other adviser(s) in conducting investment research. You should not construe this report as an offer to buy or sell, as a solicitation of an offer to buy or sell, or as a recommendation to buy, sell, hold or trade, any security or other financial instrument. For further information regarding your use of this report, please go to: ycharts.com/about/disclosure.
Next Article
Do You Know Your Exposure To Mega Cap Stocks?Read More →