Monthly Market Wrap: May 2025

Welcome back to the Monthly Market Wrap from YCharts, where we dissect crucial market trends for advisors and their clients. This May, stocks were firmly in the green even as consumer sentiment sank to a near all-time low, Gold took a breather after four consecutive months of gains, and the yield curve steepened.
Want to use these visuals in your own presentations? Download our free Monthly Market Wrap slide deck, containing all charts featured in the Market Wrap and more in a shareable, presentation-ready format.
May 2025 Market Summary: Stocks Post Strong Gains, Gold Price Stays Flat, Longer-Term Treasury Yields Rise
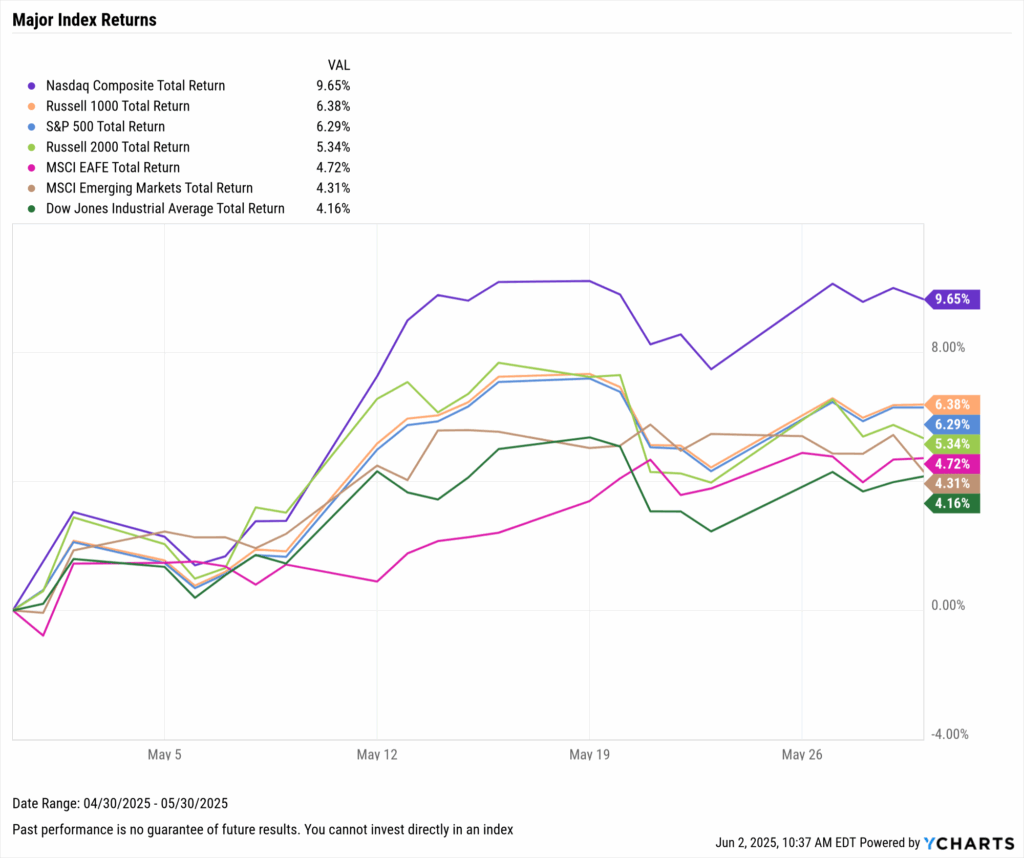
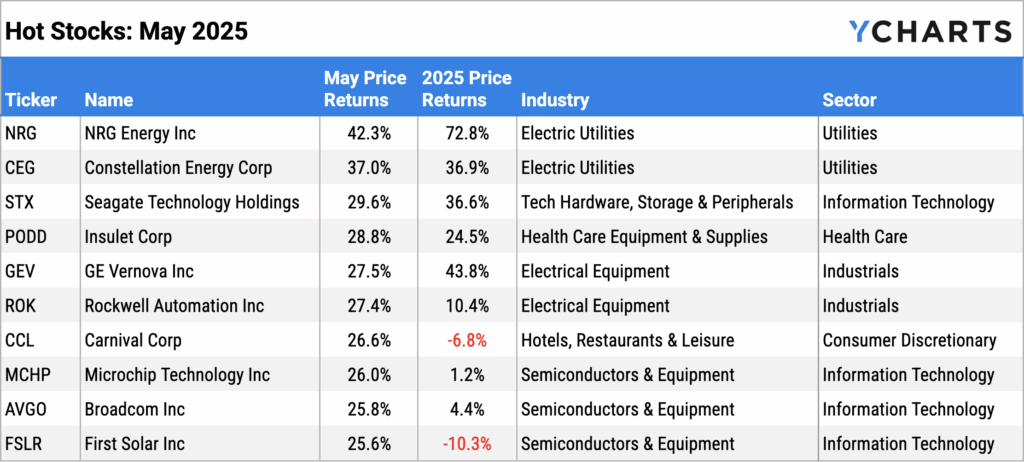
Stocks posted strong performances across the board including the S&P 500 and Nasdaq, which both had their best months since November 2023. The Nasdaq Composite surged 9.7%, the S&P 500 increased 6.3%, and the Dow Jones Industrial Average added 4.2%. Several companies in the semiconductor sector, including Microchip Technology (MCHP), Broadcom (AVGO) and First Solar (FSLR) helped propel indices higher with jumps of 25% or more in May.
Global markets also had a solid month; Developed EAFE Markets posted a 4.7% gain and Emerging Markets added 4.3%.
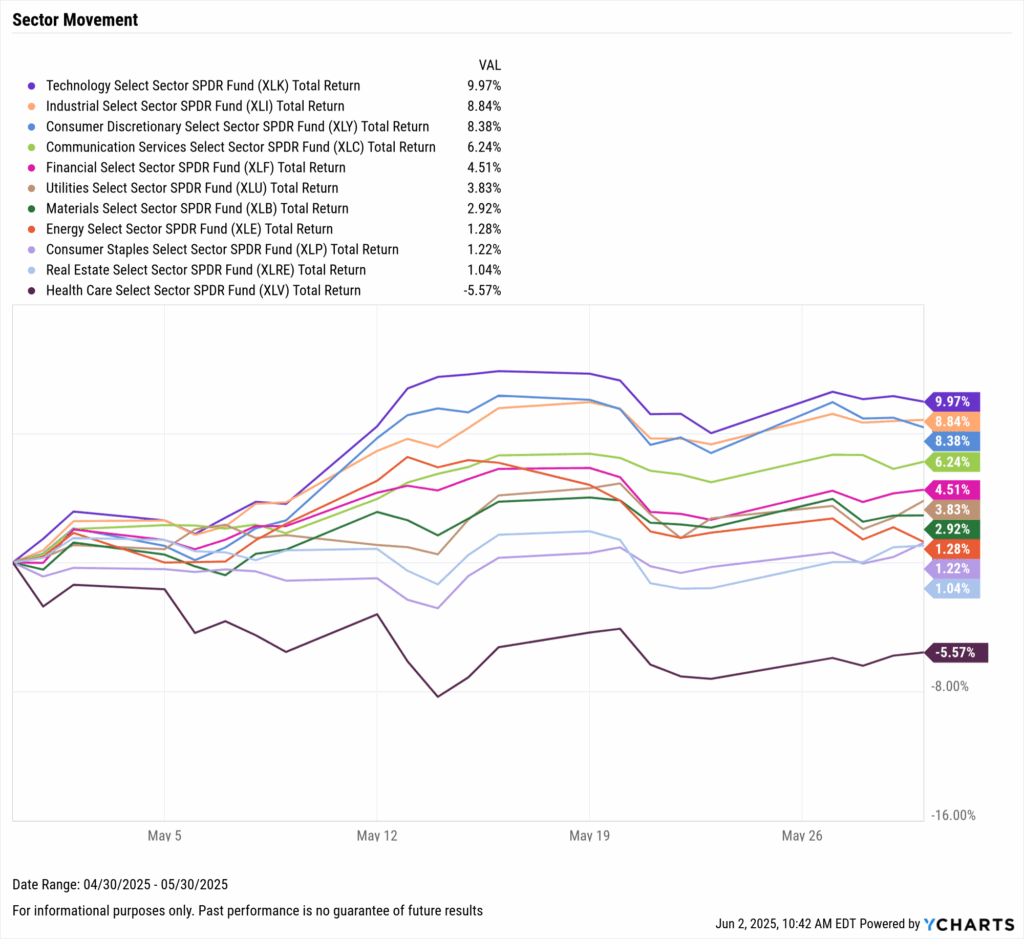
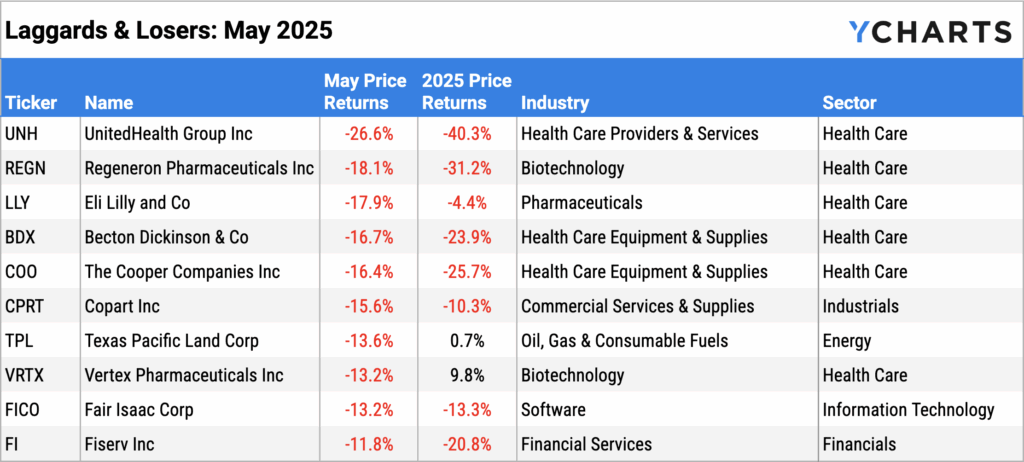
The only negative sector in May was the Health Care sector, which slipped 5.6%. The three best sectors in May were Technology (+10%), then Industrials (+8.8%), which was helped by respective 27% gains in GE Vernova (GEV) and Rockwell Automation (ROK), followed by Consumer Discretionary (+8.4%).
The YoY Producer Price Index fell one percentage point from 3.37% in March to 2.38% in April (the latest data available) while inflation and core inflation both continue to remain below 3%. The Federal Reserve voted to maintain its key Fed Funds Rate target range of 4.25%-4.50% at the third consecutive FOMC meeting. The price of Gold was virtually unchanged in May, breaking a four-month win streak. However, shares of GLD stayed above $300 for the second straight month.
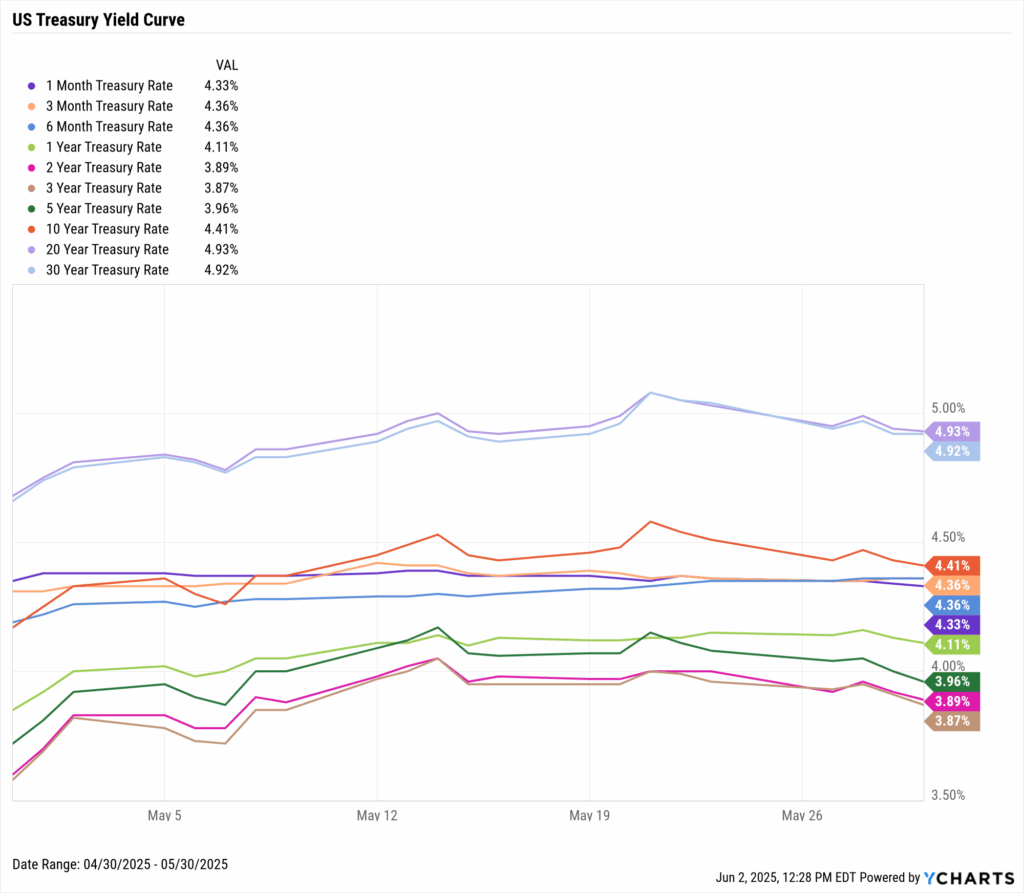
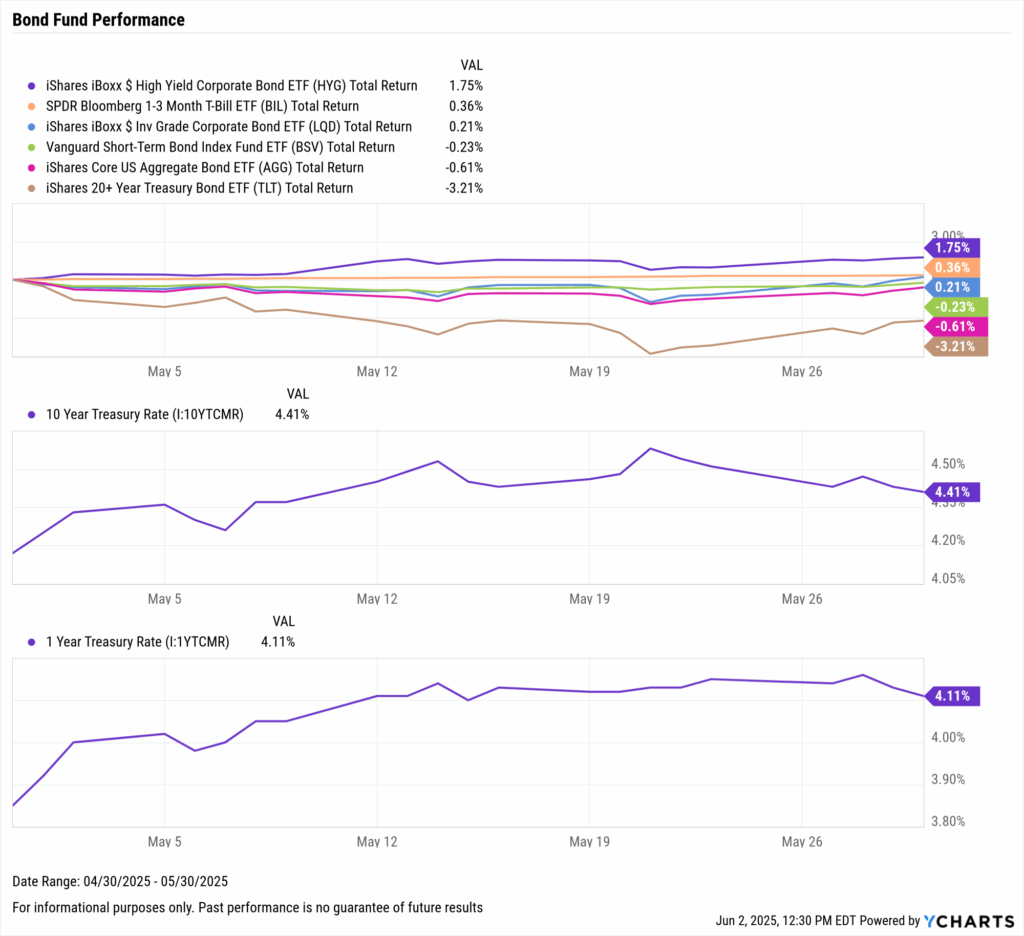
The yield curve steepened in May as rates on all Treasury instruments between 1 and 30 years increased anywhere between 24 and 29 basis points. The 3-month treasury rate increased 5 basis points, and the 1-month fell by 2. Steepening yields caused long-duration bond funds to fall, including the iShares 20+ Year Treasury Bond ETF (TLT) which declined 3.2%.
Jump to Fixed Income Performance
Want to create your own monthly recap, complete with these charts in a presentation deck that contains your firm’s branding? Start a Free Trial →
Off the YCharts! US Consumer Sentiment Index Plummets to Third-Lowest Level Ever
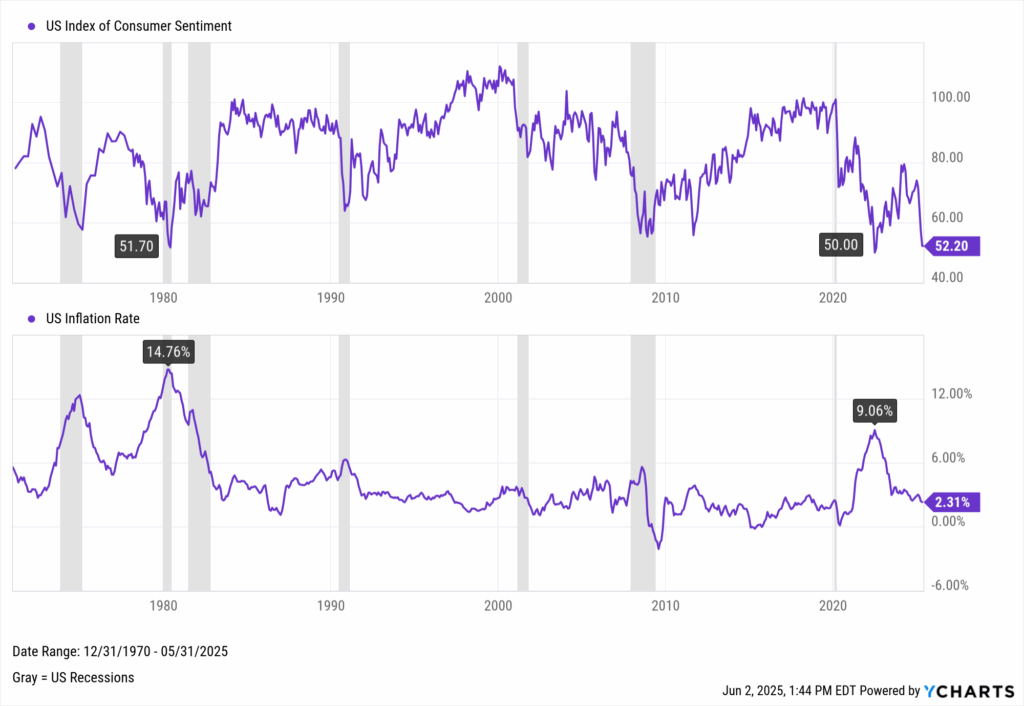
Though it was a big month for equities, consumer sentiment greatly soured this month. The US Index of Consumer Sentiment fell to 52.20 in May 2025, its third lowest level on record, just higher than May 1980 (51.70) and June 2022 (50.00).
Notably, high inflation occurred during the latter two periods, and consumer sentiment index improved once inflation cooled down in both instances. But despite inflation staying below 3% throughout 2025, the index has nosedived from 74.00 in December 2024 to 52.20.
Download Visual | Modify in YCharts
Equity Performance: Equities Rally Across the Board, Nasdaq Composite Up Almost 10% in May
Major Indices
Download Visual | Modify in YCharts | View Below Table in YCharts
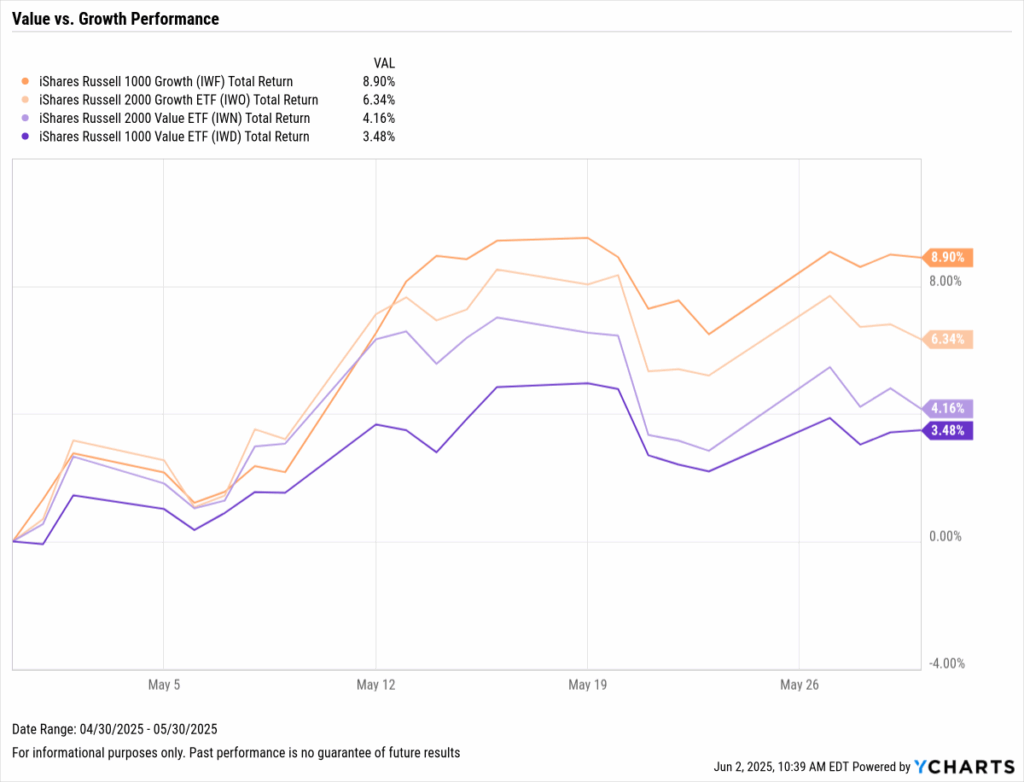
Value vs. Growth Performance
Download Visual | Modify in YCharts | View Below Table in YCharts
US Sector Movement
Download Visual | Modify in YCharts | View Below Table in YCharts
Hot Stocks: Top 10 S&P 500 Performers of May 2025
Download Visual | Modify in YCharts
Laggards & Losers: 10 Worst S&P 500 Performers of May 2025
Download Visual | Modify in YCharts
Featured Market News and YCharts Insights
Use Holdings Overlap to Answer, “What Makes You Different?”
Why Treasury Yields Are Spiking and What It Means for Your Portfolio
April 2025 Fund Flows: Where Money Moved During Market Mayhem
Propose with Precision: Portfolio Recommendations at the Household Level
The 10 Best Performing ETFs Over the Last 10 Years
Introducing the New Yield Curve Tool on YCharts: Analyze Interest Rates with Clarity
Economic Data Overview: Gold Breaks Four-Month Win Streak, Fed Funds Rate Stays Unchanged, Crypto Soars
Employment
The unemployment rate was unchanged in April at 4.2%, and the labor force participation rate inched higher for the second-straight month, up to 62.6%. Nonfarm payroll data showed that the U.S. economy added 177,000 jobs in April, lower than the downwardly revised 185,000 in March but higher than the Dow Jones estimate of 133,000.
Consumers and Inflation
The US inflation rate fell to 2.31% in April, while core inflation came in virtually unchanged MoM at 2.78%. The US Consumer Price Index MoM rose by 0.2% after contracting in March for the first time since May 2020, and US Personal Spending increased 0.23%.
The Federal Reserve maintained its key Fed Funds Rate target range of 4.25%-4.50% at the FOMC’s May 7th meeting, the third consecutive meeting in which it has voted to do so. The next meeting will take place on June 18th, where investors again anticipate the target range to remain unchanged, according to the CME FedWatch tool.
Production and Sales
The US ISM Manufacturing PMI fell by 0.2 points in April to 48.5, keeping the index in contraction territory for the third consecutive month. However, the Services PMI rebounded 0.8 points between March and April, bringing its latest reading up to 51.60. The YoY US Producer Price Index declined drastically from 3.37% in March to 2.38% in April, while US Retail and Food Services Sales rose slightly MoM between March and April.
Housing
US New Single-Family Home Sales surged 10.9% higher MoM in April, though Existing Home Sales contracted slightly by 0.5% MoM. The Median Sales Price of Existing Homes grew 2.7% in April to $414,000, retaking the same level as August 2024, but remains 3% off its all-time high. Mortgage rates continued to stay relatively stable in May as they have throughout 2025; the 15-year Mortgage Rate was 6.03% as of May 29th, while the 30-year came in at 6.89%.
Commodities
The price of gold was relatively flat in May, breaking a four-month win streak and causing the SPDR Gold Shares ETF (GLD) to finish the month at $303.60 per share, just 1.37% below its all-time high. Oil prices rebounded following a sharp decline in April; the price of Brent crude rose 1.5% MoM to $64.32 per barrel as of May 27th, while the price of WTI increased 3.5% to $61.61 per barrel as of the same date. As a result, the average price of gas rose three cents MoM to $3.29 per gallon.
Cryptocurrencies
Major cryptocurrencies posted strong rallies in May. Bitcoin surged 10.4% in May to end the month at $104,010.90, setting a new all-time high and bringing the asset class up 12.3% YTD. Ethereum jumped 40.5% in May to $2,524.48 as of May 31st, though the second-largest cryptocurrency by market cap remains down 24.9% YTD and 45.3% below its all-time high.
Fixed Income Performance: Insights into Bond ETFs and Treasury Yields
US Treasury Yield Curve
1 Month Treasury Rate: 4.33%
3 Month Treasury Rate: 4.36%
6 Month Treasury Rate: 4.36%
1 Year Treasury Rate: 4.11%
2 Year Treasury Rate: 3.89%
3 Year Treasury Rate: 3.87%
5 Year Treasury Rate: 3.96%
10 Year Treasury Rate: 4.41%
20 Year Treasury Rate: 4.93%
30 Year Treasury Rate: 4.92%
Download Visual | Modify in YCharts
Bond Fund Performance
Download Visual | Modify in YCharts | View Below Table in YCharts
Stay updated with the latest market trends, economic data, and financial analysis with YCharts, your go-to source for financial insights and advisor tools. Download the visual aids directly from YCharts, and contact us for customized access to these charts.
Have a great June! 📈
Whenever you’re ready, there are 3 ways YCharts can help you:
1. Looking for a tool to help you better communicate market events?
Send us an email at hello@ycharts.com or call (866) 965-7552. You’ll be directly in touch with one of our Chicago-based team members.
2. Want to test out YCharts for free?
Start a no-risk 7-Day Free Trial.
3. Download a copy of the Monthly Market Wrap slide deck:
Disclaimer
©2025 YCharts, Inc. All Rights Reserved. YCharts, Inc. (“YCharts”) is not registered with the U.S. Securities and Exchange Commission (or with the securities regulatory authority or body of any state or any other jurisdiction) as an investment adviser, broker-dealer or in any other capacity, and does not purport to provide investment advice or make investment recommendations. This report has been generated through application of the analytical tools and data provided through ycharts.com and is intended solely to assist you or your investment or other adviser(s) in conducting investment research. You should not construe this report as an offer to buy or sell, as a solicitation of an offer to buy or sell, or as a recommendation to buy, sell, hold or trade, any security or other financial instrument. For further information regarding your use of this report, please go to: ycharts.com/about/disclosure
Next Article
Trade War Escalation in 2025: Portfolio Moves Amid Trump's Tariff ThreatsRead More →