Monthly Market Wrap: April 2022
Welcome back to the Monthly Market Wrap from YCharts, where we review and break down the most important market trends for advisors and their clients every month. As always, feel free to download and share any visuals with clients and colleagues, or on social media.
Want the Monthly Market Wrap sent straight to your inbox? Subscribe below:
Are you based in Canada or following Canadian markets? Check out and subscribe to the Monthly Canada Market Wrap from YCharts.
April 2022 Market Summary
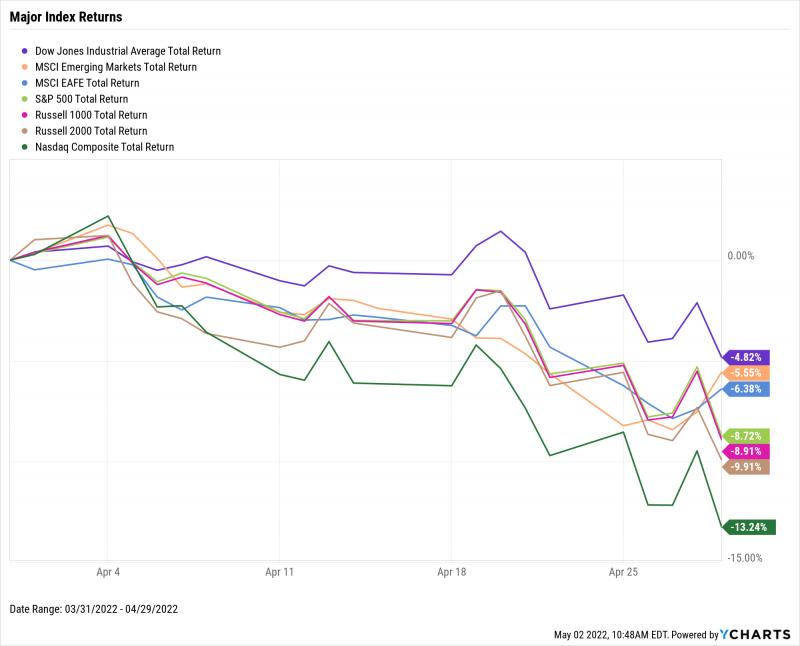
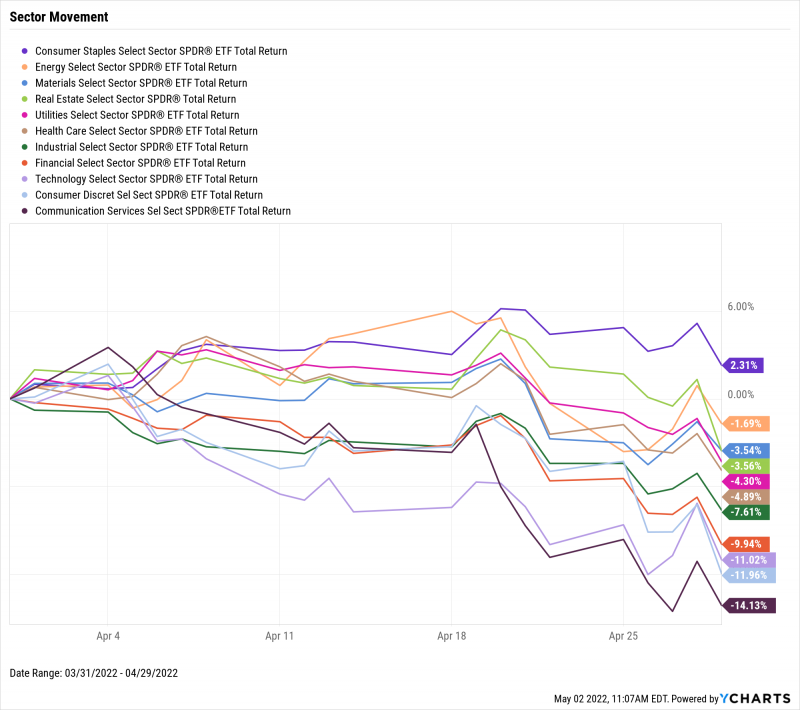
Equities returned to their losing ways in April after a slight March reprieve, with the S&P 500 falling 8.7% and the growth-heavy NASDAQ diving 13.2%. While only one sector ended March in the red, only the defensive-oriented Consumer Staples was able to finish higher in April, up 2.3%. The cyclical sectors, Technology, Consumer Discretionary, and Communication Services, were all down double digits. Year to date, the Dow is down 8.7%, the S&P 500 is 12.9% lower, and the NASDAQ is in bear market territory at -21%.
Oil slipped below $100 for the first time in weeks, now $99.60 per barrel of WTI and $99.27 per barrel of Brent Crude. Speaking of firsts, the economy contracted for the first quarter since Q2 2020, with US Real GDP declining 1.4% (by definition, two consecutive quarters of GDP decline = a recession). Finally, new single-family home sales fell 8.6% last month, while the average selling price of an existing home hit an all-time high.
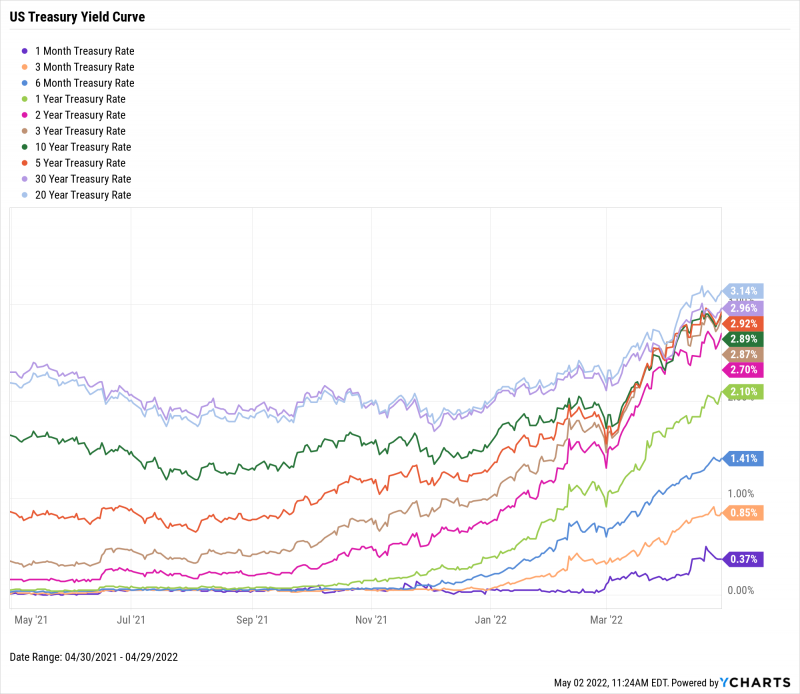
The 20-Year Treasury Rate topped 3% for the first time since March 2019, outpacing the 30-Year bond by 28 basis points. As yields ticked higher, investors fled from stocks in fear of persistently high inflation and a break-neck schedule of Fed rate hikes. The yield curve grew closer to normalization in April, with only the 30-20 and 10-5 Year Treasury spreads remaining inverted at month’s end.
Jump to Fixed Income Performance
Off the YCharts! Mega Cap Meltdown
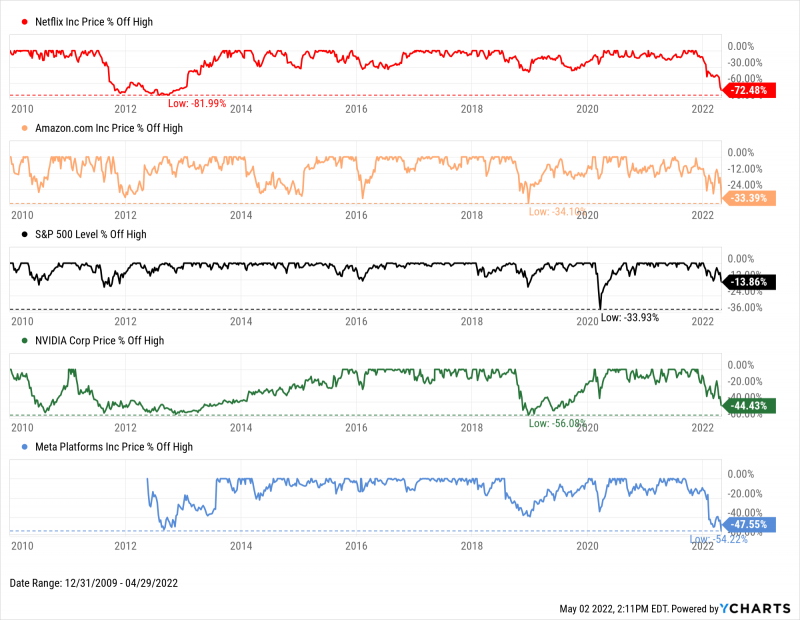
As we point out in our new White Paper, The Real Impact of Mega Cap Stocks on Your Portfolio and the Market, a handful of companies have greatly influenced the direction of the overall stock market in the last decade.
That phenomenon is proving exceptionally true so far in 2022, but for all the wrong reasons. Each of the eight companies examined in our white paper are currently down worse than the S&P 500, but Netflix (NFLX), Amazon (AMZN), NVIDIA (NVDA), and Meta Platforms (FB) have sold off the most. Both Amazon and Meta Platforms are flirting with their largest drawdowns in the last decade, representing a combined $1.16 trillion loss in value. Netflix has retraced 72.5% from its most recent all-time high, while semiconductor designer NVIDIA is 44.4% lower.
Can the S&P 500 recover with the help of its other 497 constituents, or will the index keep falling as long as “mega cap” stocks continue to sink?
Download Visual | Modify in YCharts
Equity Performance
Major US Indexes
Download Visual | Modify in YCharts
Value vs. Growth Performance, Trailing Twelve Months
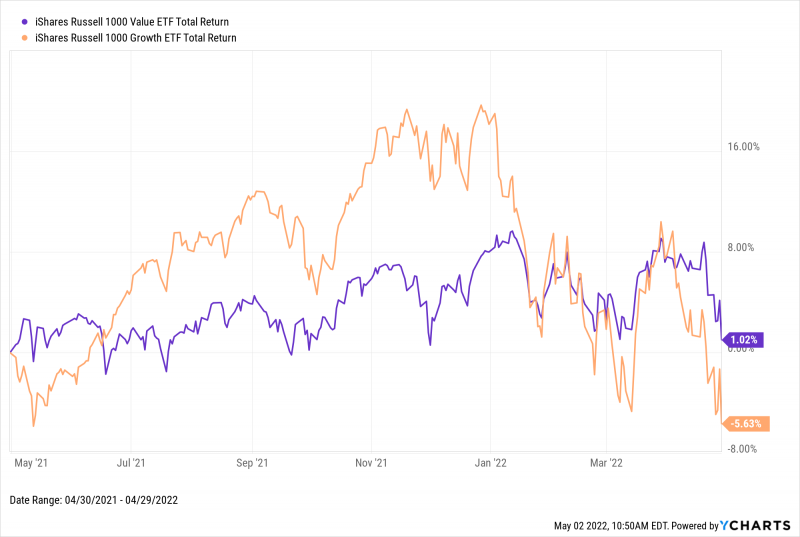
Back in March, the iShares Russell 1000 Growth ETF (IWF) was outperforming Value (IWD) on a trailing twelve-month basis, 14.9% to 11.4%. In April, the tables not only turned, but growth’s year-over-year return as of April 2022 dropped to -5.6%. Value is up just 1% over the last twelve months.
In April alone, iShares’s Russell 1000 Growth ETF fell 12.4%, while its Value ETF counterpart was down less than half of that.
Download Visual | Modify in YCharts
US Sector Movement
Download Visual | Modify in YCharts
Hot Stocks: Top 10 S&P 500 Performers of April 2022
Twitter (TWTR): 26.7% gain in April
Mohawk Industries (MHK): 13.6%
Kimberly-Clark (KMB): 12.7%
Bath & Body Works (BBWI): 10.7%
Lamb Weston Holdings (LW): 10.3%
Ross Stores (ROST): 10.3%
Sherwin-Williams (SHW): 10.2%
Valero (VLO): 9.8%
LKQ Corp (LKQ): 9.3%
United Airlines Holdings (UAL): 8.9%

Download Visual | Modify in YCharts
Laggards & Losers: 10 Worst S&P 500 Performers of April 2022
Netflix (NFLX): -49.2% decline in April
Align Technology (ALGN): -33.5%
NVIDIA (NVDA): -32.0%
Match Group (MTCH): -27.2%
Warner Bros. Discovery (WBD): -27.2%
Generac Holdings (GNRC): -26.2%
Etsy (ETSY): -25.0%
PayPal Holdings (PYPL): -24.0%
Amazon.com (AMZN): -23.8%
West Pharmaceutical Services (WST): -23.3%

Download Visual | Modify in YCharts
Economic Data
Employment
March’s unemployment rate was 3.6%, officially falling back to pre-pandemic levels. However, the labor force participation rate of 62.4% remains a full percentage point below its February 2020 print. Weekly new claims for unemployment fell further to 180,000 for the week of April 23rd, which is just 18,000 above its all-time low achieved in November 1968. Jobless claims reached a multi-decade low of 168,000 in the first week of April.
Production and Sales
US Real GDP (US GDP adjusted for inflation) declined 1.4% in Q1 2022. This marks the first quarterly decline in gross domestic product since Q2 2020. The US ISM Manufacturing PMI slowed for the second straight month, from 57.1 to 55.4 in April, but is still in the expansion territory of 50 or greater.
Housing
The number of US New Single-Family Houses Sold fell another 8.6% in March, marking a third straight monthly decline and the largest in a year. Weakened demand for housing also showed up in Existing Home Months’ Supply, which rose 0.3 points to 2.0. However, an increase in supply didn’t stop the US Existing Home Average Sales Price from reaching an all-time high of $387,100 at the end of March.
Consumers and Inflation
March’s year-over-year US Inflation rate set another 40-year high of 8.5%, while the US Core Inflation Rate did the same, now 6.5%. This marks the seventh straight monthly increase for both headline and Core inflation. The US Consumer Price Index jumped 1.2% in March, which is the first MoM increase of 1% or more since June 2008. Nevertheless, consumers are opening their pocketbooks further, according to the consumer spending (PCE) increase of 0.90% in March.
Gold
The price of Gold in USD ended April slightly lower, at $1,911.30 per ounce. Despite little price movement in gold, rising inflation, and declining purchasing power, the SPDR Gold Shares ETF (GLD) still fell 2.1% in April. The VanEck Gold Miners ETF (GDX) also tumbled 8.8%.
Oil
Oil fell below $100 for the first time in 2-3 weeks. The Daily Spot Price of WTI was $99.60 per barrel as of April 25th, while Brent sat at $99.27. From their respective highs on March 8th, WTI is currently 19.4% lower, and Brent is down 25.5%.
Cryptocurrencies
As with equities, the prices of major cryptocurrencies fell sharply in April. One Bitcoin was worth $38,651 as of April 30th, representing a monthly decline of 17.9%. Ethereum ended April 16.7% lower, at $2,817. Cardano had the worst April, tumbling 32.3% in April to 80 cents per coin. It has been six months since Ethereum and Bitcoin logged a new high—they have drawn down 39.1% and 41.2% respectively, while Cardano is 71.6% off of its all-time high.
Featured Market & Advisor News
U.S. Economy Posts Surprise Contraction, Belying Solid Consumer Picture (FA-Mag)
How Oil and Gas Prices Impact the Economy (YCharts)
Global bonds set for worst ever month before burst of rate hikes (InvestmentNews)
Q1 2022 Fund Flows: March Buyers Bring April Sellers? (YCharts)
CFA Level II Pass Rate Remains Higher at 44% as Disruptions Wane (WealthManagement.com)
Economic Update — Reviewing Q1 2022 (YCharts)
Fixed Income Performance
US Treasury Yield Curve
1 Month Treasury Rate: 0.37%
3 Month Treasury Rate: 0.85%
6 Month Treasury Rate: 1.41%
1 Year Treasury Rate: 2.10%
2 Year Treasury Rate: 2.70%
3 Year Treasury Rate: 2.87%
5 Year Treasury Rate: 2.92%
10 Year Treasury Rate: 2.89%
20 Year Treasury Rate: 3.14%
30 Year Treasury Rate: 2.96%
Download Visual | Modify in YCharts
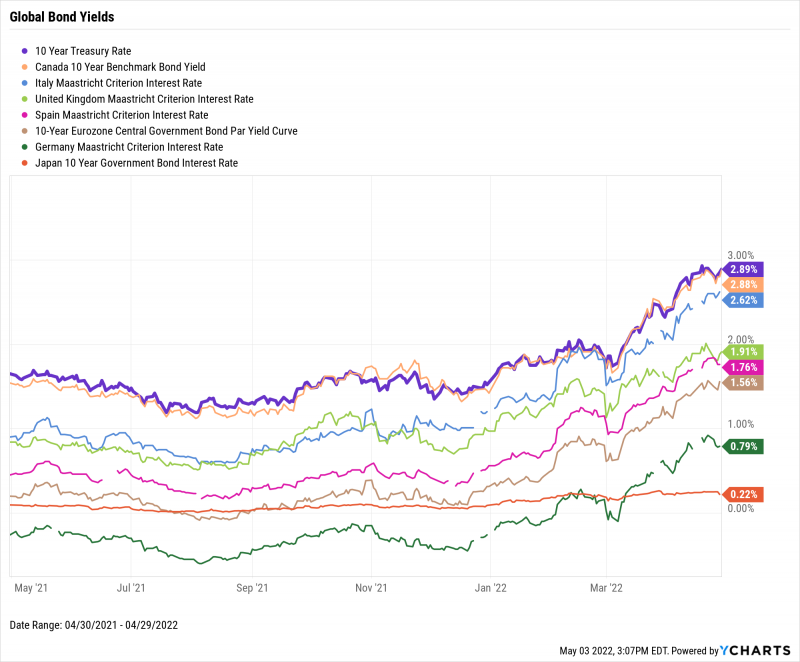
Global Bonds
10 Year Treasury Rate: 2.89%
Canada 10 Year Benchmark Bond Yield: 2.88%
Italy Long Term Bond Interest Rate: 2.62%
United Kingdom Long Term Bond Interest Rate: 1.91%
Spain Long Term Bond Interest Rate: 1.76%
10-Year Eurozone Central Government Bond Par Yield: 1.56%
Germany Long Term Bond Interest Rate: 0.79%
Japan 10 Year Government Bond Interest Rate: 0.22%
Download Visual | Modify in YCharts
Have a great May! 📈
If you haven’t yet, subscribe to the YCharts Monthly Market Wrap here:
Next Article
Monthly Canada Market Wrap: April 2022Read More →
