2024 ETF Market Share Recap

In 2024, the ETF industry was shaken up in many ways. The introduction of Bitcoin ETFs, coupled with the growth of active management strategies and defined outcome (buffer) ETFs, significantly contributed to the industry attracting a record-breaking $1.1 trillion in net inflows.
Despite the prominent role of ETFs in asset accumulation during the year, money market funds emerged as the top draw for new capital, amassing $786 billion in net new assets. Investors flocked to these funds, drawn by yields that were among the highest seen in nearly two decades.
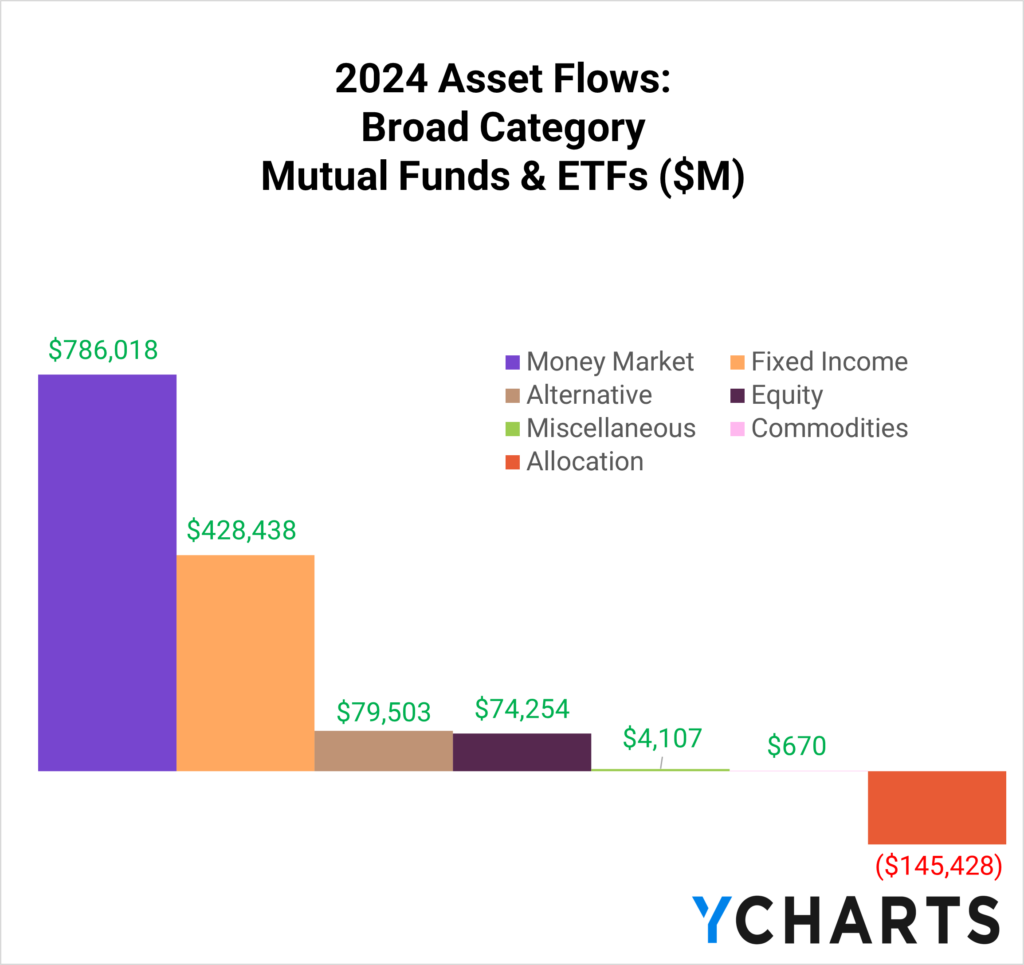
In 2024, fixed income was the second most popular asset class, attracting $428 billion in net flows. Unlike equities, mutual funds in this category maintained positive momentum, with bond-based mutual funds capturing over $177 billion in new assets. However, fixed income ETFs outpaced them significantly, drawing $250 billion. (More on the market share breakdown of Core Bond ETFs below).
Bitcoin ETFs Carry Alternative Strategies in 2024
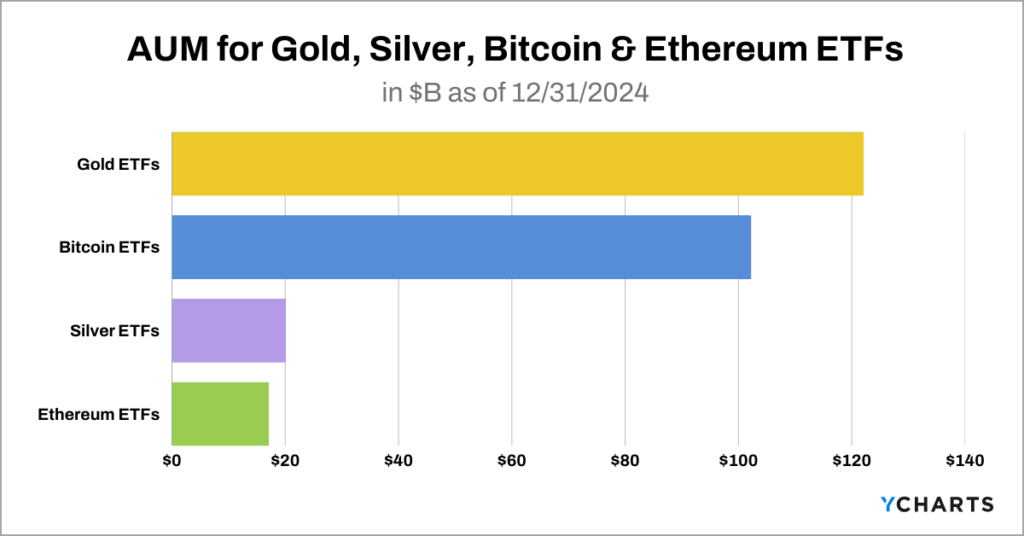
Further down the table, alternative funds experienced a substantial influx of $79.5 billion in net new assets, largely thanks to the SEC’s approval of Bitcoin ETFs on January 11th, followed by other cryptocurrencies later in the year. Despite the intra-year launch, Bitcoin ETFs concluded 2024 with $101.8 billion in assets, surpassing silver ETFs and trailing gold ETFs by approximately $20 billion.
Gold ETFs, which celebrated the 25th anniversary of GLD, the first gold ETF in 2024, reached $122.2 billion in cumulative AUM. Ethereum ETFs, approved by the SEC in July, amassed $7.3 billion in AUM by year-end.
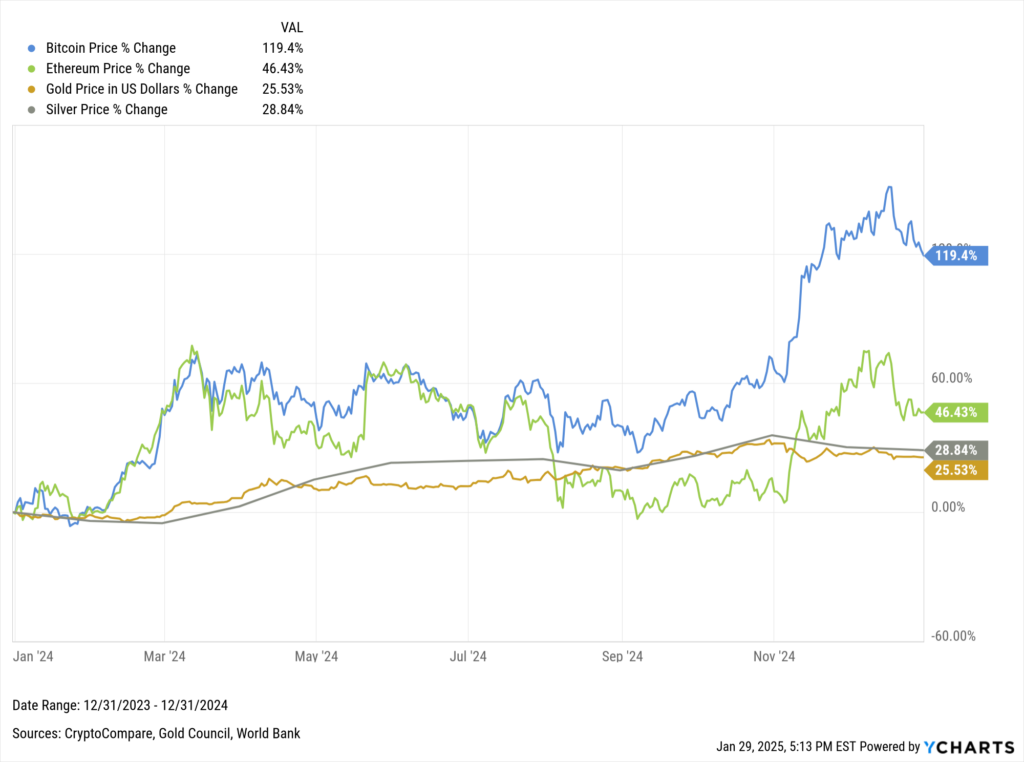
In 2024, Bitcoin ETFs drew $63.5 billion in net flows, accounting for approximately 80% of the $79.5 billion allocated to alternative strategies. This surge, coupled with a 119% increase in Bitcoin’s price over the year, made the launch of Bitcoin ETFs the most successful in ETF history.
Notably, the iShares Bitcoin Trust ETF (IBIT) set records by becoming the fastest ETF to surpass both the ten billion and fifty billion AUM milestones, achieving the former just 50 days post-launch.
Download Visual | View & Modify in YCharts
New ETFs Launched in 2024
While Bitcoin ETFs were the most successful launch of 2024, the ETF market was vibrant elsewhere too. Throughout the year, 692 ETFs were launched (adjust the “Years Since Inception” slider in the screener), with over a quarter of these focusing on options arbitrage strategies, primarily covered call or “buffered” ETFs. These strategies, colloquially dubbed “boomer candy,” are tailored to generate potential income or mitigate downside risk in exchange for a capped upside. This design makes them particularly attractive to investors who want to maintain equity exposure while managing volatility.
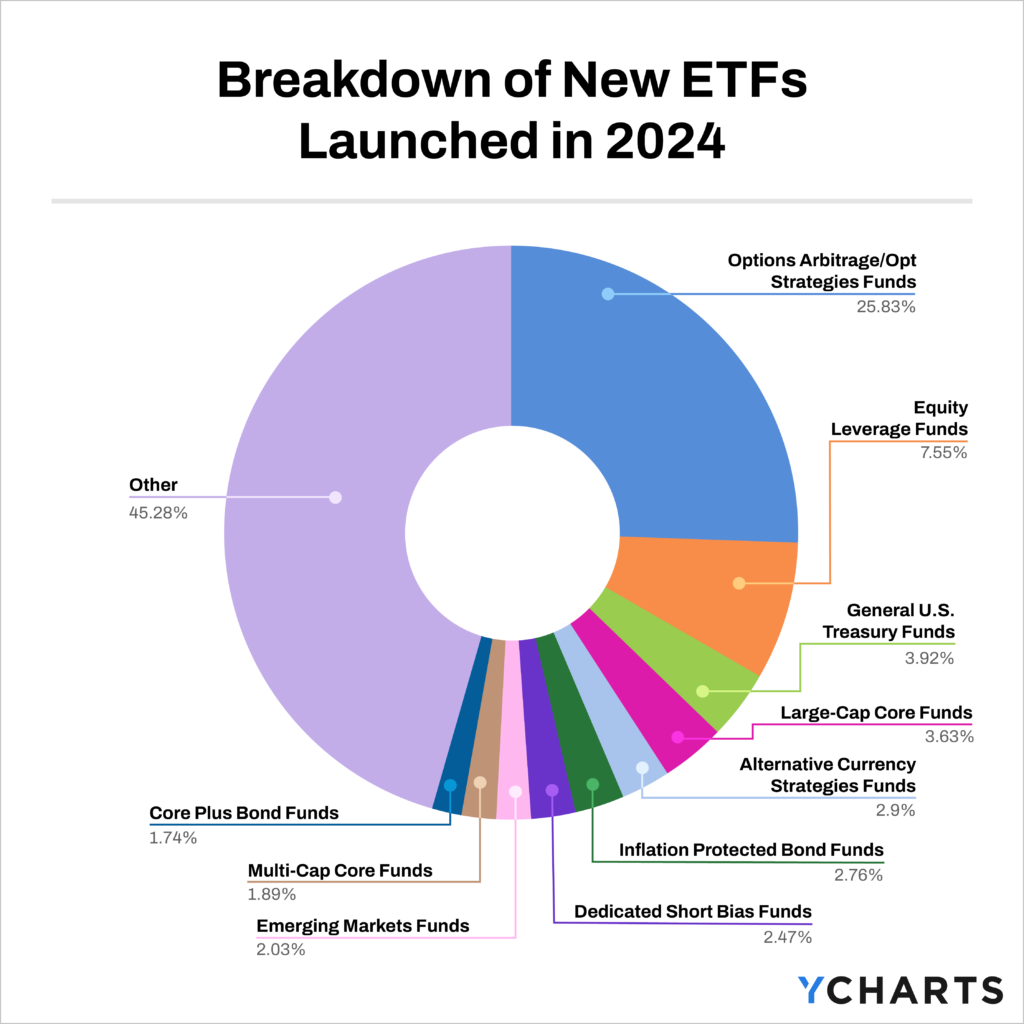
In 2024, the application of covered call and buffered strategies broadened to encompass a wide array of asset classes, including benchmark ETFs, actively selected stocks, and cryptocurrencies. This expansion reflects the growing diversity of assets available for “buffing” or “enhancement.” The further proliferation of buffered strategies, in particular, arose due to their staggered launches based on the “outcome period” or duration of the buffer and the different buffer levels.
Prominent options arbitrage strategies examples include the JPMorgan Equity Premium Income ETF (JEPI) for covered calls and the FT Vest Laddered Buffer ETF (BUFR) for buffered strategies.
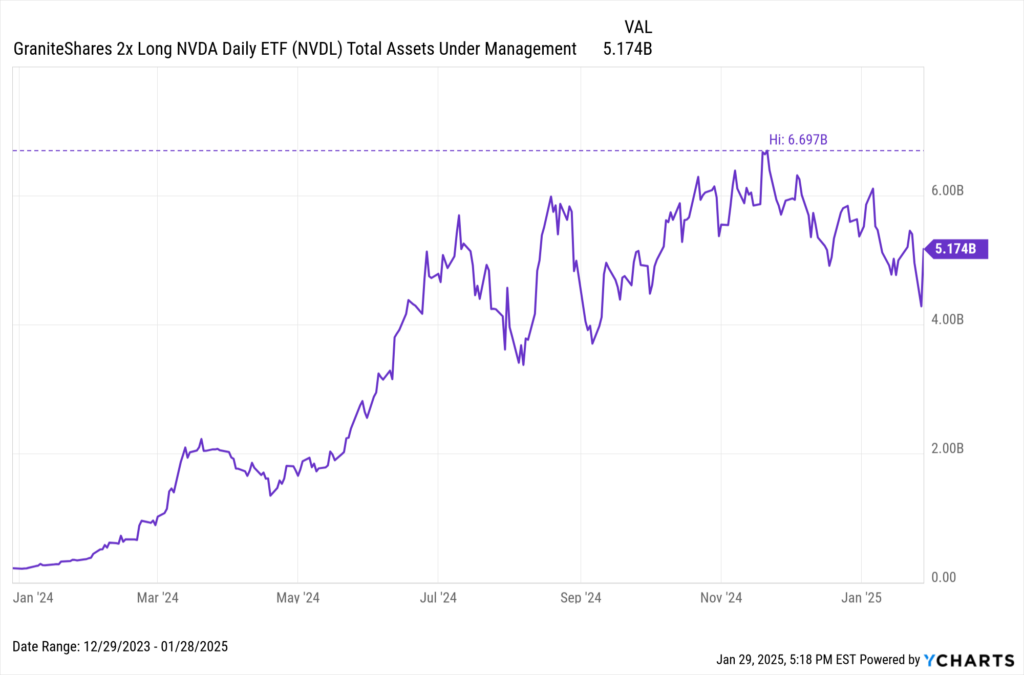
The peer group with the second-most new entrants, Equity Leverage Funds, also proved to be the most controversial. These funds are designed as trading tools for sophisticated investors, offering leveraged multiples (commonly 2x or -2x) of exposure to stocks, cryptocurrencies, or indices.
The biggest name in this group is the ProShares UltraPro QQQ ETF (TQQQ). The single-stock focused GraniteShares 2x Long NVDA Daily ETF (NVDL) saw its AUM peak at $6.7 billion in 2024, but it experienced a significant decline, greatly influenced by the volatility in Nvidia’s stock following developments in AI technology by DeepSeek.
Download Visual | View & Modify in YCharts
Now, onto more traditional finance and fund flow information. Below, we examined the cumulative end-of-year AUM for several peer groups and how market share distribution evolved across these funds from 2023 to 2024.
Core Bond ETF AUM Market Share
As mentioned above, with treasury rates hovering near two-decade highs for much of 2024, it’s unsurprising that over $428 billion in net new assets flowed into fixed-income strategies. Core Bond ETFs were a primary beneficiary of this influx.
The category grew from $275 billion in assets at the end of 2023 to over $335 billion by the close of 2024, representing an increase of approximately 22%.
Download Visual | View the Timeseries in YCharts
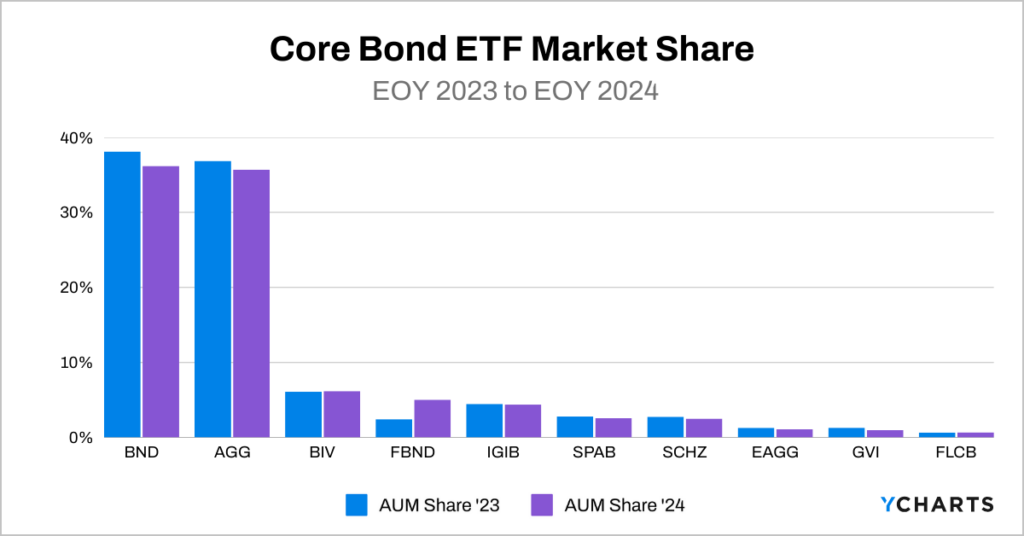
While the top three positions remained unchanged—the Vanguard Total Bond Market Index Fund ETF (BND), iShares Core US Aggregate Bond ETF (AGG), and Vanguard Intermediate-Term Bond Index Fund ETF (BIV) still lead—the competition between BND and AGG intensified. By the end of 2024, the market share gap between the two narrowed considerably, with less than half a percent separating them. BND’s market share decreased to 36.2% from 38.1% in 2023, while AGG’s share dropped slightly to 35.7% from 36.9%.
Among the largest ten funds in the category, the Fidelity Total Bond ETF (FBND) achieved the most notable improvement in market penetration, effectively doubling its share from 2.4% in 2023 to 5% in 2024.
S&P 500 ETF AUM Market Share
The competition for the largest S&P 500 ETF is one of the most closely watched contests in the battle for market share supremacy. Buoyed by the S&P 500’s robust 25% return in 2024, the category’s total assets surged by over $500 billion year-over-year, growing from $1.3 trillion to $1.9 trillion.
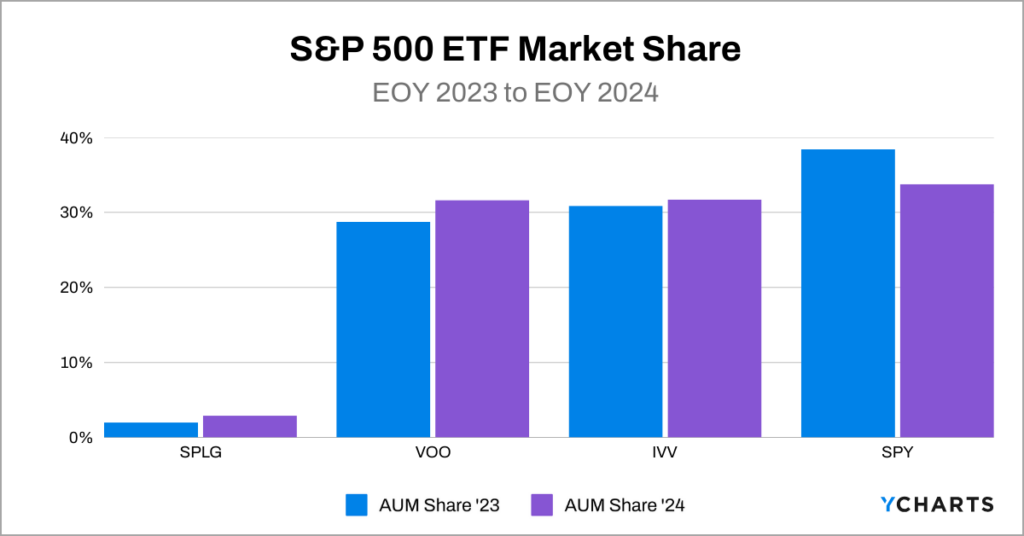
While the contest features a four-way race involving the iShares Core S&P 500 ETF (IVV), SPDR Portfolio S&P 500 ETF (SPLG), SPDR S&P 500 ETF Trust (SPY), and Vanguard 500 Index Fund ETF (VOO), it’s effectively a three-way race. SPLG remains a distant fourth, though it is gaining traction as advisors increasingly adopt separately managed accounts (SMAs) that include it as the S&P 500 position.
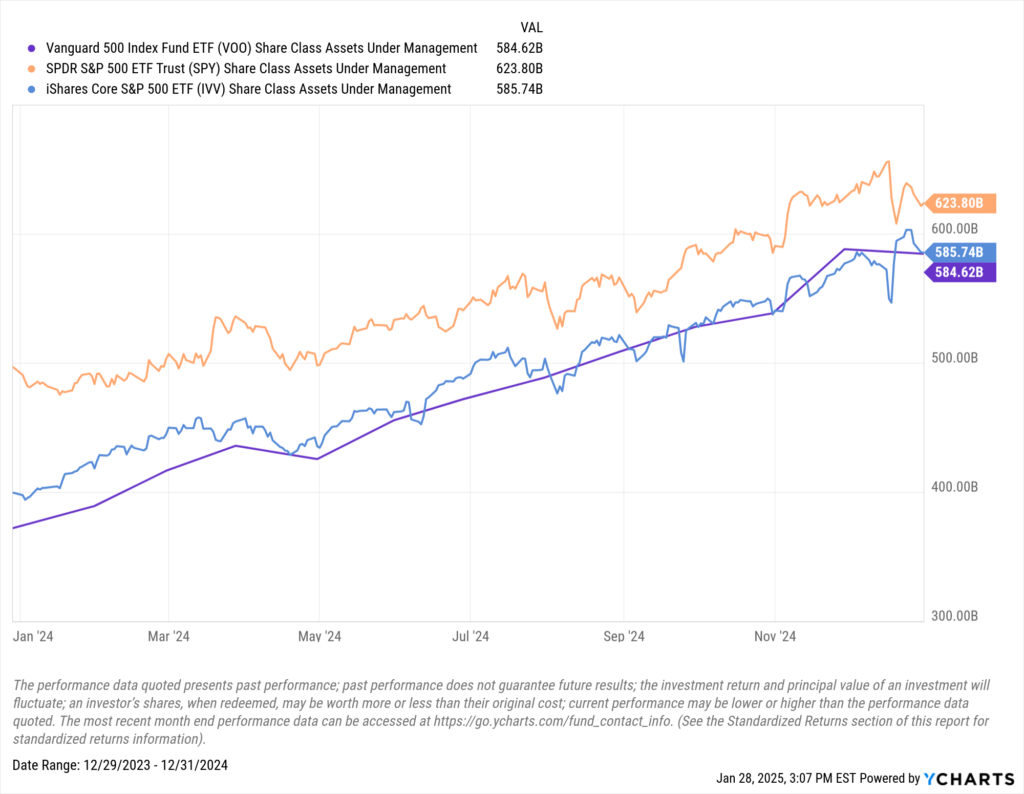
In terms of overall standings, SPY leads with $623.8 billion in assets, up from $497 billion in 2023, although its market share decreased from 38.4% to 33.8%. IVV holds second place with $585.7 billion, up significantly from $399.6 billion, and VOO closely follows, rounding out the top three with $584.6 billion, a substantial increase from $372.1 billion in 2023.
Download Visual | View the Timeseries in YCharts
SPY’s dominance was notably challenged in 2024, primarily because, despite its continued popularity as the preferred fund for trading and underlying option-based strategies, it only attracted approximately $10 billion in net new assets. This figure was half of what SPLG managed to reel in and was significantly overshadowed by the $79.8 billion and $116.2 billion garnered by IVV and VOO, respectively. View the Flow Table here.
Download Visual | View & Modify in YCharts
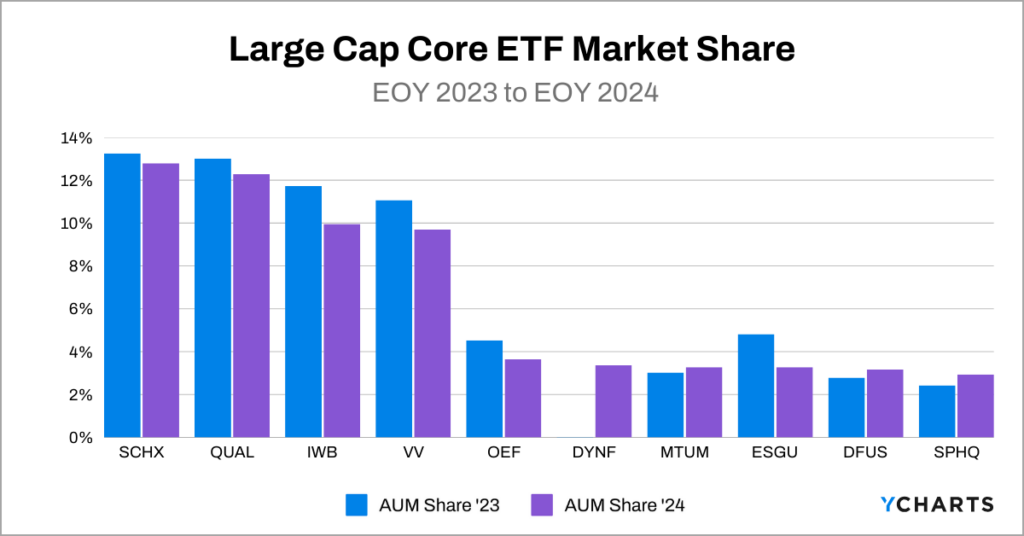
Large Cap Core ETF AUM Market Share
The large cap core ETF space expanded from $277.6 billion to $402.7 billion by the end of 2024, with price appreciation playing a significant role in the category’s 45% increase in AUM.
The Schwab US Large-Cap ETF (SCHX), iShares MSCI USA Quality Factor ETF (QUAL), and the iShares Russell 1000 ETF (IWB) are the market leaders, managing 12.8%, 12.3%, and 10% of the assets, respectively. However, these leaders also lost market share in 2024.
In fact, nine out of the top ten funds in this category lost market share, largely due to the iShares US Equity Factor Rotation Active ETF (DYNF), which surged from virtually 0% to nearly 3.4% of the category’s AUM. This significant growth was primarily driven by its inclusion in several SMAs offered by iShares.
Download Visual | View the Timeseries in YCharts
In 2024, large cap core ETFs saw a substantial influx of net new assets totaling $51.8 billion. Leading the charge was DYNF, which attracted $11.6 billion. This was followed by SCHX with $5.4 billion and QUAL, which brought in $4.9 billion. View the Flow Table here.
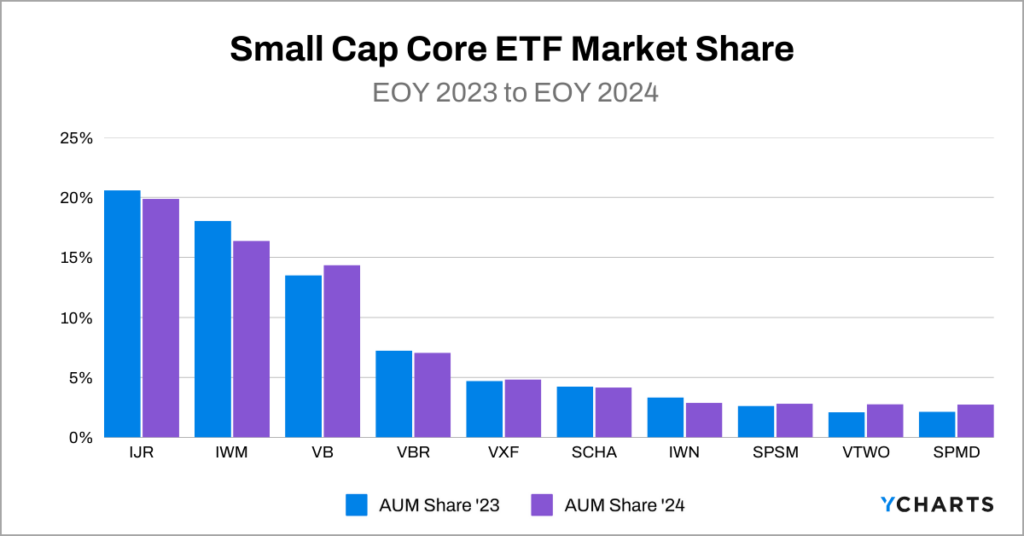
Small Cap Core ETF AUM Market Share
The small cap core ETF market’s assets increased from $363.5 billion to $440.6 billion, representing a 21% year-over-year increase.
In terms of market share dynamics, the leaderboard largely remained unchanged. The iShares Core S&P Small-Cap ETF (IJR) saw a slight decrease in market share, moving from 20.6% to 19.9%. The iShares Russell 2000 ETF (IWM) experienced a more noticeable drop, from 18.1% to 16.4%. Conversely, the Vanguard Small-Cap Index Fund ETF (VB) made gains, increasing its market share from 13.5% to 14.4%.
Download Visual | View the Timeseries in YCharts
In 2024, VB led the small cap core ETFs in asset accumulation, pulling in $5.9 billion. This was followed by IJR, which secured $3.9 billion in net flows. The Vanguard Russell 2000 Index Fund ETF (VTWO) rounded out the top three with $3.6 billion in net inflows for the year.
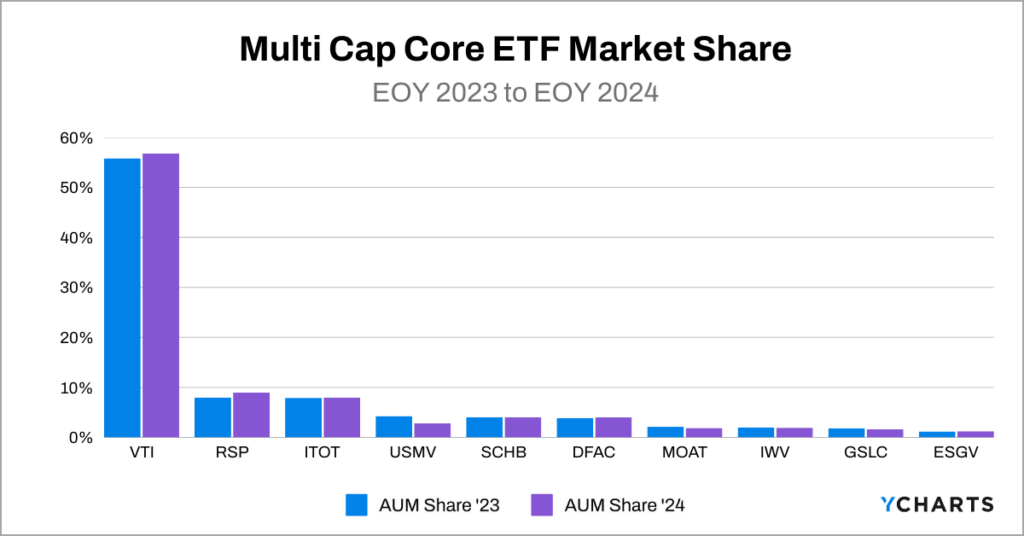
Multi Cap Core ETF AUM Market Share
With concentration risk a major concern for many investors, ETFs in the multi cap core category seemed to be a place of refuge. Multi cap core ETF AUM grew from $623.5 billion to $804.1 billion, marking a 28.97% increase.
In a rare occurrence within a peer group, last year’s leader, the Vanguard Total Stock Market Index Fund ETF (VTI), actually increased its market share, rising from 55.8% to 56.8%. The Invesco S&P 500 Equal Weight ETF (RSP) also expanded its market share, moving from approximately 8% to nearly 9%. Similarly, the iShares Core S&P Total US Stock Market ETF (ITOT) experienced a slight increase in market share as well.
Download Visual | View the Timeseries in YCharts
VTI also led the peer group in 2024 fund flows, drawing in $27.7 billion, which represented approximately 60% of the total $46.5 billion that flowed into the category during the year. RSP secured the second-highest inflows with $16.1 billion, and the DFA Dimensional US Core Equity 2 ETF (DFAC) rounded out the top three, attracting $3.2 billion in net new assets.
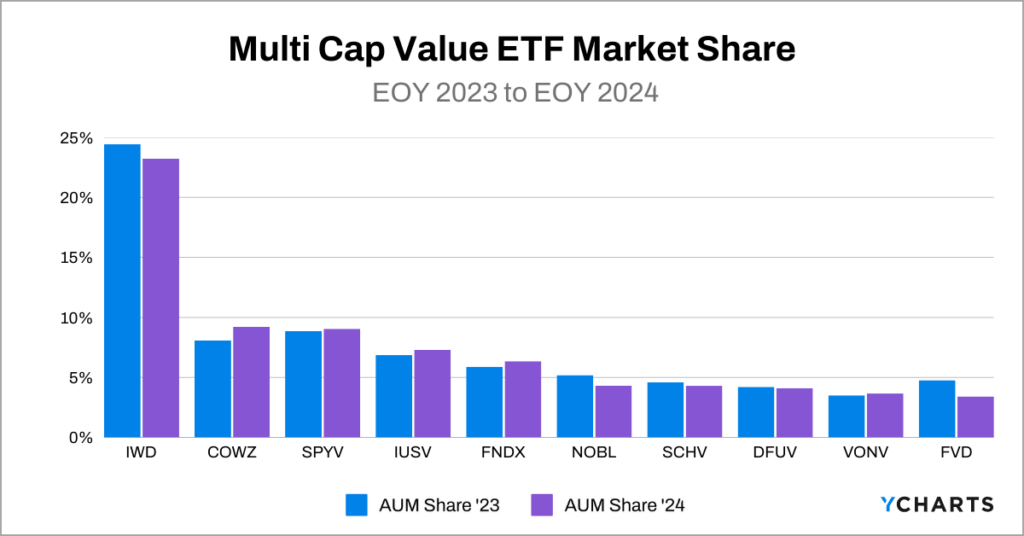
Multi Cap Value ETF AUM Market Share
The multi cap value ETF market expanded from $226.5 billion to $271.3 billion in 2024, marking a near-20% year-over-year increase.
Within the category’s leaderboard, there was some reshuffling. The iShares Russell 1000 Value ETF (IWD) retained its position as the leader, although its market share decreased slightly from 24.4% to 23.2%. The Pacer US Cash Cows 100 ETF (COWZ), known for its free cash flow-based stock-selection process, increased its market share from 8.1% to 9.1%, moving up to second place. Meanwhile, the SPDR Portfolio S&P 500 Value ETF (SPYV) dropped a spot on the leaderboard, despite a marginal increase in market share.
Download Visual | View the Timeseries in YCharts
COWZ was the category’s fund flow leader in 2024, attracting $4.5 billion in net new assets, which represented approximately 28% of the peer group’s $15.7 billion in total inflows. The Avantis US Large Cap Value ETF (AVLV) followed as the second-highest attractor, with $2.5 billion in fund flows. Close behind was the iShares Core S&P US Value ETF (IUSV), which secured $2.2 billion in net new assets.
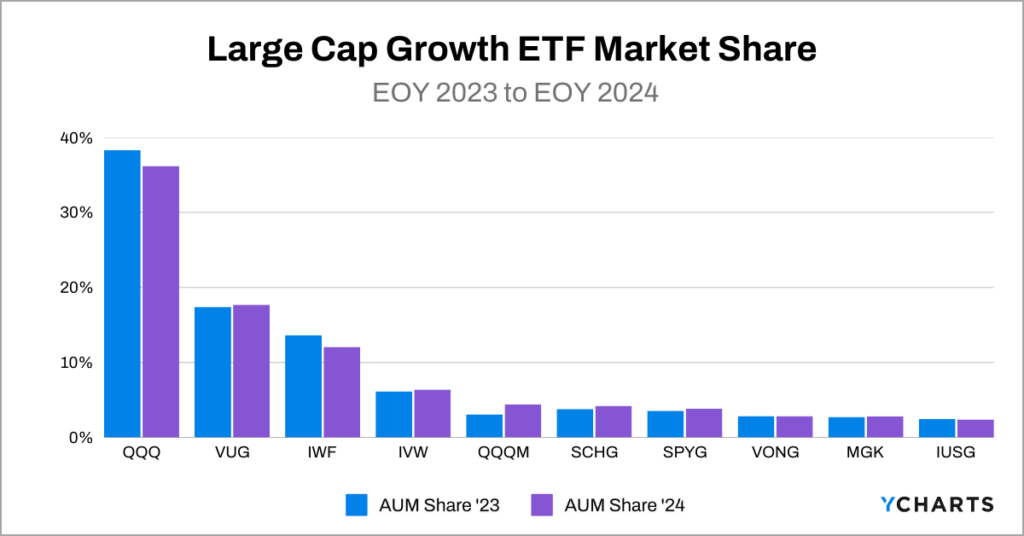
Large Growth ETF AUM Market Share
Driven by substantial gains from major technology companies, as reflected in the Nasdaq-100’s 25.9% return in 2024, the large growth ETF market experienced significant capital appreciation alongside $89 billion in net new assets, expanding from $600.6 billion to $881.6 billion.
In the market share dynamics, the Invesco QQQ Trust (QQQ) saw its dominance slightly diminish, with its market share decreasing from 38.3% to 36.2%. Despite this, QQQ maintained a considerable lead over its closest competitor, the Vanguard Growth ETF (VUG), which slightly increased its market share to 17.7%. Additionally, the Invesco NASDAQ 100 ETF (QQQM), a near-identical product to QQQ but with a lower expense ratio (0.15% compared to QQQ’s 0.20%) due to a different legal structure, increased its market share from 3.1% to 4.4%.
The third-largest fund in the peer group, the iShares Russell 1000 Growth ETF (IWF), also experienced a decrease in market share, falling from 13.6% to 12.1%.
Download Visual | View the Timeseries in YCharts
Unsurprisingly, QQQ led all large growth ETFs by securing $27.5 billion in net inflows in 2024. VUG followed, attracting $15.3 billion in net new assets, securing the second spot. Close behind was QQQM, which rounded out the top three with $14.3 billion in inflows.
With 2024 now behind us, asset managers are poised to reposition their funds to address the primary investor concerns for 2025. For those interested in exploring market share trends across different peer groups, you can use this templated YCharts Timeseries Analysis for the following peer groups: General US Treasury, Equity Income, Mid Cap Core, Mid Cap Growth, Small Cap Growth, Multi Cap Growth, Large Value, Mid Cap Value, Small Cap Value, Emerging Market, Small Cap Core, & Multi Cap Core.
Whenever you’re ready, there are three ways YCharts can help you:
Have questions about how YCharts can help you grow AUM and prepare for meetings?
Email us at hello@ycharts.com or call (866) 965-7552. You’ll get a response from one of our Chicago-based team members.
Unlock access to our Fund Flows Report and Visual Deck by becoming a client.
Dive into YCharts with a no-obligation 7-Day Free Trial now.
Sign up for a copy of our Fund Flows Report and Visual Deck:
Disclaimer
©2025 YCharts, Inc. All Rights Reserved. YCharts, Inc. (“YCharts”) is not registered with the U.S. Securities and Exchange Commission (or with the securities regulatory authority or body of any state or any other jurisdiction) as an investment adviser, broker-dealer or in any other capacity, and does not purport to provide investment advice or make investment recommendations. This report has been generated through application of the analytical tools and data provided through ycharts.com and is intended solely to assist you or your investment or other adviser(s) in conducting investment research. You should not construe this report as an offer to buy or sell, as a solicitation of an offer to buy or sell, or as a recommendation to buy, sell, hold or trade, any security or other financial instrument. For further information regarding your use of this report, please go to: ycharts.com/about/disclosure
Next Article
Economic Update: Reviewing Q4 2024Read More →