
2027 Market Outlook Q&A: The Most Hated Bull Market

Interested in testing out YCharts for free?
Start 7-Day Free TrialTalley Léger has spent 26 years studying markets, and he calls the current rally the most hated bull market of his career. In this 2027 market outlook Q&A, YCharts asked him about AI spending, the risk of a Federal Reserve policy error, investor sentiment, the midterm elections, the national debt, and what each means for advisors and their clients.
The backdrop has moved quickly. On October 28, the Federal Open Market Committee (FOMC) held the federal funds rate at 3.75% to 4.00%, one meeting after its first hike since 2023, with two officials dissenting in favor of another increase. The S&P 500 closed at 7,744, and the 10-year Treasury yield rose to 5.05%.
Table of Contents
2027 Market Outlook Q&A:
The International Monetary Fund (IMF) and others have warned about a market bubble. Will AI capital spending hold up into 2027?
TL: I push back on the bubble metaphor. A bubble implies that share prices are inflated by air, hope, borrowed money, and a story nobody can verify. That is not what I see. Stocks are being supported by booming earnings, and you can see those earnings in the reported numbers every quarter.
Think about how capital spending gets approved. No management team signs off on a bigger capex budget on a hunch. Executives are approving these budgets because sales are growing at double-digit rates, which are ratifying demand. The spending follows the revenues, not the other way around.
What companies are doing right now is engineering their next wave of sales. The AI buildout is an investment in capacity they expect to fill, and so far, earnings and demand are validating that spending. That is why I expect AI investment to continue into 2027.
I am not saying it lasts forever. The day to worry is the day revenue stops showing up to cover the cost of capacity. When that happens, budgets get cut quickly. We are not there yet, and the people closest to the numbers are telling you so with their checkbooks.
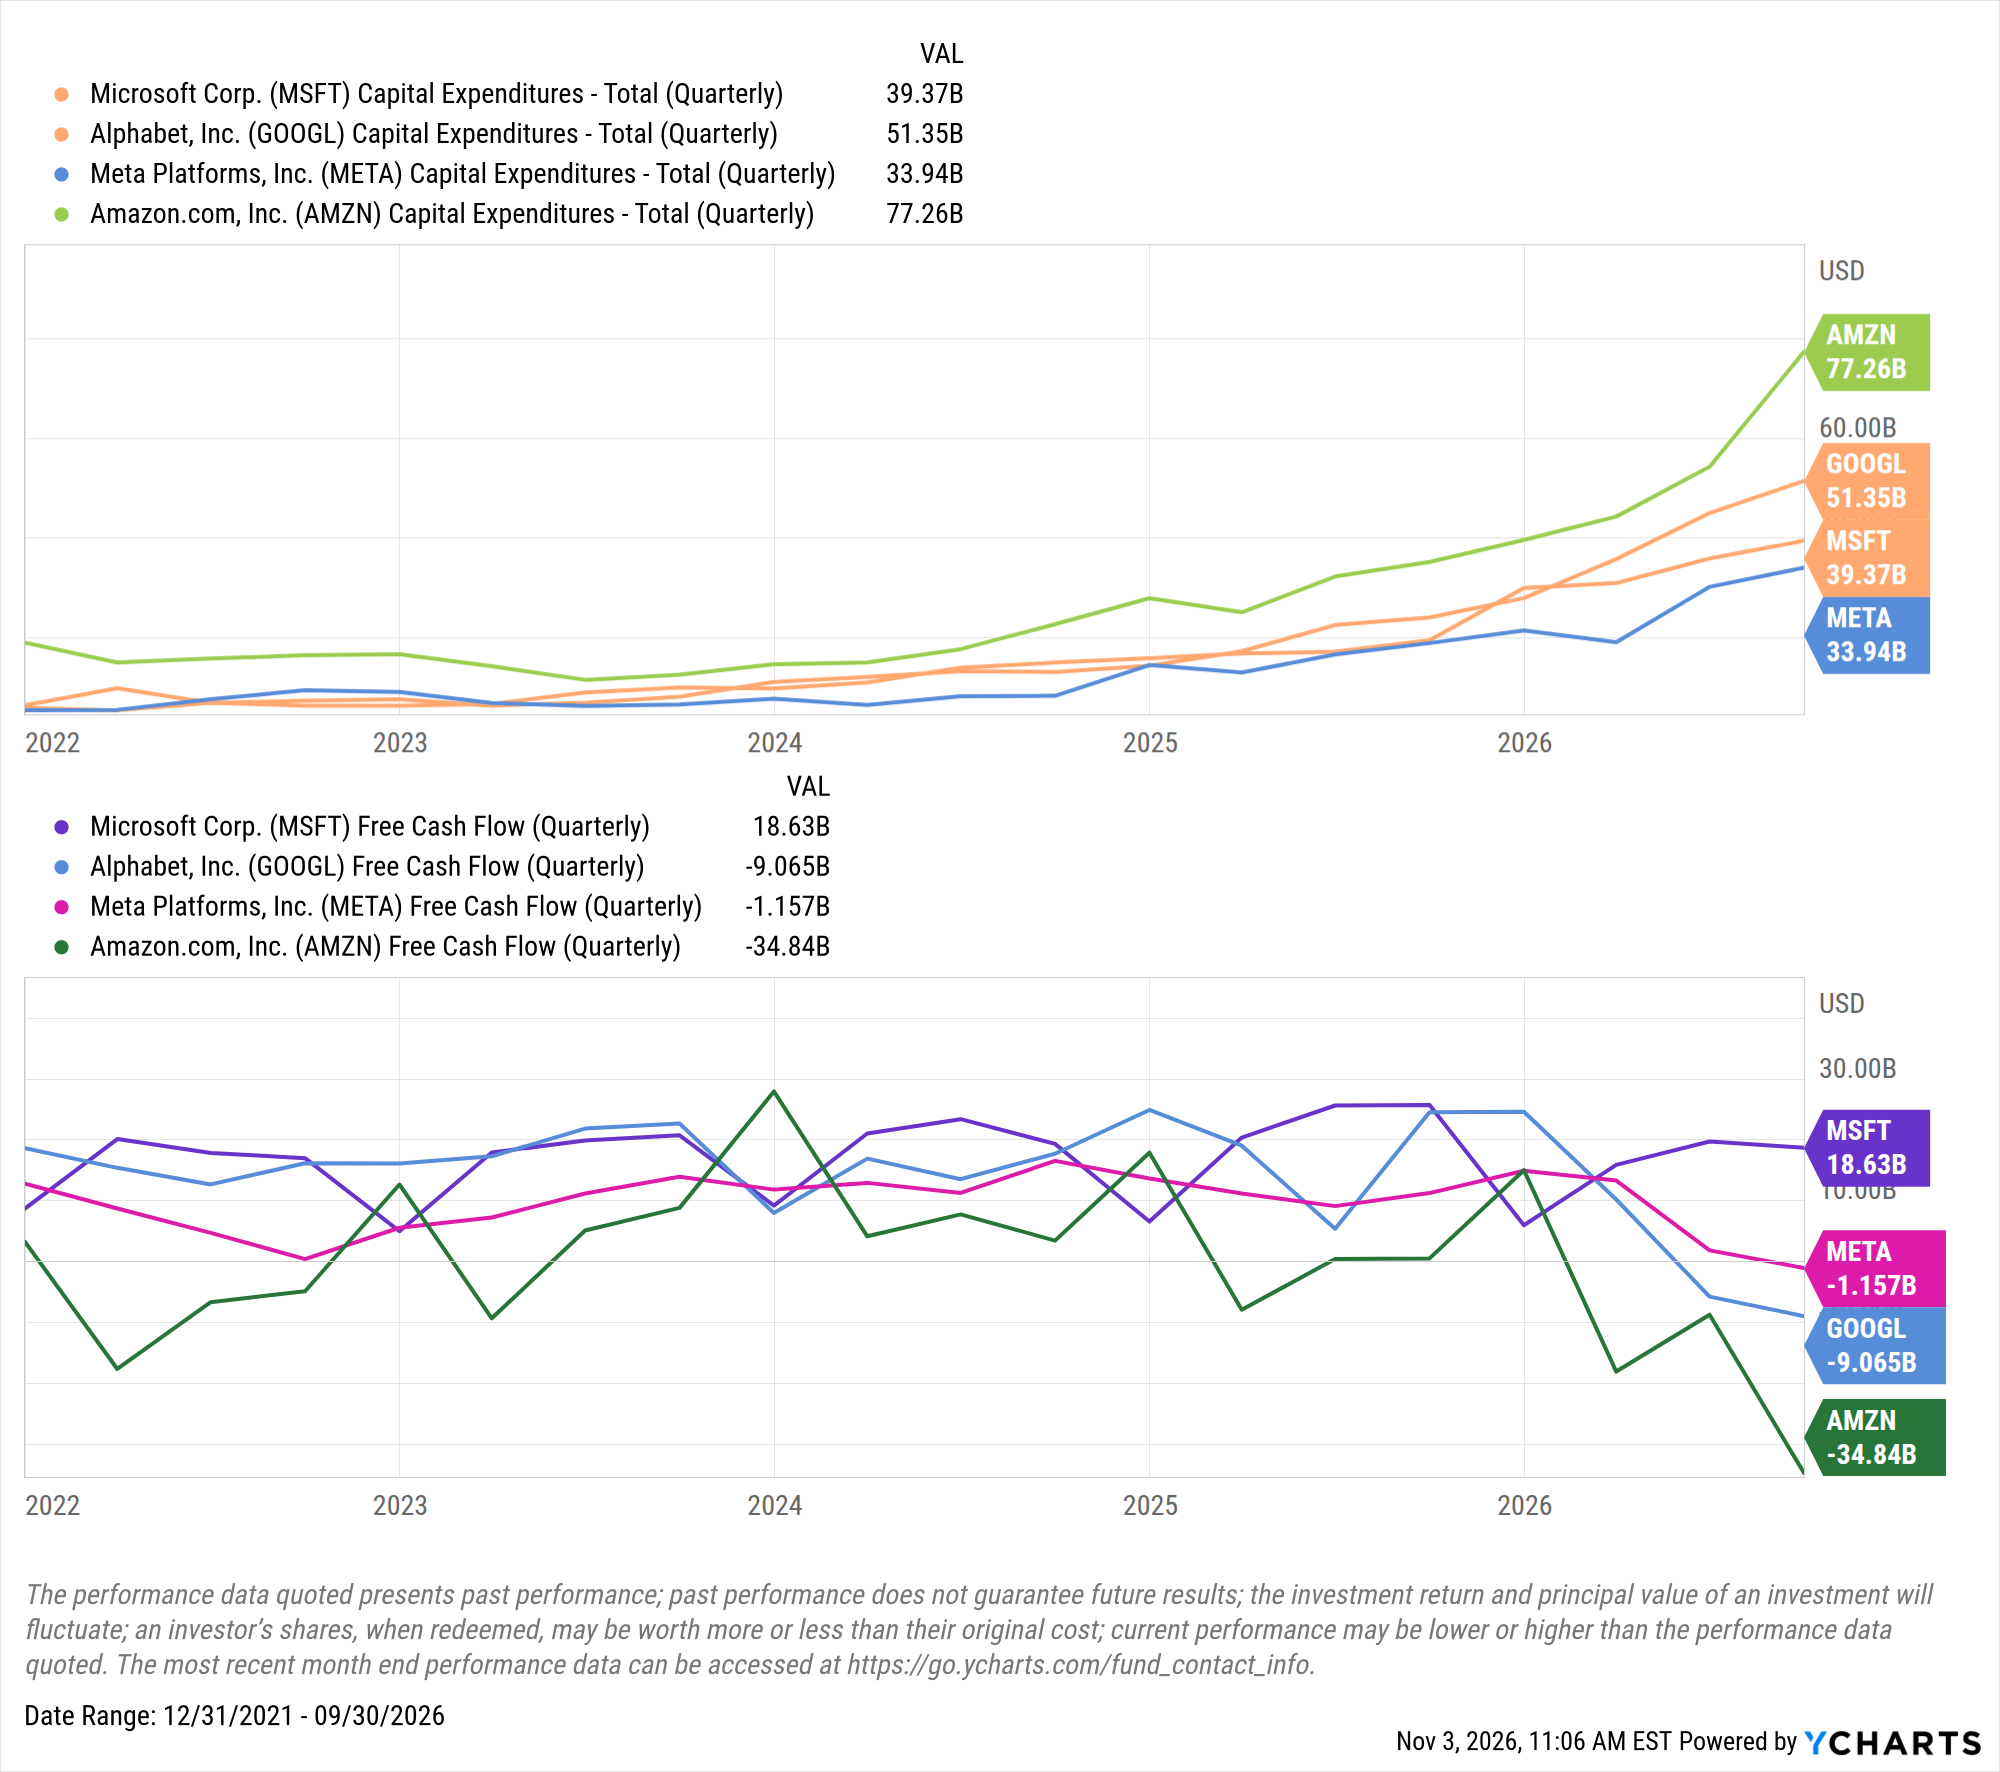
MSFT Capital Expenditures – Total (Quarterly) data by YCharts
The Fed raised rates in September, held in October, and futures are leaning toward another hike in December. How do you read the Fed right now?
TL: My concern is that the Fed commits a policy error. The parallel I keep coming back to is the mid-to-late 1990s under Alan Greenspan. The Fed raised rates in an economy that was not actually overheating, and it did not need to.
Look at what the data are telling us now. Core inflation trends are matching economy-wide capacity utilization. When the economy is pressing up against its limits, you see it in prices, and that is not the picture I see. The economy is running well, but not hot. We are in what I would call a non-inflationary equilibrium.
In that kind of environment, the risk of doing too much is greater than the risk of doing too little. Rate hikes work with a lag. By the time you see the damage, it is already done. Continued rate hikes risk breaking something that does not need fixing, and that is what keeps me focused on the Fed rather than the headlines.
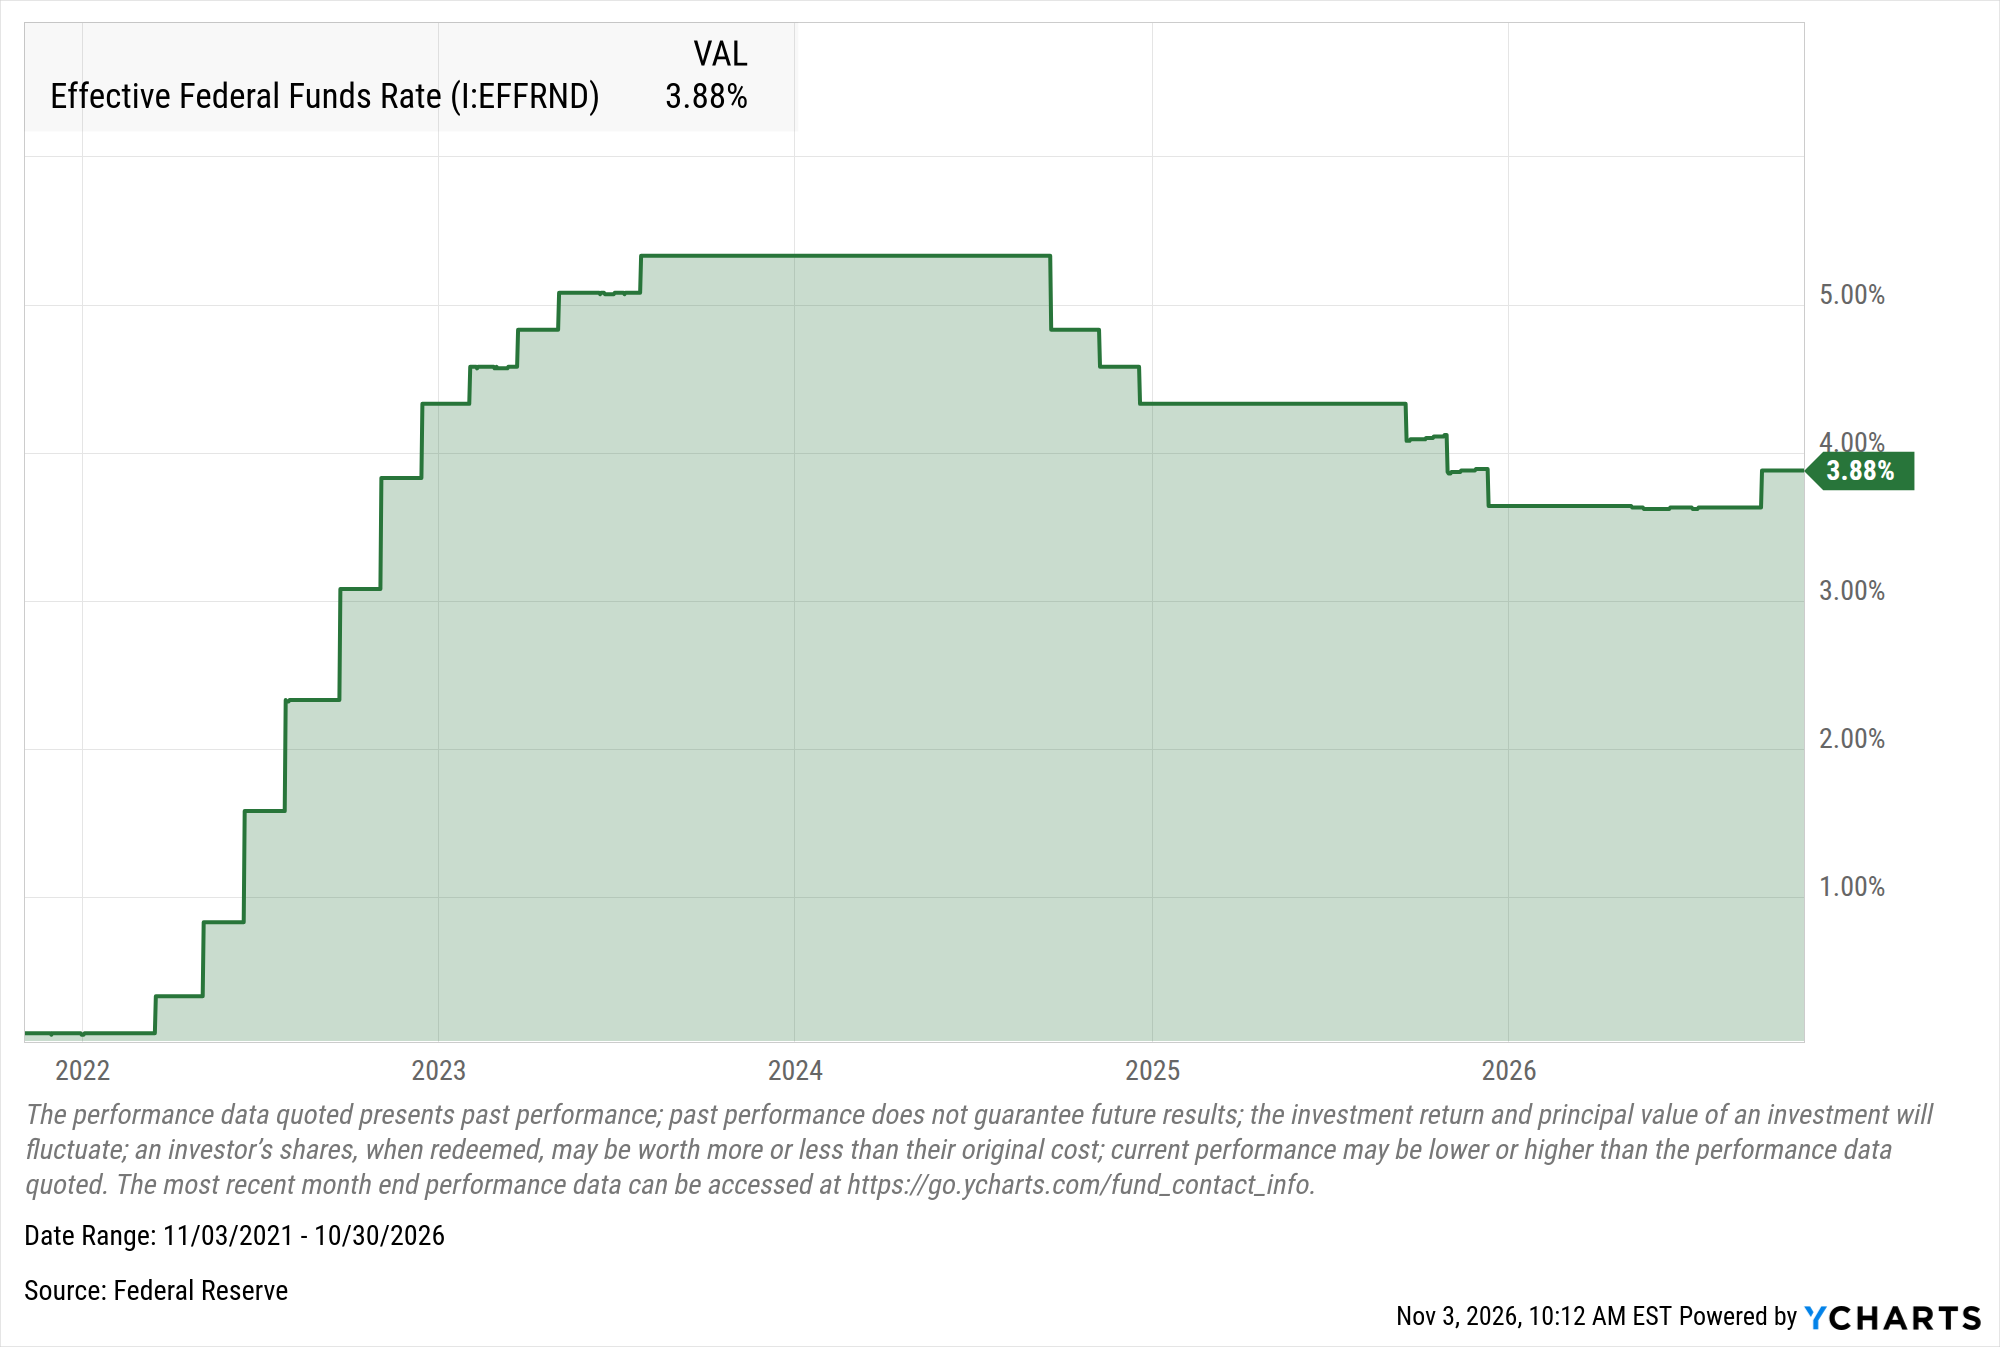
Effective Federal Funds Rate data by YCharts
Looking ahead to 2027, what is the bear case that worries you most?
TL: It is the same answer: A Fed policy error. I get asked about bubbles, about the debt, about the election, and I understand why. Those are the stories people read every day. But none of them would end this bull market, in my view.
The thing that ends expansions is usually the cost of money getting too high for the economy to carry. That is a decision the Fed makes, and it is the one variable I would have every advisor watch as we head into 2027. If the Fed overtightens, it risks making a policy mistake that could damage fragile areas of the credit and equity markets, as well as the economy.
The 10-year Treasury yield just moved above 5%. Which indicators keep you calm, and what would change your mind?
TL: The relationship I watch most closely now is nominal Gross Domestic Product (GDP) growth versus the 10-year Treasury yield. Nominal economic growth is running at a 6%-7% pace, comfortably above the 10-year yield. Think of it as the economy’s ability to generate income compared with the cost of long-term money. When income growth beats the cost of capital, businesses and households can service their debts and still grow. Historically, that setup has resulted in above-average equity returns.
That is why a 10-year U.S. government bond yield above 5% does not scare me on its own. What matters is where it sits relative to the income the economy is producing. As long as that growth gap is ample, the backdrop stays supportive.
Three things could change my view:
- The Fed pushes rates so high that the 10-year Treasury yield eclipses the economy’s ability to generate income and returns. That is when the math becomes more difficult.
- The Fed inverts the yield curve. An inverted curve indicates that policy has become restrictive relative to the economy’s ability to finance itself.
- A massive labor market recovery causes the economy to overheat. That is the scenario where the Fed would have a real reason to keep tightening
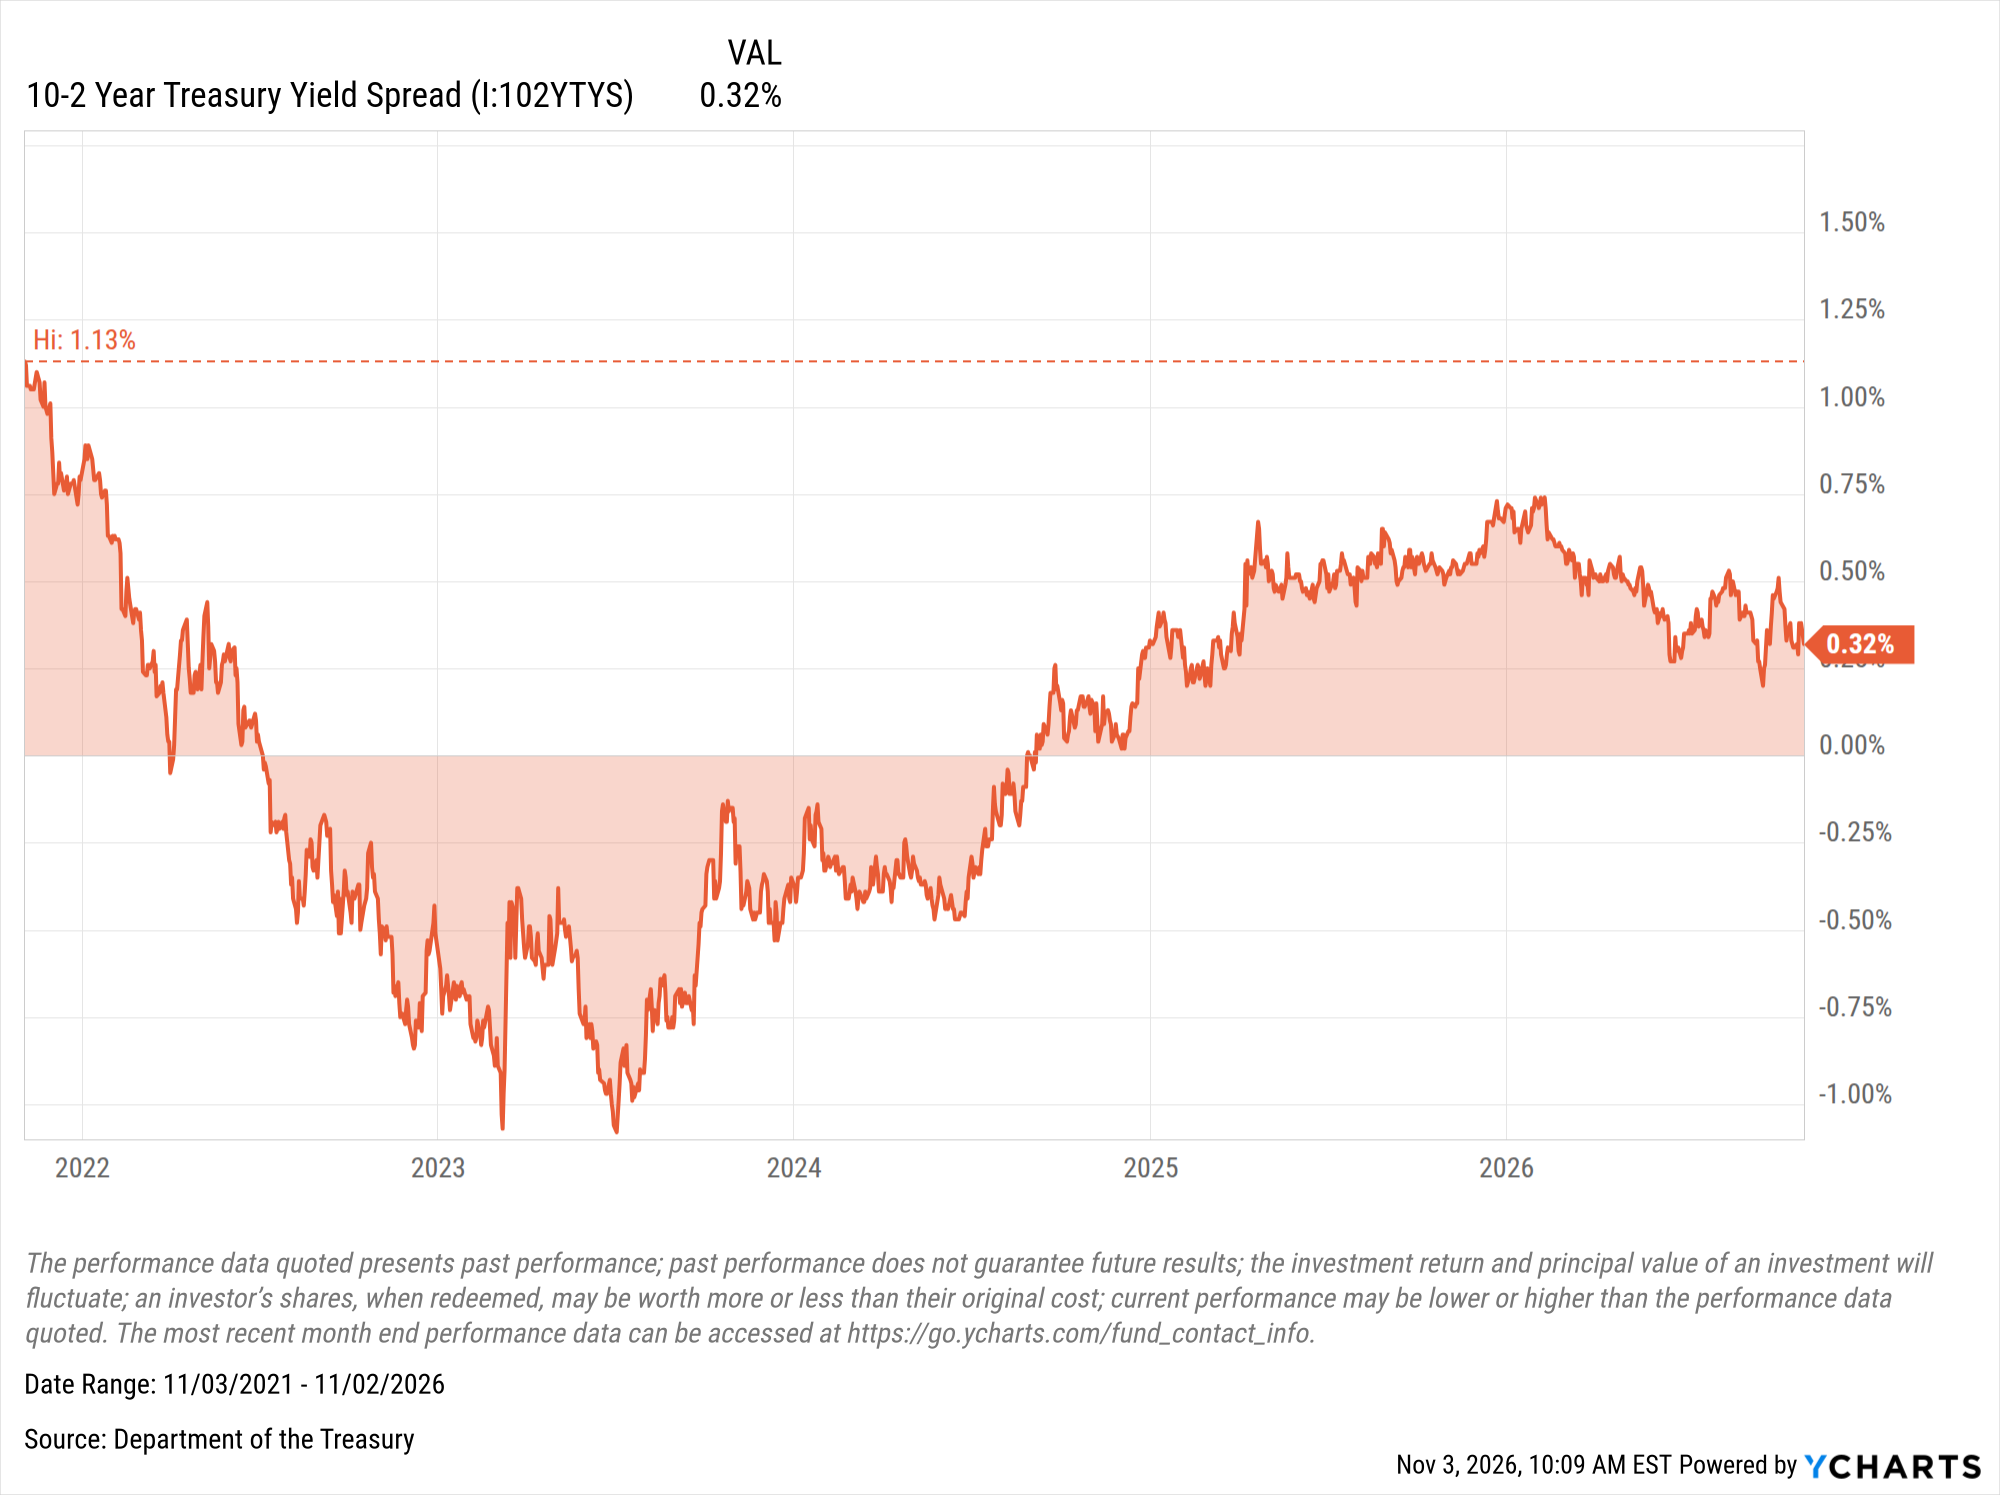
10-2 Year Treasury Yield Spread data by YCharts
There is also a tailwind people overlook. Sales are growing much faster than payrolls. Companies are producing more revenues without a matching increase in their highest cost, which is labor. As long as a wide gap persists between sales growth and payroll growth, it is a major tailwind for margins, and margins are what turn revenues into earnings.
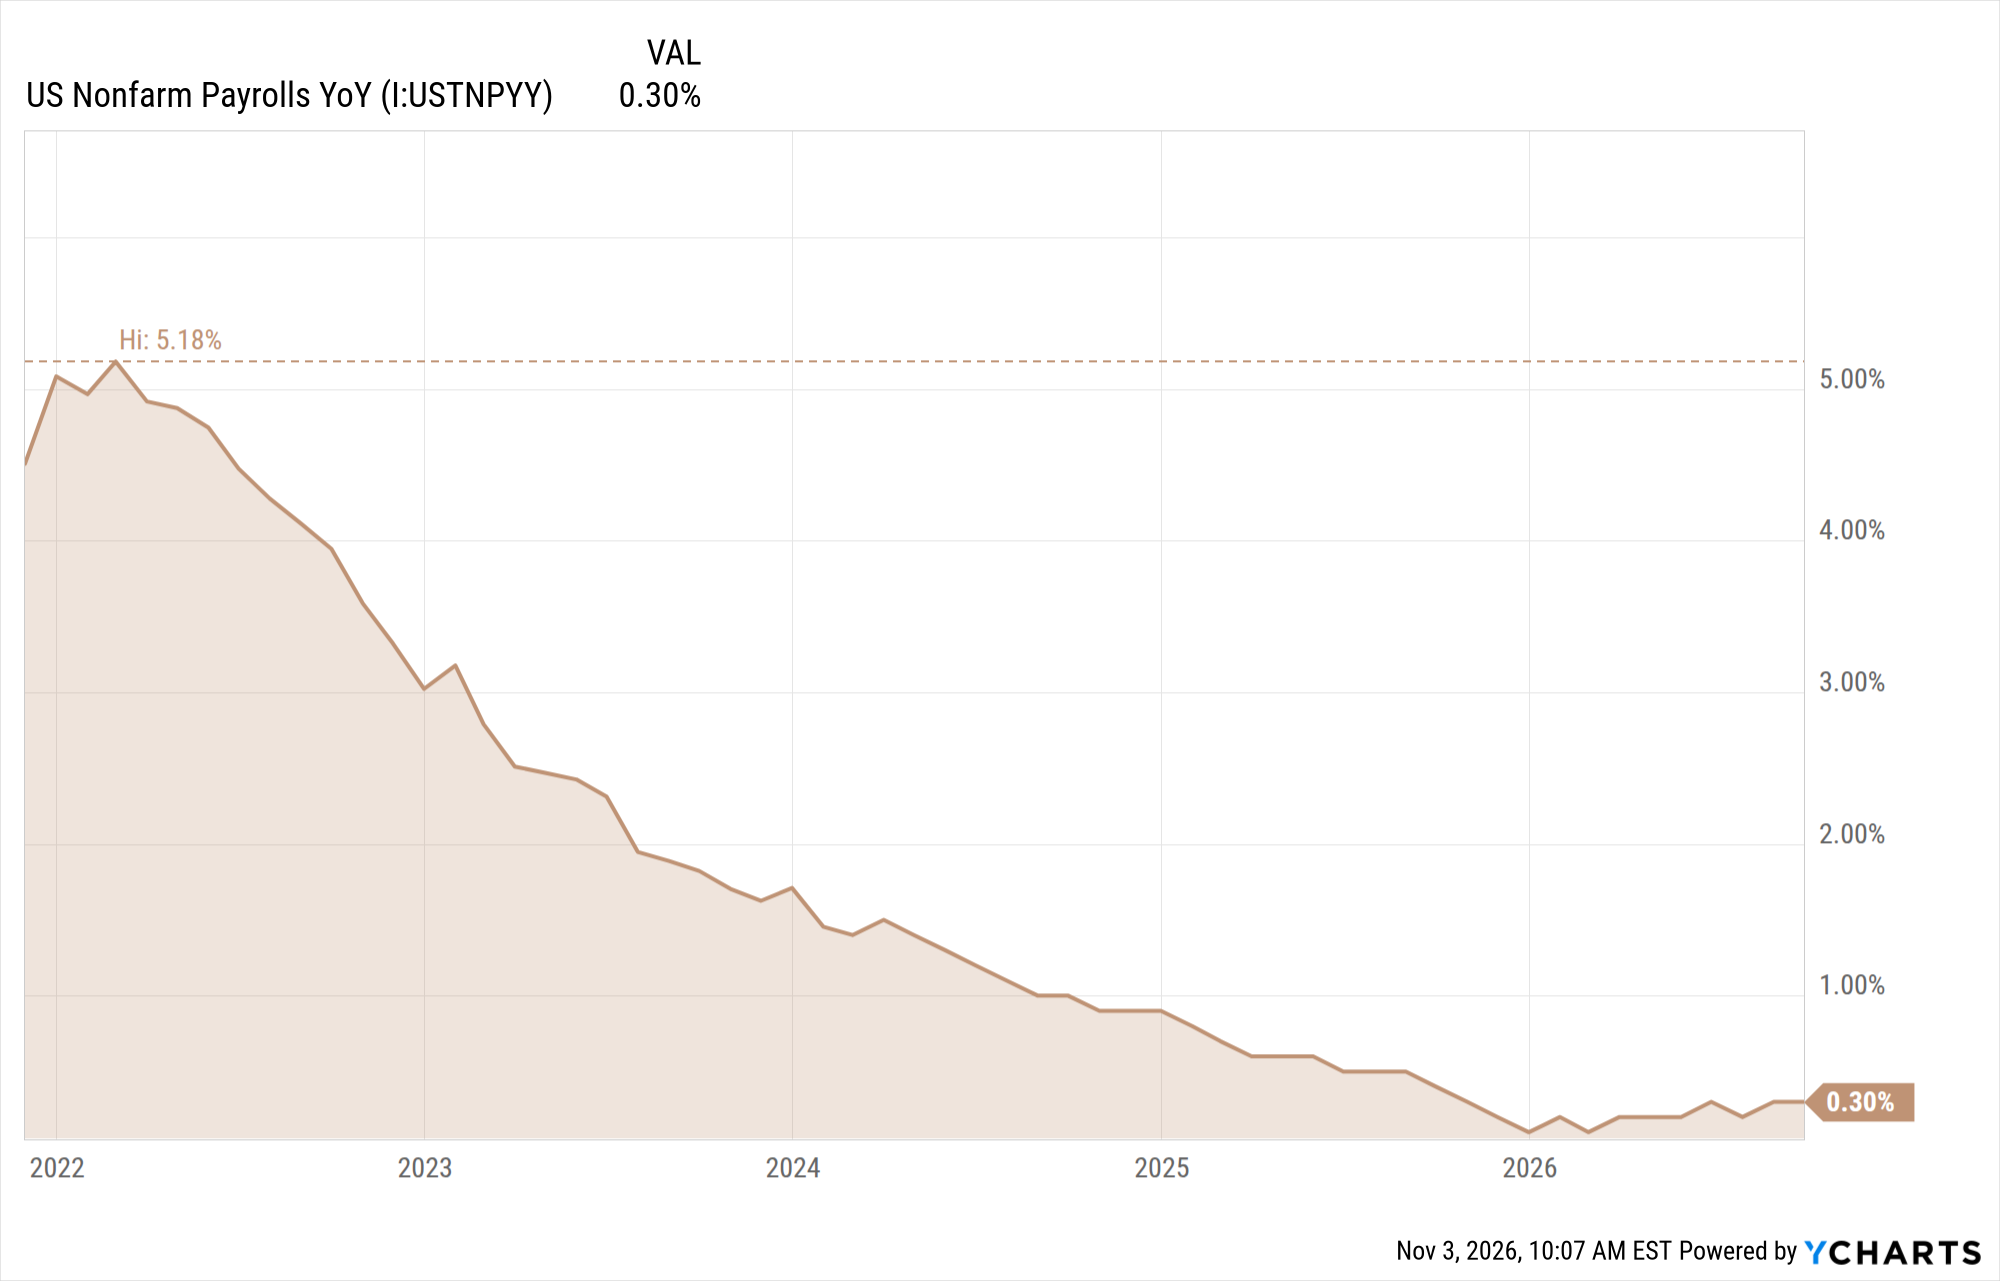
US Nonfarm Payrolls YoY data by YCharts
You have called this the most hated bull market of your career. What are sentiment and positioning telling you?
TL: People obsess over negative news. It is human nature, and right now, there is no shortage of it between the Fed, geopolitics, and the election. But as a contrarian, that is exactly what makes me constructive.
My sentiment and positioning indicator (SPI) shows persistent fear and bearishness, which keeps stocks in the buy zone. Surveys show more bears than bulls, even with the market near its highs. That is what I mean when I call this the most hated bull market of my career. Prices keep climbing, and people keep refusing to love the rally.
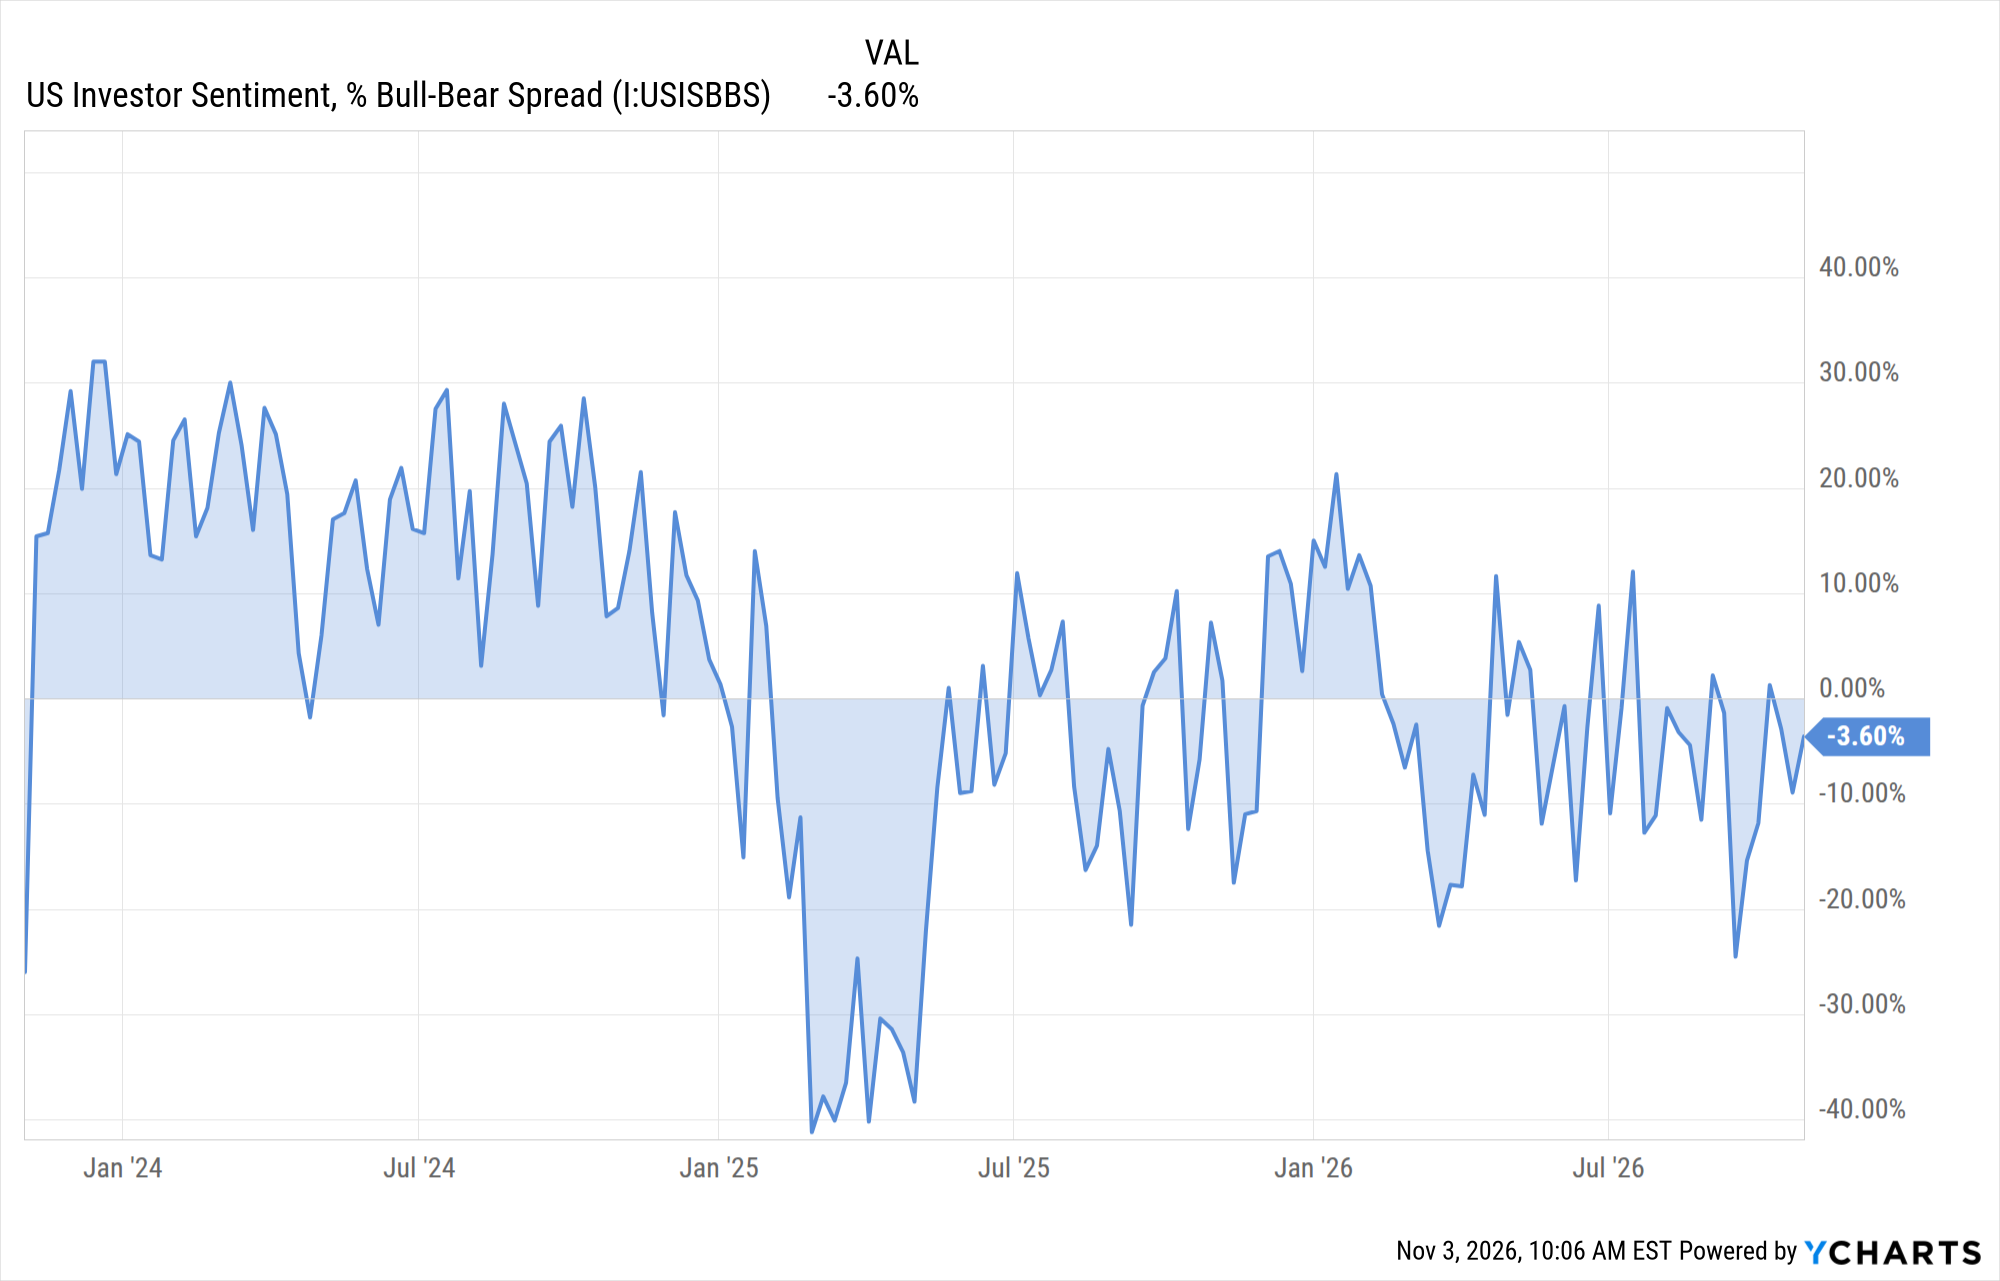
US Investor Sentiment, % Bull-Bear Spread data by YCharts
Then look at positioning. There is massive cash sitting on the sidelines. The Investment Company Institute (ICI) reports north of $8 trillion in money market mutual funds, and Bloomberg measures show over $28 trillion. Markets tend to peak when everyone is fully invested. We are nowhere near that. The cash mountain is potential fuel for stocks, not a warning sign.
Given those solid fundamentals, I view pullbacks as rewards rather than punishments. When sentiment is this sour and so much money is waiting on the sidelines, contrarians tend to buy the dips.
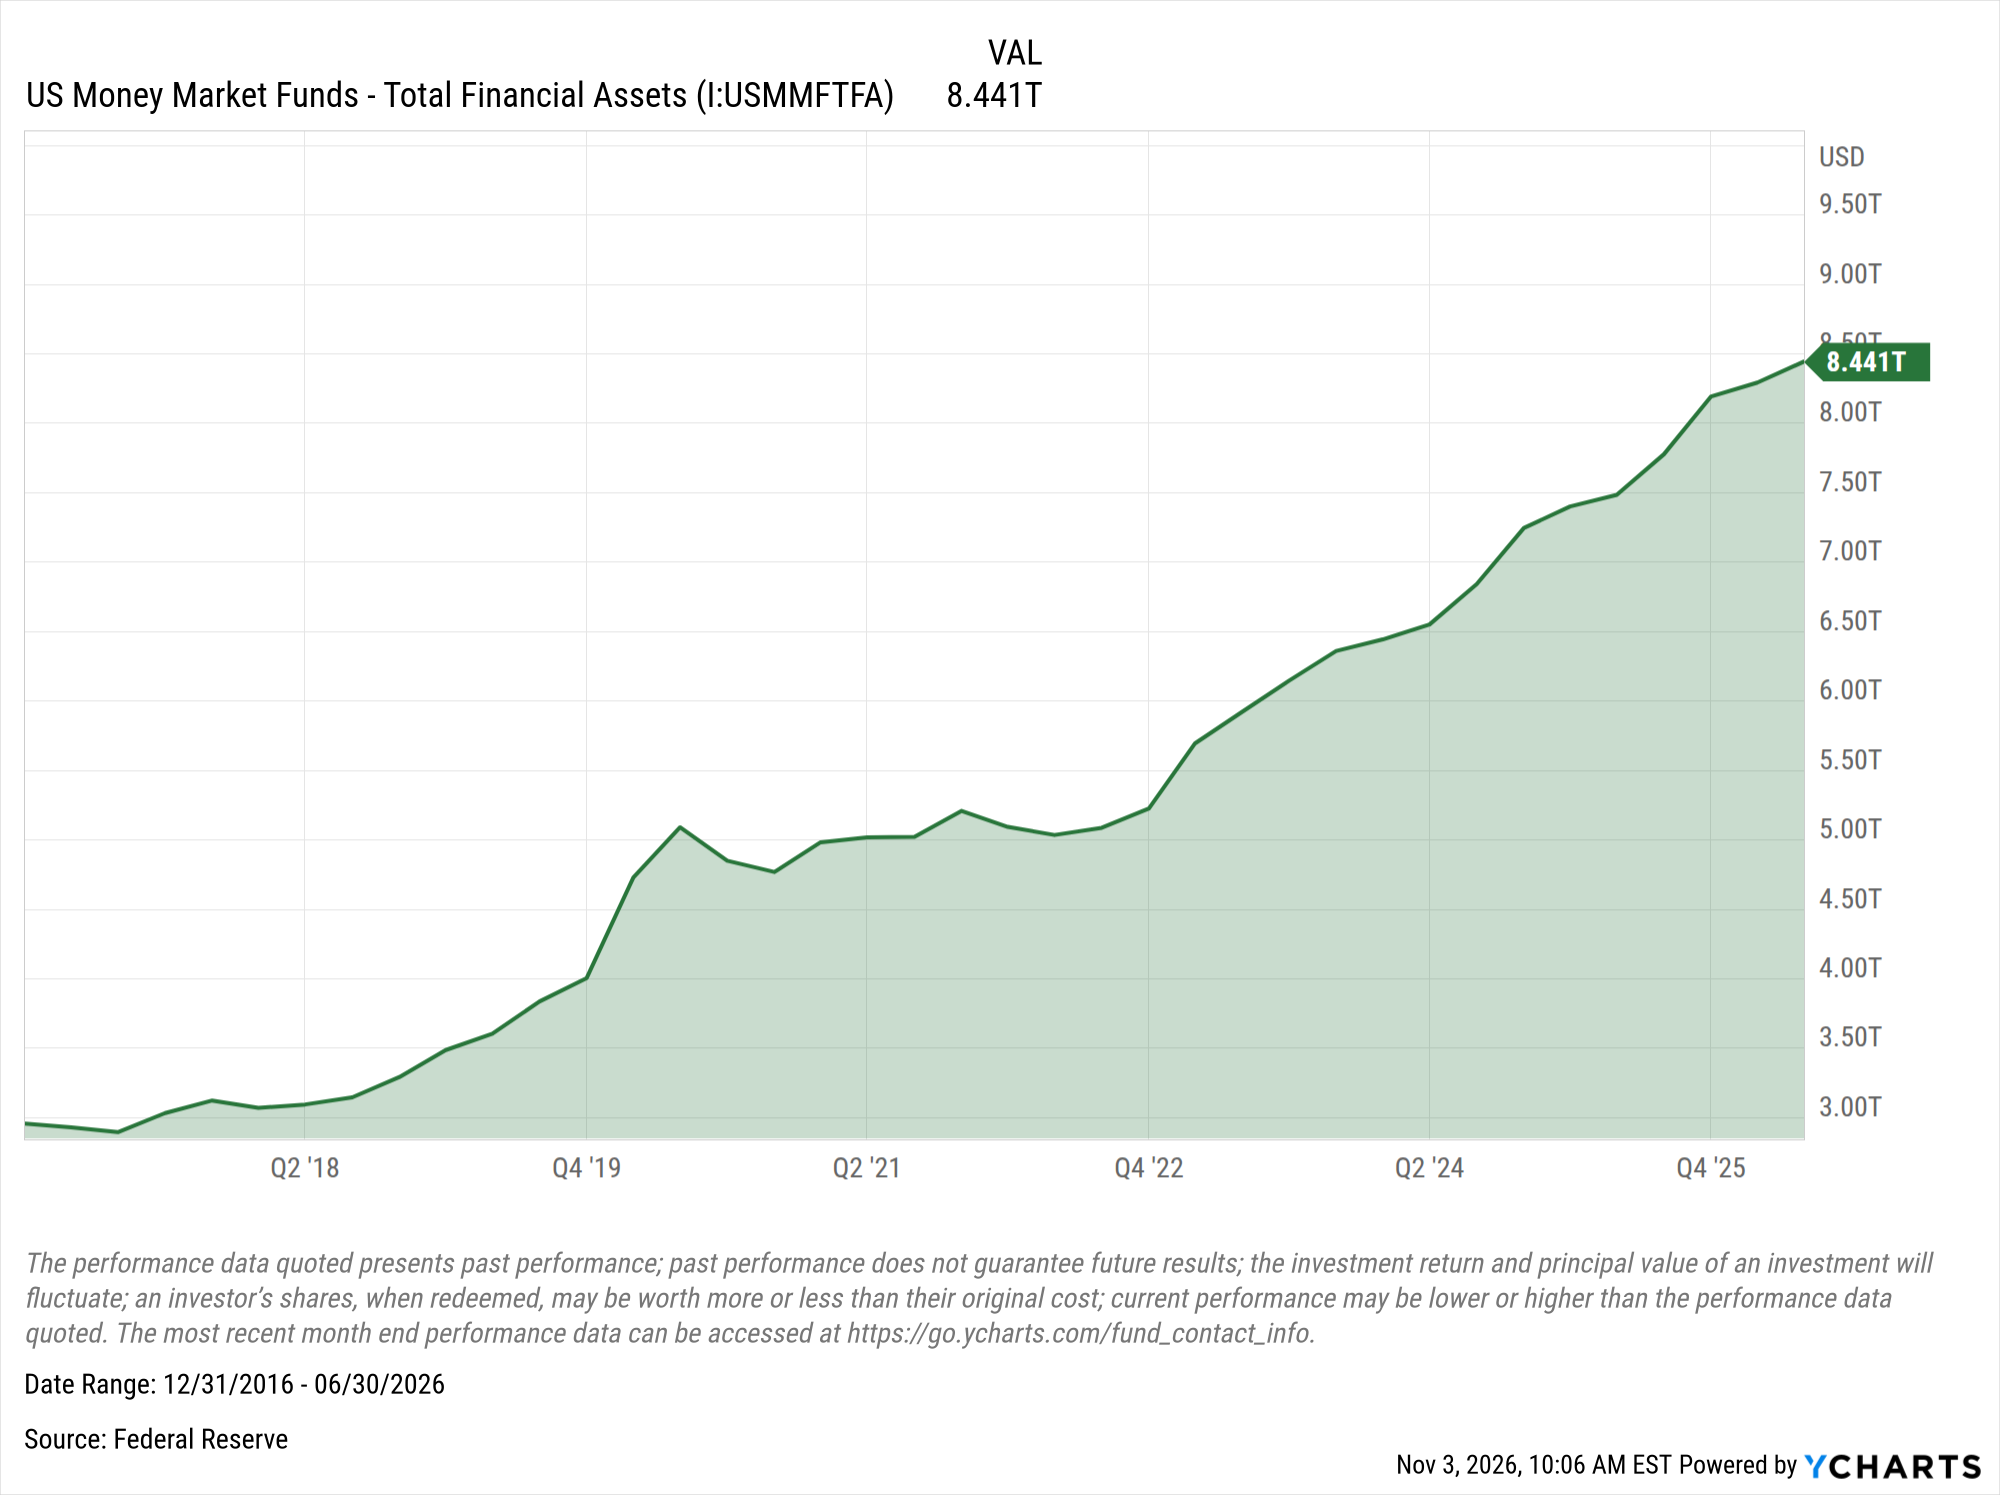
US Money Market Funds – Total Financial Assets data by YCharts
Where does that leave your S&P 500 price target?
TL: I pushed my S&P 500 price target of 8,500 to the first quarter of next year. I gave the stock market an extension because of several headwinds, including geopolitics and the U.S. conflict with Iran, which put us behind schedule.
I am not ignoring the risks. I am allowing more time for stocks to work through them. The fundamentals are strong enough that I think equities get there, but I would rather be realistic about the path than pretend it will be a straight line.
Healthcare has held up well this year. Should advisors lean more defensive?
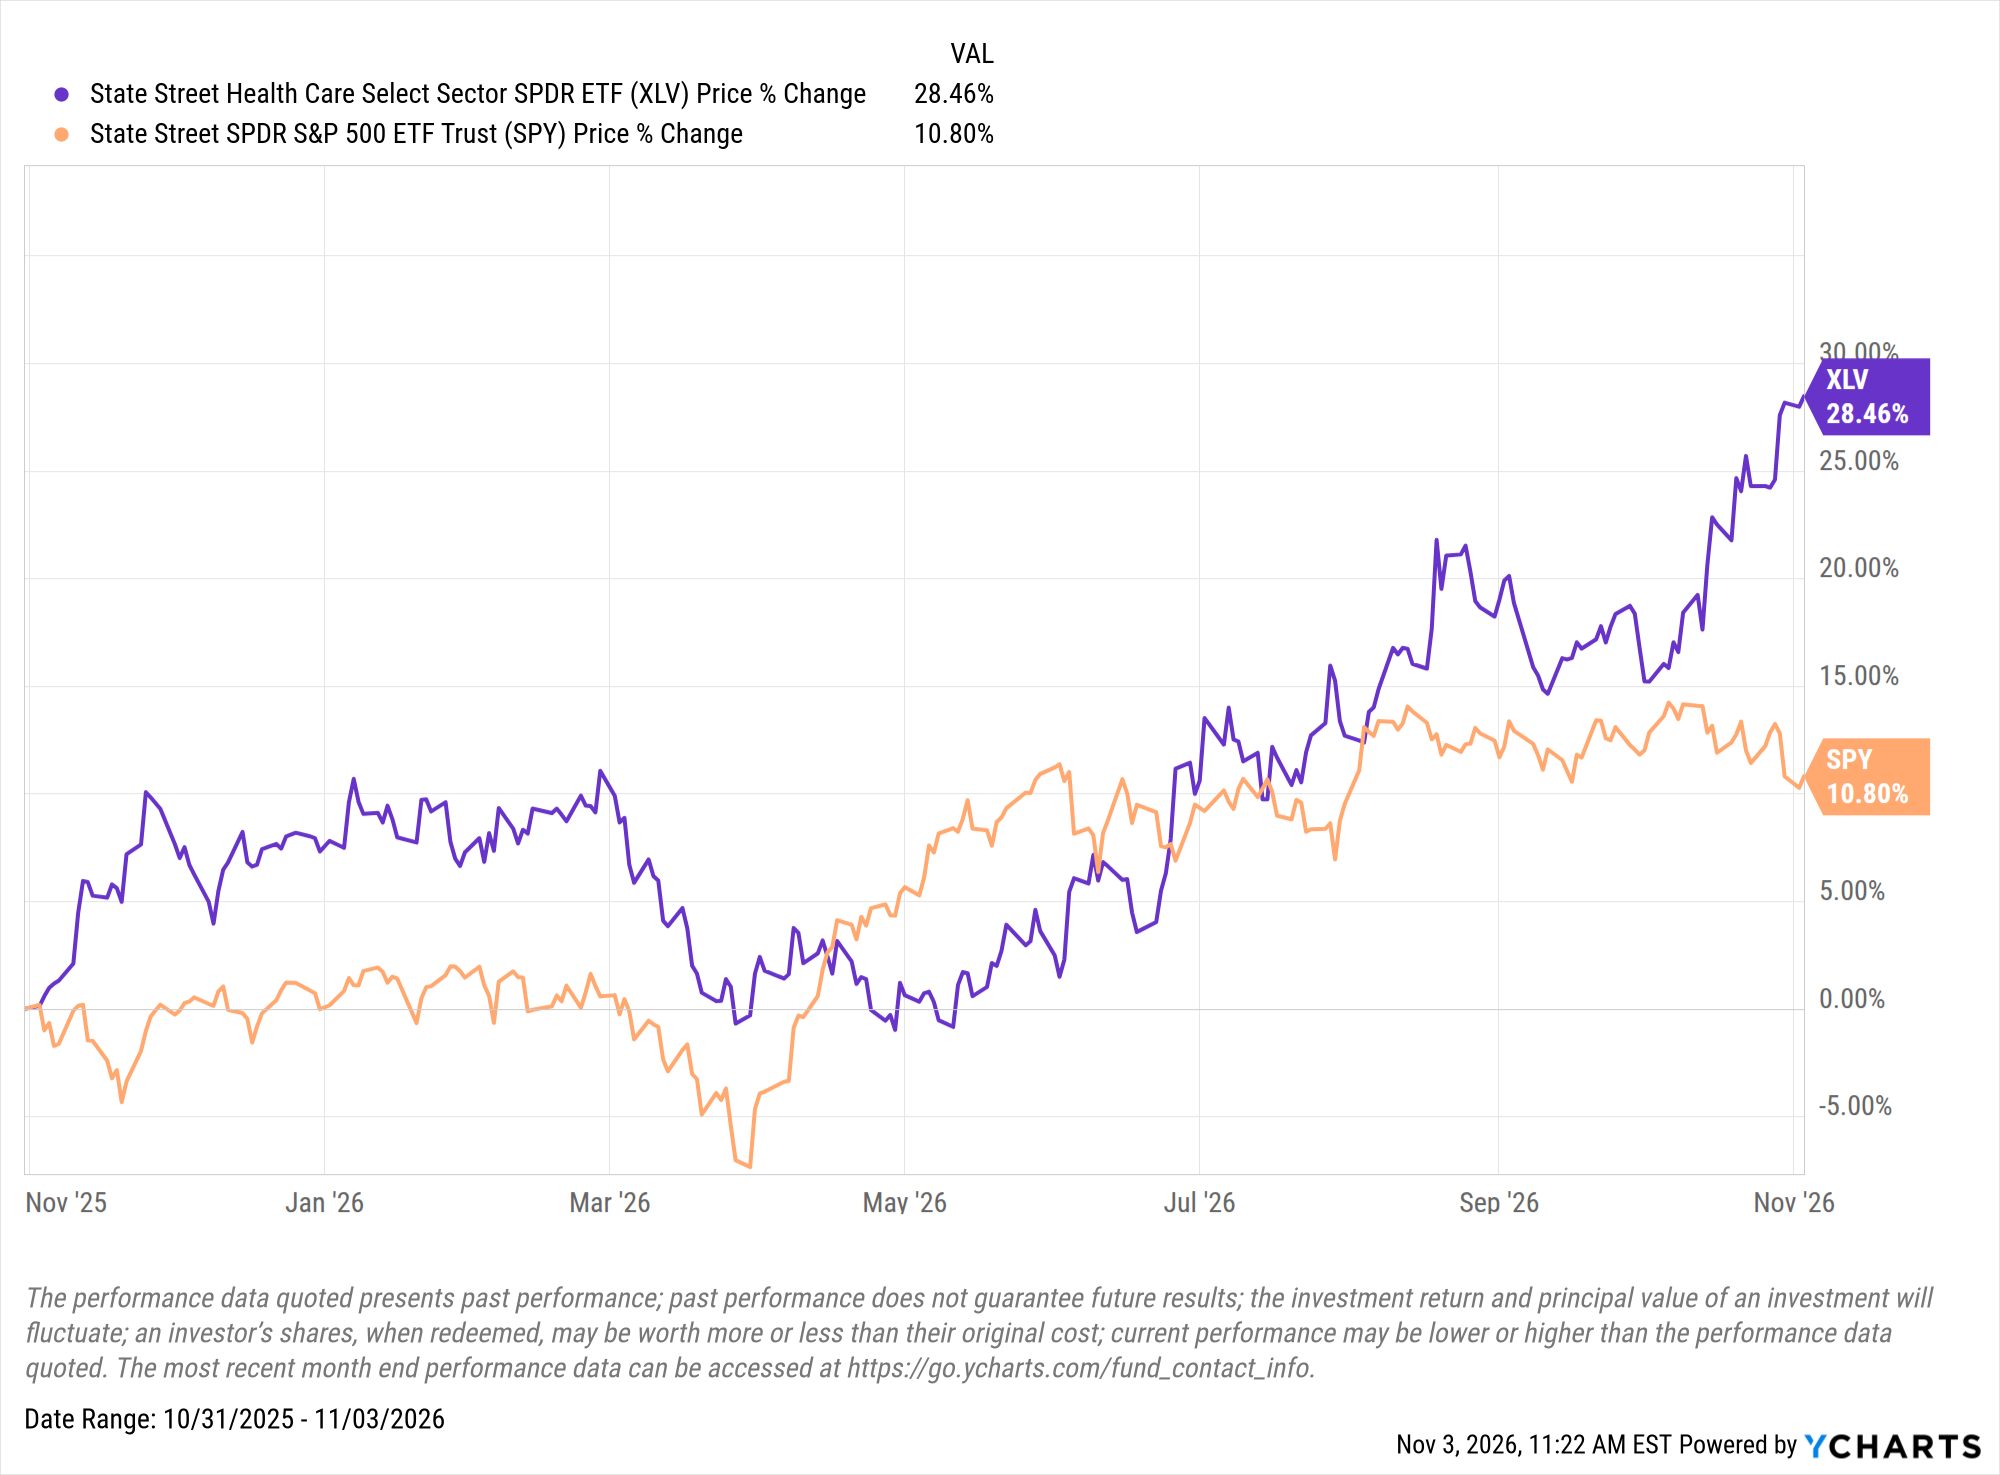
TL: Healthcare has held up nicely, and that makes sense. It is a countercyclical, defensive sector with a long-term demographic tailwind from an aging population. People need healthcare regardless of what the economy is doing.
But I would be careful about backing up too heavily on defense right now. We are heading into a seasonally favorable two-quarter period that runs through April of next year. Leaning too far into defensives here risks mistiming that stretch. Healthcare can be part of a diversified portfolio. But it’s no place to hide in a renewed risk-on environment.
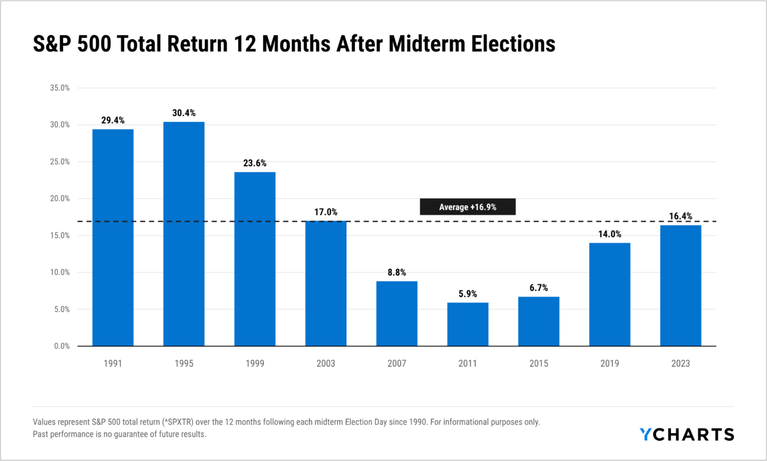
A widely cited statistic says stocks have been positive in the 12 months after every midterm election. How much weight should advisors give it?
TL: It is a standard stat bulls throw out, but I have never heard a convincing explanation for it. Ryan Detrick has done some work on the pattern using the Stock Trader’s Almanac, and it is a fun statistic. But a pattern without a cause is hard to lean on.
If I had to give you the most plausible explanation, it is fiscal pump priming. Politicians seeking election have every incentive to spend and support the economy ahead of a vote, and markets tend to benefit from it. That is a reasonable story, but I would treat it as one of numerous tailwinds rather than a sole reason to invest.
I will also say this: The midterms are dominating headlines, but they are not dominating client conversations. Advisors are hearing about the Fed, rates, and whether this rally can last. That tells you where investors’ attention really is.
The national debt has passed $40 trillion. Should that worry investors?
TL: I have heard concerns about the debt through my entire 26-year career, and over that same stretch, wealth creation has been phenomenal. The worry has been constant, but the damage people predicted has not shown up.
Part of the problem is that people look at the government’s debt in isolation. The right way to analyze debt is holistically across the household, business, and government sectors, because these move in relation to one another.
- Households have delivered. Net worth is at an all-time high of approximately $170 trillion, and household debt as a share of GDP is falling. Consumers are in better shape than the headlines suggest.
- Businesses are flat, with business debt as a share of GDP holding steady. Corporate balance sheets are not where the stress is.
- The government sector is levering up. Credit is the lifeblood of the economy, and when households and businesses step back from borrowing, someone has to step in. Right now, that is the government.
The way I think about it is the way a lender looks at a consumer loan. What matters is not the size of the balance on its own, but the borrower’s ability to service it. The federal government has strong tax authority and an under appreciated amount of assets. By that measure, the United States remains a good credit.
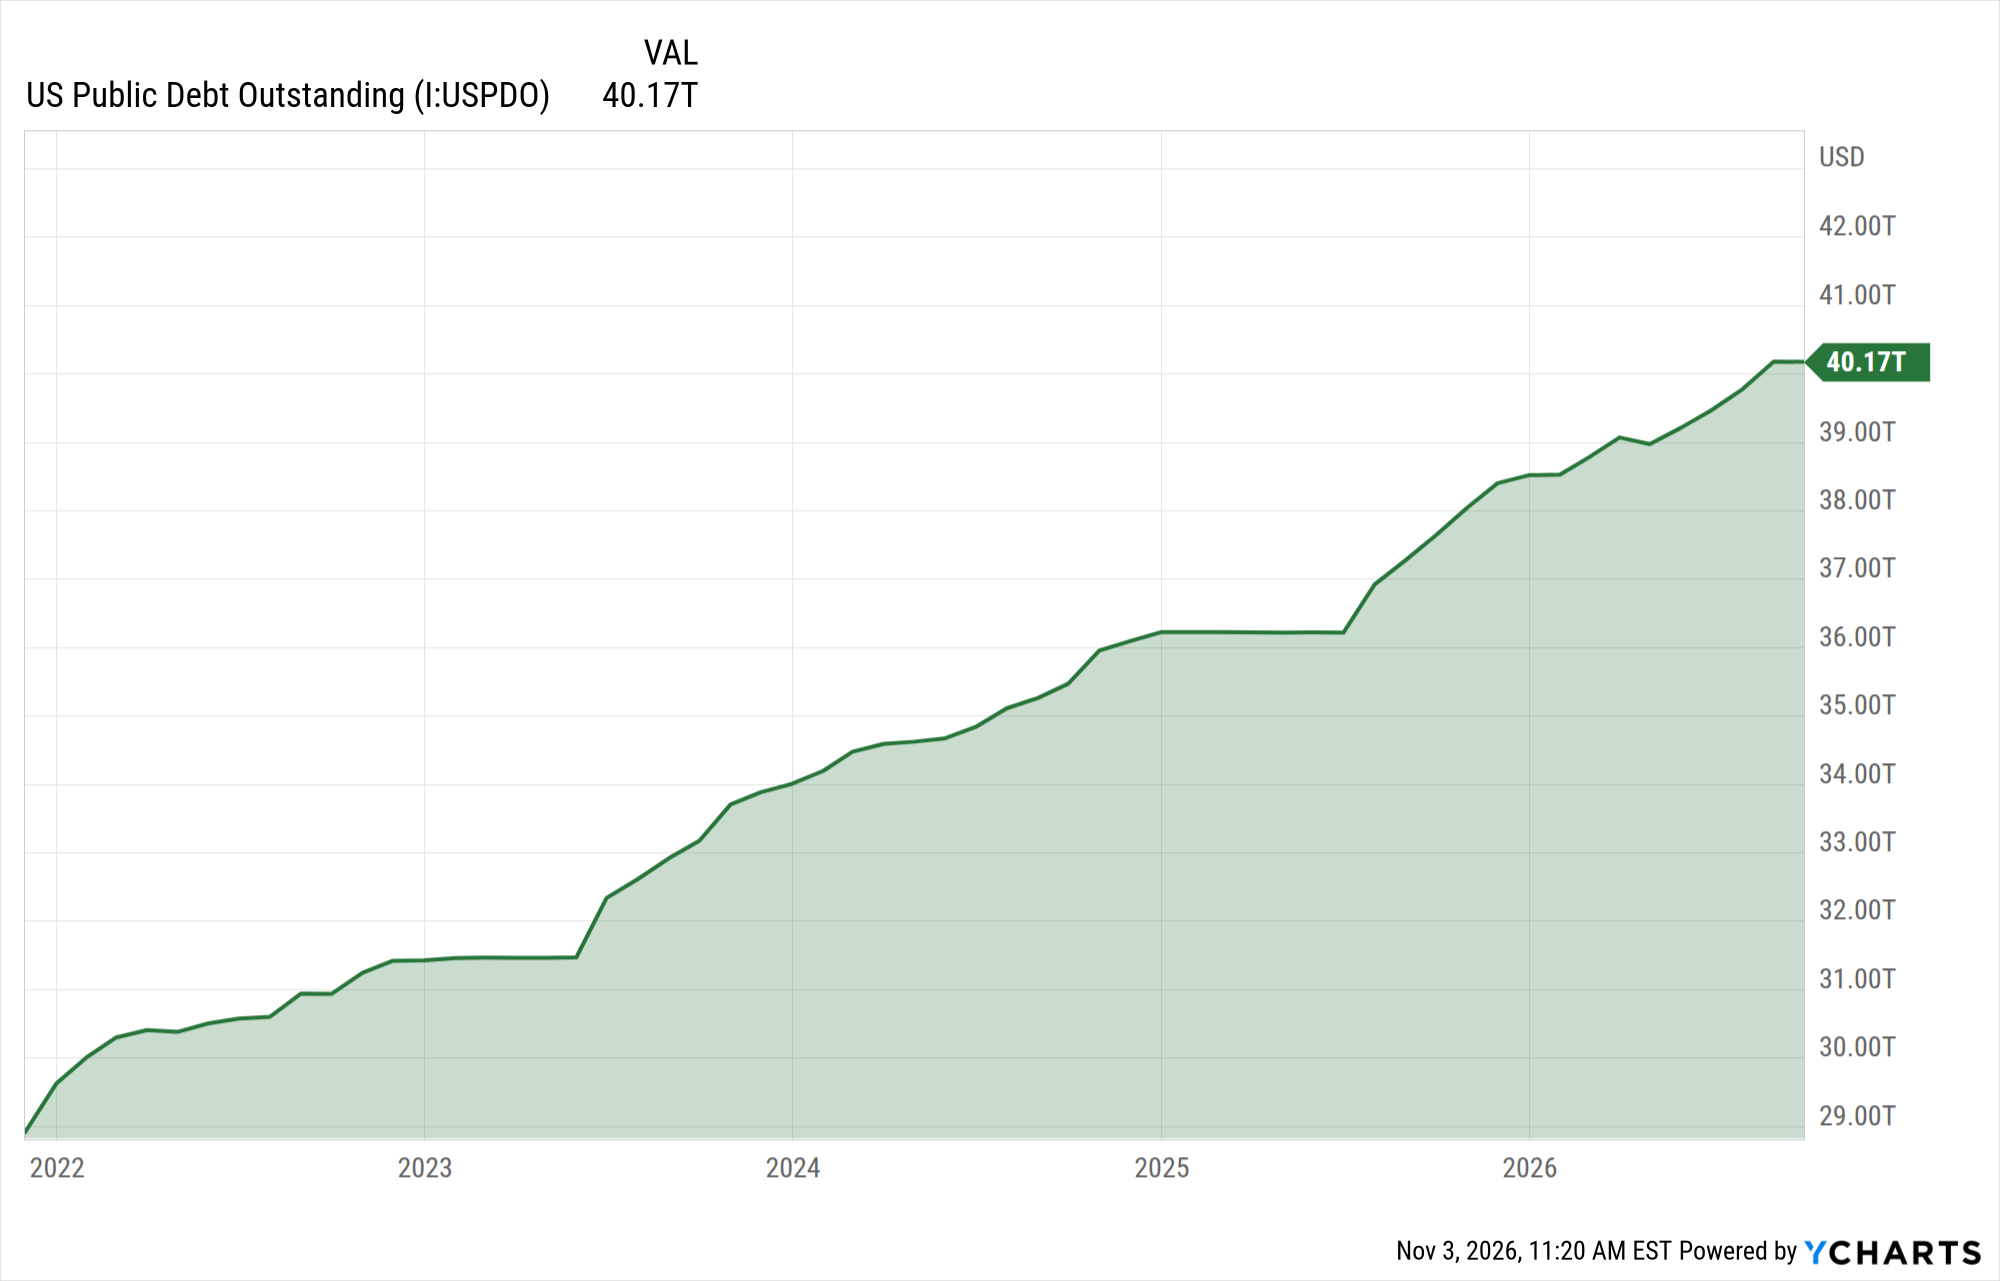
US Public Debt Outstanding data by YCharts
Final Thoughts…
What is the one message you would want advisors to take into client conversations right now?
TL: The fundamentals are solid, and clients should hear that clearly. Earnings and demand are validating capital spending. Nominal growth is outpacing the 10-year yield. Households have never been wealthier. And sentiment is still bearish, with a lot of cash waiting on the sidelines.
That combination is usually not how bull markets end. They end when everyone is optimistic and fully invested, and we are far from that today.
So, my message is simple: Pullbacks are gifts, not penalties. Do not let the headlines push clients out of a stock market that the fundamentals support. Earnings drive stocks, rates make noise.
Ready to Move On From Your Investment Research and Analytics Platform?
Follow YCharts Social Media to Unlock More Content!
Next Article
The Best Performing Dividend ETFs over the Last 10 YearsRead More →