Analyzing the Latest CPI Report: Insights and Implications for Businesses and Investors
The US Consumer Price Index (CPI) Month-over-Month (MoM) is a pivotal economic measure that tracks the average change in prices paid by consumers for a selected basket of goods and services each month. Alongside the MoM data, the Year-over-Year (YoY) CPI offers a broader view of inflation trends by comparing current prices to those from the same month in the previous year. These indicators provide valuable insights into the economic landscape, influencing policy decisions, business strategies, and investment plans. Staying updated with the latest CPI data is essential for financial advisors, investors, and policymakers.
For more detailed information, you can visit the US Bureau of Labor Statistics CPI page.
Latest Data Release
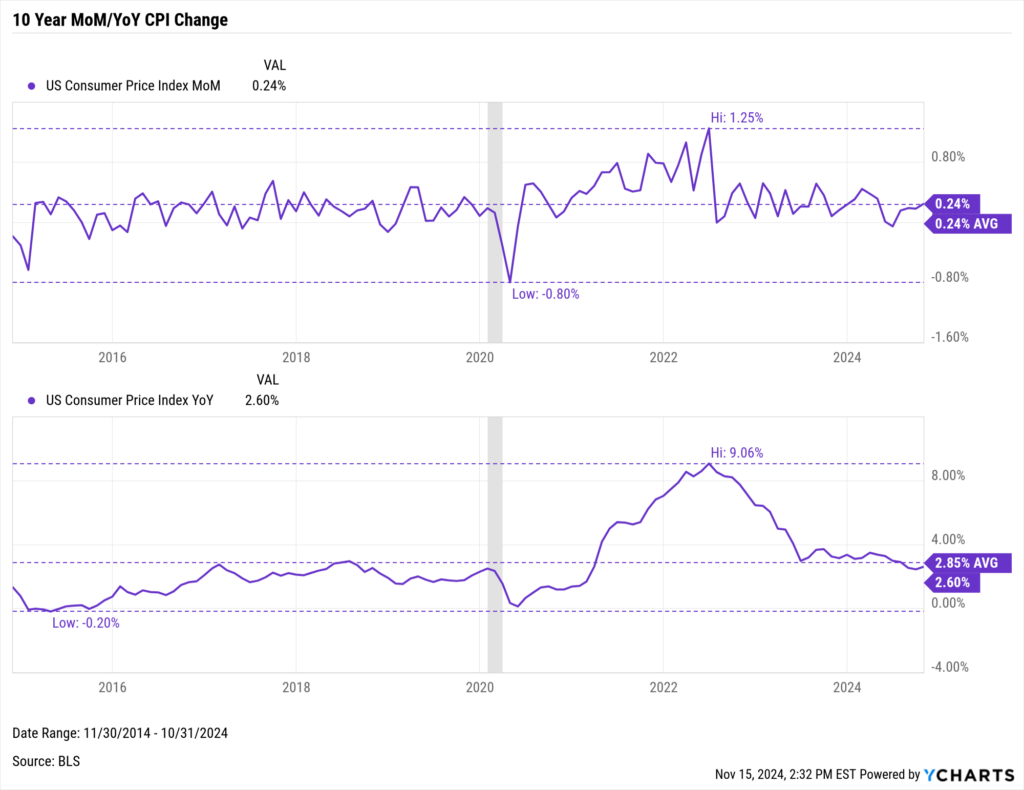
The latest CPI report was released on November 13 2024, detailing data for October 2024. The report indicates:
- A CPI increase of 0.24% from the previous month.
- A year-over-year increase of 2.60%.
Explore this US Consumer Price Index chart for a comprehensive view of the trend over time.
Download Visual | Modify in YCharts
If you are interested in a full analysis of asset class performance when price stability is sustained, join the list to receive your copy of “Which Asset Classes Perform Best As Inflation is Driven Lower.“
Get your copy of “Which Asset Classes Perform Best As Inflation is Driven Lower” here:Analysis and Insights
The Year-over-Year data for the US Consumer Price Index (CPI) throughout the early months of 2024 illustrates a nuanced trend in consumer prices, reflecting broader economic recovery and the lingering effects of global supply chain adjustments post-pandemic. The year-over-year CPI shows an increase of 2.6%, indicating that inflationary pressures have decreased over the past year.
Conversely, the Month-over-Month (MoM) CPI data reveals a more volatile picture with fluctuations that highlight the index’s sensitivity to immediate economic conditions. For instance, there was a 0.24% increase in October, a 0.18% increase in September, and a 0.19% increase in August, averaging a 0.2% increase over the past three months. This MoM volatility is crucial for operational decision-making, providing businesses and investors with insights into short-term economic dynamics that could influence pricing, procurement, and inventory management decisions.
Both YoY and MoM data collectively offer a comprehensive view of the economic pressures shaping the consumer landscape, essential for informed strategic planning and immediate market responsiveness.
Using YCharts, financial advisors can deeply analyze CPI data to guide investment decisions and economic forecasts. Here’s how to leverage our platform:
- Log on to YCharts: Access ycharts.com and sign in.
- Search for CPI Data: Use the search bar to find “US Consumer Price Index MoM” or “US Consumer Price Index YoY”.
- Navigate Historical Data: Utilize the toolbar to access historical data or visualize trends in an interactive chart.
- Interactive Analysis: On the indicator page, toggle the navigation bar to browse historical data monthly or view data in an interactive chart.
Related Financial Indicators
Understanding the CPI in conjunction with other financial indicators like the Effective Federal Funds Rate provides a fuller picture of economic conditions. YCharts’ CPI report contains several additional related indicators to the CPI, including:
- ADP Employment Change (click here to see how to use this indicator in YCharts)
- Effective Federal Funds Rate
- US Durable Goods New Orders MoM
- US Housing Starts MoM
- US Index of Consumer Sentiment
- US Initial Claims for Unemployment Insurance (click here to see how to use this indicator in YCharts)
- US ISM Manufacturing PMI (click here to see how to use this indicator in YCharts)
- US Real GDP QoQ
- US Retail and Food Services Sales MoM
- US Unemployment Rate (click here to see how to use this indicator in YCharts)
For more insights, check out our related blog posts and indicator pages.
Implications for Businesses and Investors
Business Strategies
An increase in CPI often signals rising consumer prices, prompting businesses to reevaluate their pricing strategies and cost management practices. For instance, retail companies might look into optimizing supply chain efficiencies or adjusting product prices to maintain profit margins. Conversely, a decreasing CPI could allow businesses to offer competitive pricing or increase margins without altering retail prices.
Sectoral Impact of CPI
Different sectors react distinctly to changes in the CPI. The housing and transportation industries, for example, are particularly sensitive to changes in consumer prices. An increase in CPI might squeeze margins in these sectors, whereas service-oriented sectors might be less affected directly but could experience indirect impacts through cost changes in inputs.
Investment Decisions
Investors use CPI as a leading indicator to predict inflation trends and assess the economic environment’s health. Rising CPI may signal forthcoming inflation, prompting investors to adjust portfolios towards sectors that traditionally hedge against inflation, such as real estate and commodities. On the other hand, a stable or declining CPI might encourage investments in bonds and other fixed-income securities, perceived as safer during periods of low inflation.
Understanding these dynamics can help businesses and investors navigate through economic cycles more effectively, using CPI as a critical guide for strategic planning and investment decision-making.
YCharts Feature Highlights
YCharts offers advanced features for tracking and analyzing CPI data:
Fundamental Charts
Build Fundamental Charts to visualize the CPI over time, enhancing analysis with custom annotations. Additional economic indicators, securities, funds, and indices can be added for an enhanced visual comparison. Emphasize critical junctures with interactive or static annotations like Min, Max, and Average lines. Additionally, you can make aesthetic additions such as your firm’s custom colors or logo.
Timeseries Analysis
Import historical CPI data for detailed backtesting and analysis across various periods. Data can be exported into CSV format for analysis in YCharts’ Excel Add-in or as a standalone file.
Dashboard
Monitor the CPI alongside other crucial economic indicators with YCharts’ personalized Dashboard, where users can easily track the information that matters most to them. If you’re short on time, choose from YCharts’ ready-made templates, such as the “US Economy” template, which showcases data on Employment, Consumerism, Housing, and other major US indicators.
Economic Indicator Calendar
Gain a comprehensive overview of recent and upcoming economic data releases worldwide with YCharts’ Economic Indicator Calendar. Seamlessly integrate any specific indicator’s release schedule into your personal or professional calendar for streamlined planning and timely updates.
Alerts
Users can also set Custom Alerts for the CPI (or other economic indicators), triggered by criteria they define (e.g., % Change from Previous >= 1%). These alerts can be configured for any other security, watchlist, saved model portfolio, index, or indicator, ensuring users stay informed about significant fluctuations.
For tutorials on these features, check our YCharts tutorial page.
Conclusion
This month’s CPI report provides crucial insights into consumer price trends and broader economic indicators. It’s essential to regularly check these updates and use tools like YCharts for detailed and actionable analyses. YCharts equips you with a robust suite of tools, including an extensive library of economic indicators, advanced charting software, and comprehensive analysis capabilities.
To fully leverage these resources and tailor them to your specific needs, schedule a personalized information session or start a free trial.
Whenever you’re ready, there are 3 ways YCharts can help you:
1. Looking to better communicate the importance of economic events to clients?
Send us an email at hello@ycharts.com or call (866) 965-7552. You’ll be directly in touch with one of our Chicago-based team members.
2. Want to test out YCharts for free?
Start a no-risk 7-Day Free Trial.
3. Sign up to receive a copy of our latest research, “Which Asset Classes Perform Best As Inflation is Driven Lower.”
Disclaimer
©2024 YCharts, Inc. All Rights Reserved. YCharts, Inc. (“YCharts”) is not registered with the U.S. Securities and Exchange Commission (or with the securities regulatory authority or body of any state or any other jurisdiction) as an investment adviser, broker-dealer or in any other capacity, and does not purport to provide investment advice or make investment recommendations. This report has been generated through application of the analytical tools and data provided through ycharts.com and is intended solely to assist you or your investment or other adviser(s) in conducting investment research. You should not construe this report as an offer to buy or sell, as a solicitation of an offer to buy or sell, or as a recommendation
Next Article
US Index of Consumer Sentiment Monthly UpdateRead More →