Are We In A Recession? It Depends…
“Are we in a recession?”
It’s a question many financial advisors have been fielding from their clients as economic uncertainty has only increased this year. The answer, however, depends on who you ask.
The short and technical definition of a recession is two consecutive quarters of negative GDP growth, which is exactly what occurred in Q1 and Q2 of 2022. However, definitions vary and the second half of 2022 has fared better as Q3 closed with a 2.6% increase in US GDP.
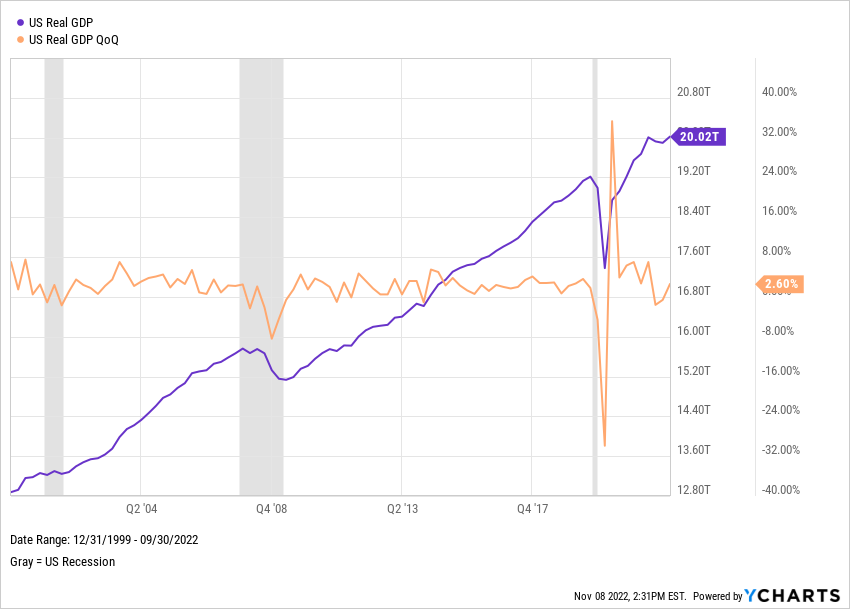
Download Visual | Modify in YCharts
High inflation also remains top-of-mind for consumers as the US is experiencing price increases not seen since the 1980s. Though the inflation rate is down from a peak of 9.1% in July, its current 8.2% level suggests that perhaps the Fed is not quite done hiking interest rates in order to accomplish its goal of tempering inflation.
Another side-effect of rising interest rates: A long-awaited housing correction. The 30-year mortgage rate has more than doubled to 7%, forcing potential home buyers to think twice. The Case-Shiller Home Price Index, which measures the change in the value of U.S. single-family homes, is down 2% of its all-time high YTD. US Existing Home Sales have also lagged, down 22.7% YTD.
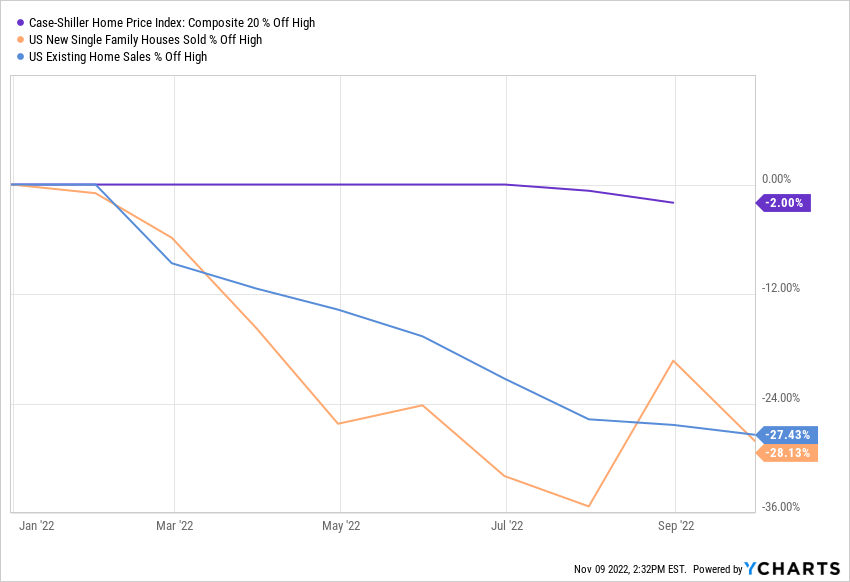
Download Visual | Modify in YCharts
Investors are also keeping a close watch on Treasury yield spreads, such as the 10-2 Year and 10 Year-3 Month yield spreads. Yield curve inversions have preceded every recession since 1955 and are therefore regarded as a reliable indicator of a looming recession.
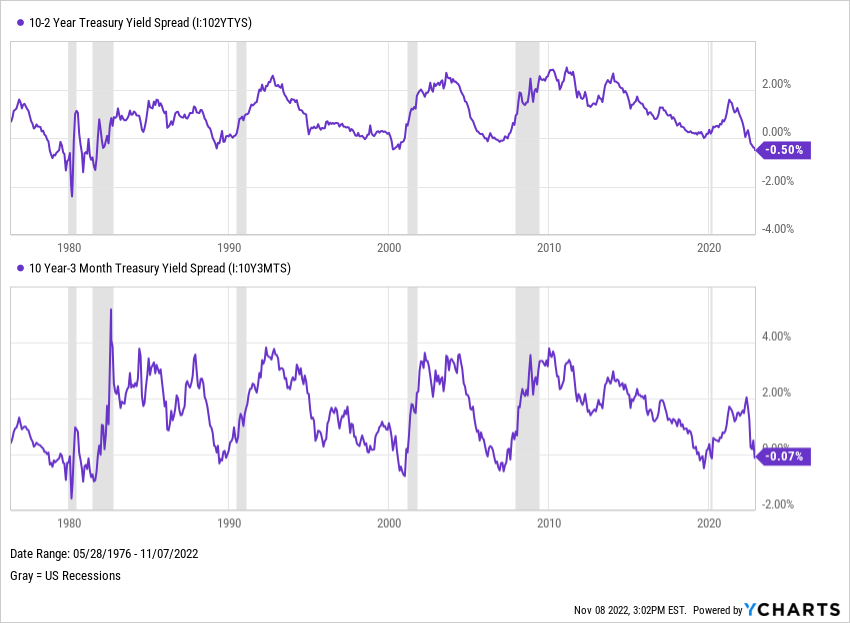
Download Visual | Modify in YCharts
Regardless of how we each might interpret the data, economists at the National Bureau of Economic Research (NBER) get the final say in determining if we’ve entered a recession, and the committee uses a more complex definition than the simple “two quarters” approach. So how exactly does the NBER determine if the United States is in a recession?
How Does The NBER Determine A Recession?
According to their official site, the NBER considers the depth of the change of certain indicators when defining a recession. For instance, while GDP shrank in the first half of 2022, this proved to be a temporary sputter.
Unemployment is another important factor to consider. At 3.7% as of October 2022, the US unemployment rate is below its historical average of 5.74%. For context, the unemployment rate in October 2009 was 10.1%. Naturally, the NBER would hesitate to claim the US is in a recession when it’s experiencing both low unemployment and steady job growth. (In the month of October, the US added 261,000 new jobs.)
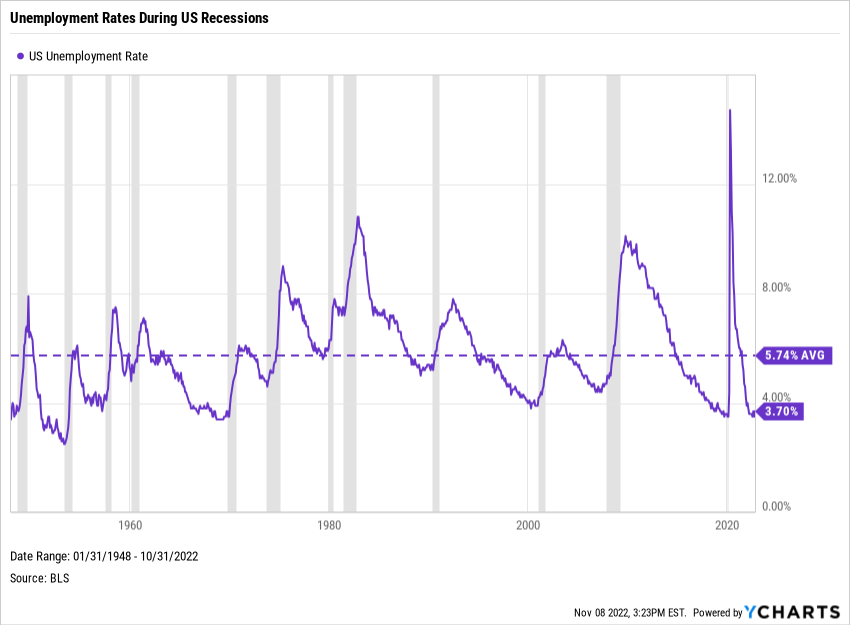
Download Visual | Modify in YCharts
The NBER also examines real gross domestic income (GDI), which measures what participants in the economy make or “take in”, i.e. wages and profits. US Real GDI is currently up year-to-date, albeit only slightly at 0.21%.
So while the US economy is definitely experiencing a degree of uncertainty, and many Americans feel like we’re experiencing a recession as US Consumer Sentiment is down nearly 40% from January 2020, the strength of other indicators suggests we’re not quite in recession territory. At least not yet.
Because many of the NBER’s data points are lagging indicators, it can be difficult to officially classify a recession in real-time. As a result, the NBER typically won’t make an official determination until the US is well into a recession, or even after one has already passed (as occurred in 2020).

Download Visual | Modify in YCharts
How Can Advisors Make Recession Assessments for Themselves and Their Clients?
Track Economic Data & Find Recession-Friendly Funds
Regardless of the definitions you follow (or any gut feelings you have), recessions tend to increase investors’ motivation to make sound and confident financial decisions.
YCharts provides access to tens of thousands of economic indicators to help advisors and their clients understand the underlying factors of the economic outlook. For investment decision-making, the YCharts Fund Screener offers “Recession Friendly Funds” and “Recession Friendly Fixed Income Funds” as data-driven starting points for advisors.

Below are some economic indicators that may be relevant to analyzing recessions. A number of pre-built templates are available as Dashboards in YCharts, including a US Economy Dashboard.
US Personal Consumption Expenditures
Developing a Recession Game Plan For Clients
Some common questions advisors field from clients during times of economic uncertainty include: What should I do with my investments? What would happen if we paused or reduced all investment contributions during a recessionary period? Or, what’s the long-term impact on a portfolio if there’s a significant withdrawal during a downmarket?
The Scenarios Tool on YCharts enables you to run these real-life scenarios and share insights to build a recession game plan for clients. Choose a portfolio, fund, or any other security and add one-time or ongoing deposits and withdrawals to create a visual of the potential impact.
Overlaying Recessions on Charts
Fundamental Charts enable you to visualize US Recession periods (as defined by NBER) on any chart, allowing you to illustrate recession implications for various portfolios and securities.

The Bottom Line
Is there one true answer to the question “Are we in a recession?” Yes and no.
While forecasts suggest a mild recession is likely to come in 2023, the final say comes from the economists at NBER, and we probably won’t have the answer until late in the game. But that doesn’t mean advisors shouldn’t continue taking the temperature of the economy and educating their clients on the fundamentals. With the proper data and tools, advisors can better communicate the most important factors at play and how they impact investment decisions.
Connect with YCharts
To learn more, call us at (773) 231-5986, or email hello@ycharts.com.
Want to add YCharts to your technology stack? Sign up for a 7-Day Free Trial to see YCharts for yourself.
Disclaimer
©2022 YCharts, Inc. All Rights Reserved. YCharts, Inc. (“YCharts”) is not registered with the U.S. Securities and Exchange Commission (or with the securities regulatory authority or body of any state or any other jurisdiction) as an investment adviser, broker-dealer or in any other capacity, and does not purport to provide investment advice or make investment recommendations. This report has been generated through application of the analytical tools and data provided through ycharts.com and is intended solely to assist you or your investment or other adviser(s) in conducting investment research. You should not construe this report as an offer to buy or sell, as a solicitation of an offer to buy or sell, or as a recommendation to buy, sell, hold or trade, any security or other financial instrument. For further information regarding your use of this report, please go to: ycharts.com/about/disclosure.
Next Article
$META's Q3, All-in on FANG & Global Oil Supply | What's Trending on YCharts?Read More →