$ARKK, Shopify & Tesla’s PE – What’s Trending on YCharts?
In the What’s Trending on YCharts? series, we pull back the data curtain and share which stocks, funds, and econ data pages on YCharts are getting the most traffic (from YCharts users and Google searchers alike).
In January 2022, YCharts pageview data revealed what names and stories were catching most people’s attention. Namely, Tesla’s PE ratio and the forward PE ratio estimate for the S&P 500 on the whole, Shopify’s 50% drawdown, and ARK Innovation ETF’s (ARKK) long slide as growth stocks have sold off.
To get the full scoop on everything trending, watch the episode here:
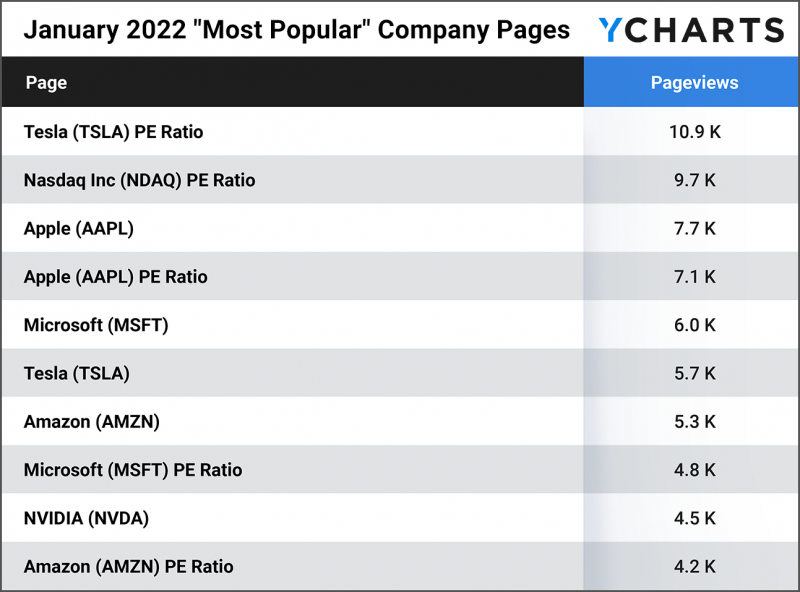
Most Popular Company Pages
These stock data pages had the most unique pageviews in January 2022.
While Tesla’s share price has spiked significantly before, one difference from late 2021’s episode is the presence of growing earnings. Prior to this, price appreciation had triggered Tesla’s PE ratio to ramp up, peaking around 1400 a little more than a year ago.
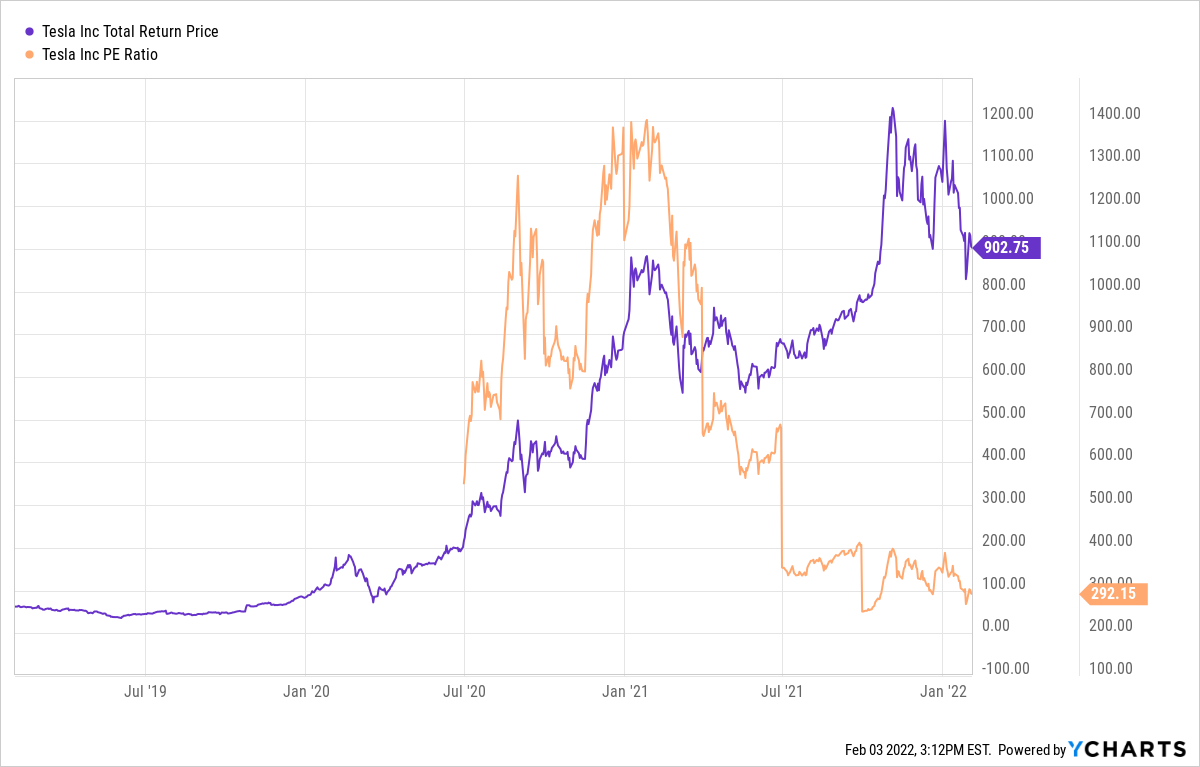
Download Visual | Modify in YCharts
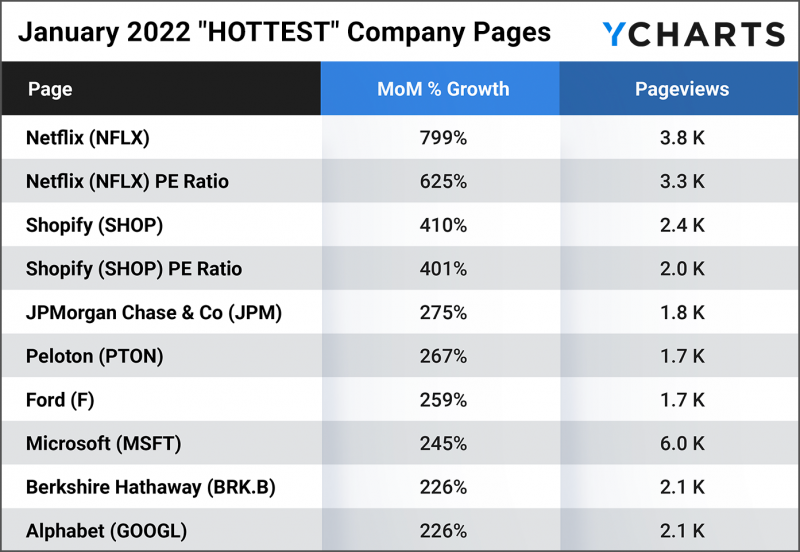
Hottest Company Pages
These stock data pages had the largest month-over-month unique pageview growth in January 2022, as compared to December 2021.
Shopify (SHOP) has embodied the “high risk, high reward” investing truth since its 2015 debut on public markets. Since its November 2021 peak, the e-commerce platform provider has cratered 50%. But long-term Shopify investors might remember a similar crash from 2015, before enjoying significant returns in the time since.
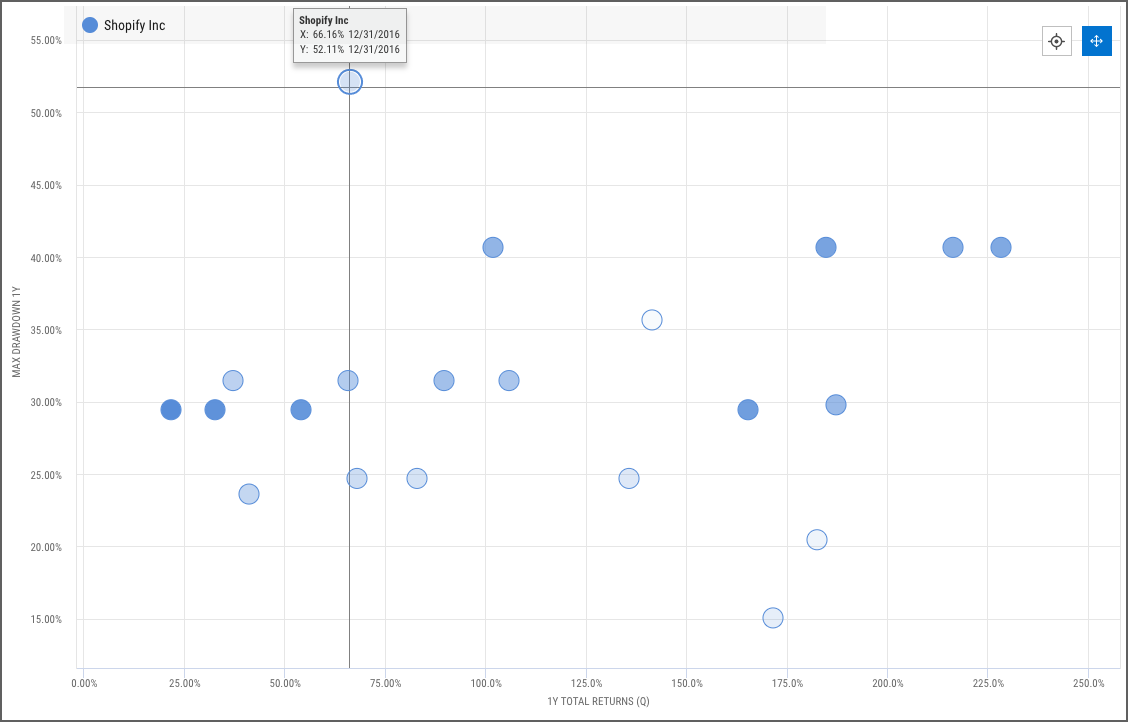
Download Visual | Modify in YCharts
Most Popular Fund Pages
These fund data pages had the most unique pageviews in January 2022.
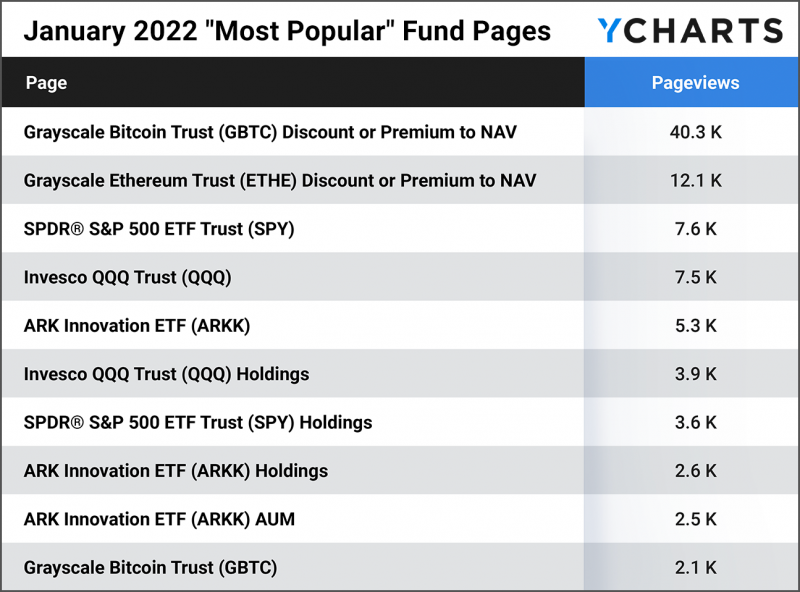
The ARK Innovation ETF (ARKK) gained notoriety for its prescient bets on stay-at-home stocks like Zoom (ZM), Peloton (PTON), Teladoc Health (TDOC), and others. But since those high-growth names have sold off amid rising inflation, $ARKK has arc’d back toward level returns with passive index funds.
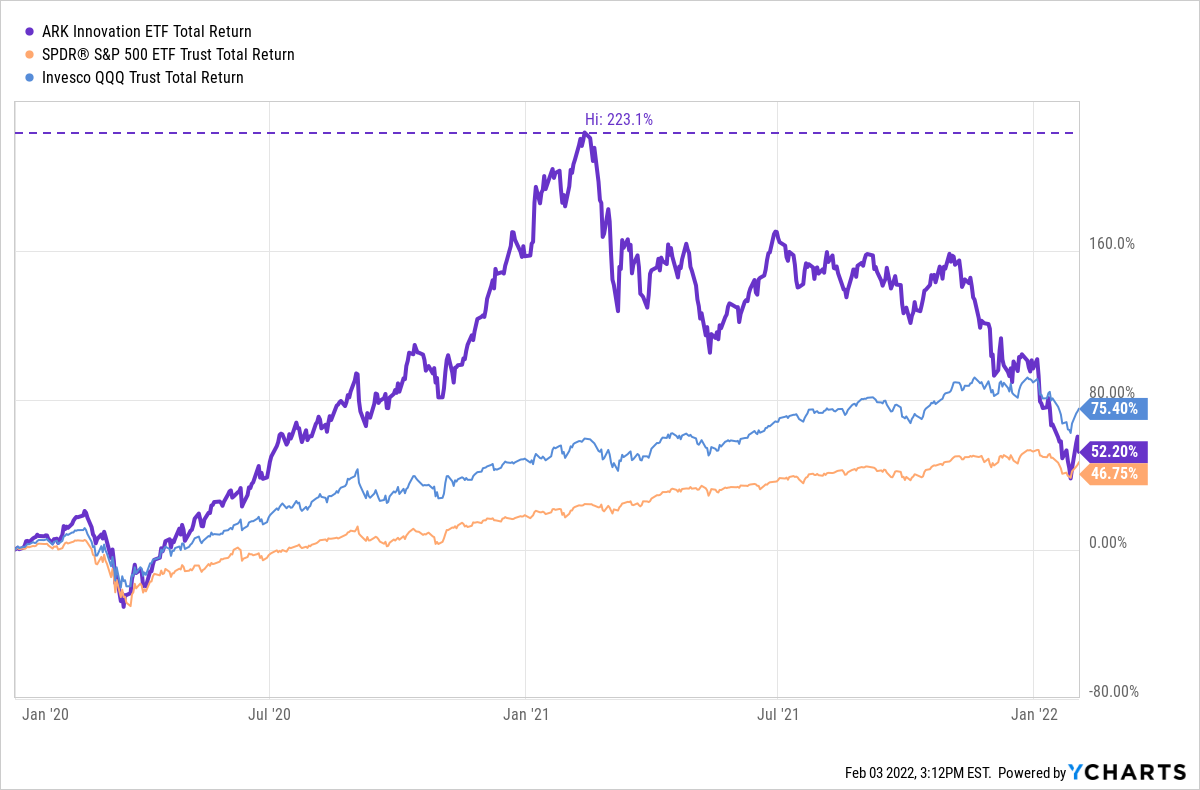
Download Visual | Modify in YCharts
Grayscale Bitcoin Trust Discount/Premium to NAV
Grayscale Ethereum Trust Discount/Premium to NAV
Invesco QQQ Trust (QQQ) Holdings
SPDR® S&P 500 ETF Trust (SPY) Holdings
ARK Innovation ETF (ARKK) Holdings
Grayscale Bitcoin Trust (GBTC)
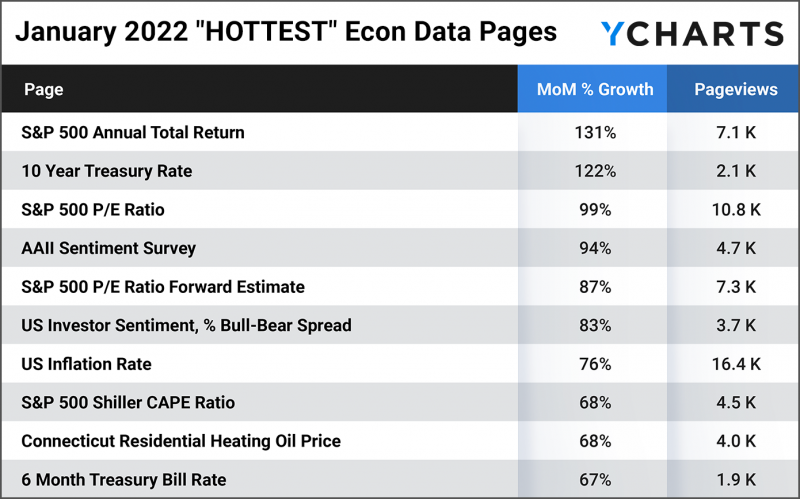
Hottest Econ Data Pages
These economic data pages had the largest month-over-month unique pageview growth in January 2022, as compared to December 2021.
Stock prices crashed in March 2020 then rallied sharply over the months that followed. As corporate earnings dried up and stocks rose on speculation, the S&P 500 P/E ratio spiked dramatically. While the index set a new all-time high in late 2021, the price growth has been supported by surging earnings for stocks, and the forward P/E estimate points to valuation levels on par with pre-pandemic levels.
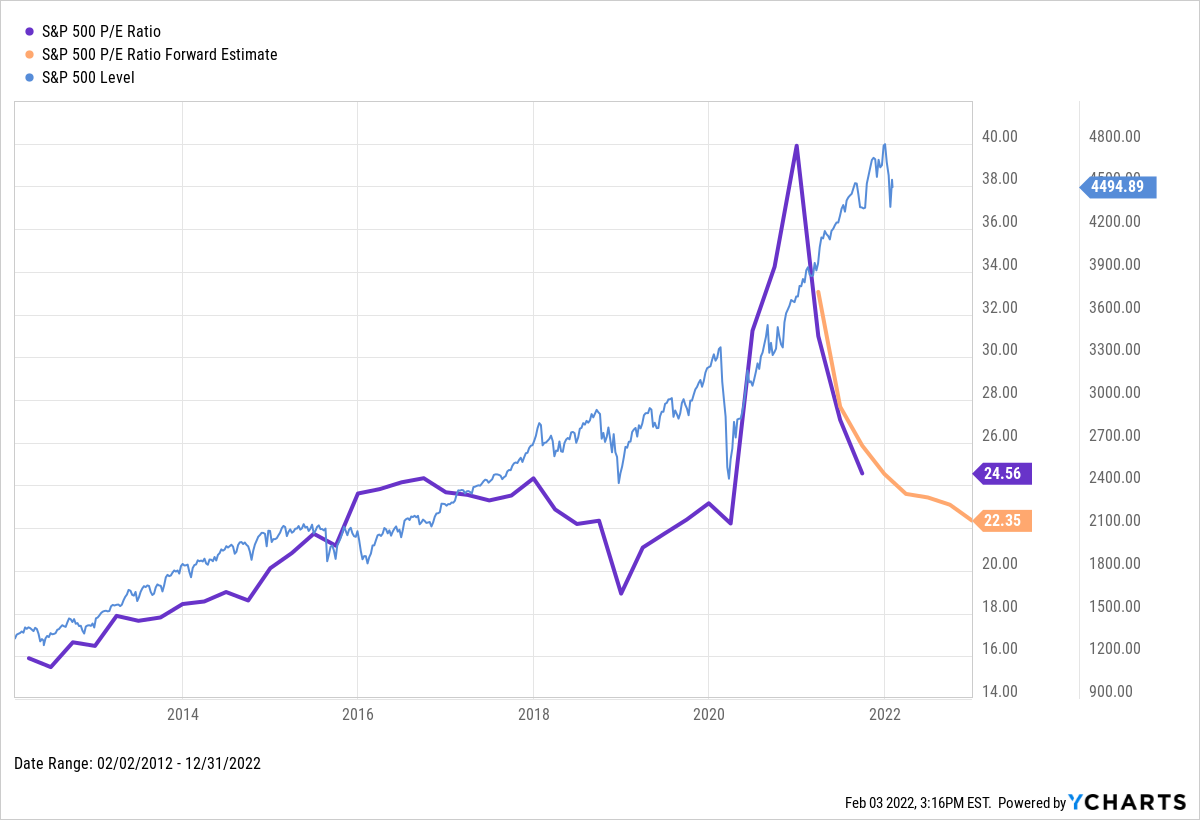
Download Visual | Modify in YCharts
S&P 500 P/E Ratio Forward Estimate
US Investor Sentiment, % Bull-Bear Spread
Connecticut Residential Heating Oil Price
Connect with YCharts
To learn more, call us at (773) 231-5986, or email hello@ycharts.com.
Want to add YCharts to your technology stack? Sign up for a 7-Day Free Trial to see YCharts for yourself.
Disclaimer
©2022 YCharts, Inc. All Rights Reserved. YCharts, Inc. (“YCharts”) is not registered with the U.S. Securities and Exchange Commission (or with the securities regulatory authority or body of any state or any other jurisdiction) as an investment adviser, broker-dealer or in any other capacity, and does not purport to provide investment advice or make investment recommendations. This report has been generated through application of the analytical tools and data provided through ycharts.com and is intended solely to assist you or your investment or other adviser(s) in conducting investment research. You should not construe this report as an offer to buy or sell, as a solicitation of an offer to buy or sell, or as a recommendation to buy, sell, hold or trade, any security or other financial instrument. For further information regarding your use of this report, please go to: ycharts.com/about/disclosure.
Next Article
Can You Hedge Volatility with an ETF?Read More →