The Berkshire Breakdown: Why Buffett’s Succession Sparked an Alarming 11-Point Performance Gap
The Performance Split That Shocked Wall Street
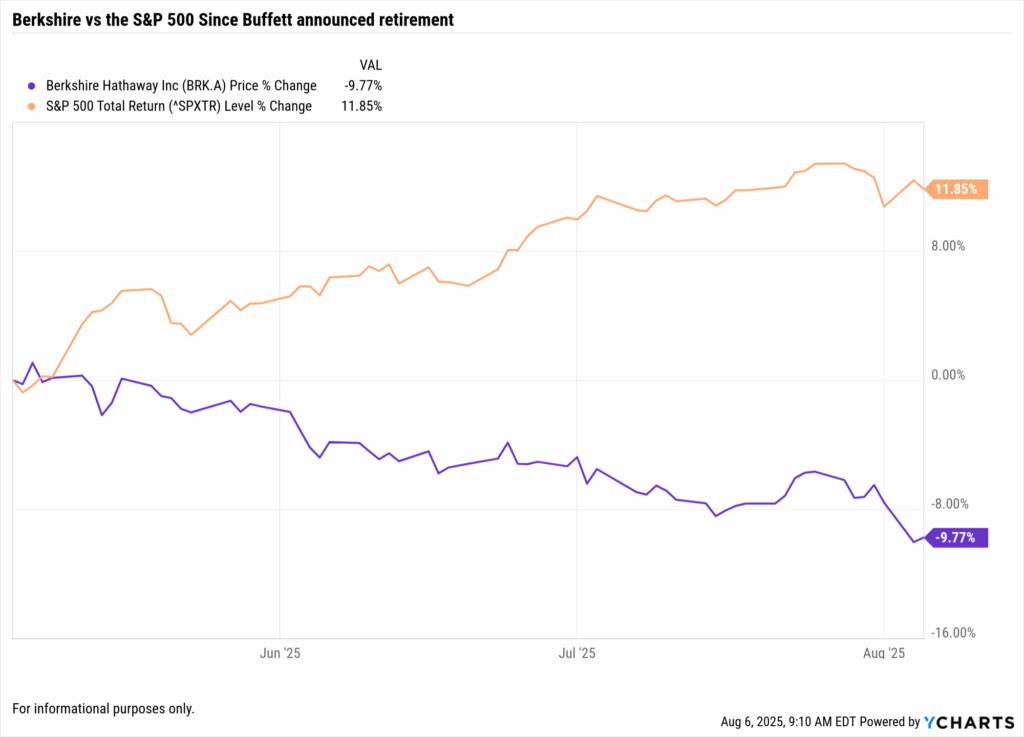
Warren Buffett’s May 3rd, 2025 retirement announcement triggered a historic case of Berkshire underperformance, marking its worst relative return gap against the S&P 500 in decades, with the S&P 500 surging 23.08% while BRK.A managed only 12.05% gains, an unprecedented 11 percentage point gap that signals deeper structural challenges beyond succession anxiety.
Key Performance Metrics at a Glance
| Metric | S&P 500 (SPXTR) | Berkshire Hathaway (BRK.A) | Performance Gap |
|---|---|---|---|
| Return Since May 3, 2025 | +23.08% | +12.05% | -11.03 points |
| Peak Decline from Highs | -8.2% | -15.7% | -7.5 points |
| Days Below 200-MA | 45 days | 89+ days | +44 days |
| Market Cap Lost | N/A | $60 billion | $60B destroyed |
Performance data as of August 6, 2025
Table of Contents
The Day Everything Changed: May 3rd Market Shock
Warren Buffett’s surprise retirement announcement at the May 3rd, 2025 shareholder meeting caught investors and even his designated successor off guard. The 94-year-old Oracle of Omaha announced he would step down as CEO at year-end, with Greg Abel taking over operational control while Buffett remains chairman.
The market reaction was swift and decisive. Berkshire Hathaway Class A shares, which had reached approximately $809,350 at their peak, closed the day down 4.9% to around $769,960, marking the beginning of a sustained period of underperformance that would define the post-Buffett era.
Immediate Market Response
The announcement’s timing amplified its impact. Coming during the traditionally celebratory annual shareholder meeting, Berkshire’s “Woodstock for Capitalists”, the retirement news stunned the 40,000+ attendees who had gathered expecting routine business updates.
Key Market Metrics Following the Announcement:
- Single-day decline: 4.9% drop on May 3rd
- Extended performance: Berkshire fell approximately 14% over the following months
- Relative underperformance: S&P 500 gained roughly 11% during the same period
- Trading activity: Significantly elevated volume in subsequent trading sessions
The succession had been long anticipated by Berkshire watchers, with Abel widely expected to take over operational duties. However, the formal announcement and definitive timeline created immediate questions about the company’s future direction under new leadership.
Wall Street’s response reflected these concerns. Multiple analysts revised their outlooks, with several citing the end of what had been called the “Buffett Premium”, the valuation benefit investors historically assigned to the legendary investor’s track record and market acumen.
Historical Context: Succession Patterns and Precedents
Legendary CEO Transitions: A Mixed Track Record
Berkshire’s current struggles mirror well-documented patterns from other iconic leadership transitions, though outcomes vary dramatically:
Successful Transitions:
- Apple (AAPL): Post-Steve Jobs, delivered 1,200% returns under Tim Cook
- Microsoft (MSFT): Satya Nadella drove 600% gains after Steve Ballmer
- Disney (DIS): Bob Iger initially succeeded with 400% returns before recent challenges
Challenging Transitions:
- General Electric (GE): Multiple failed successions after Jack Welch
- IBM: Struggled through several leadership changes
- Ford (F): Family succession issues persist decades later
Berkshire’s Unique Vulnerability
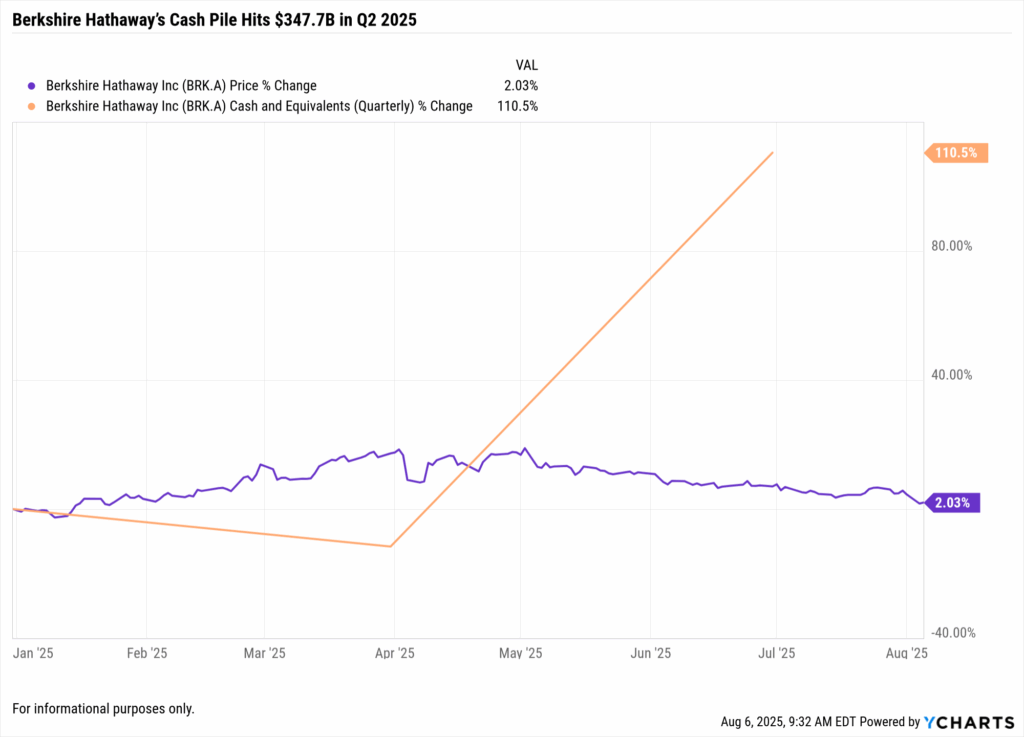
Unlike technology companies that can pivot strategies quickly, Berkshire’s massive scale creates unique constraints. With a $1.2 trillion market capitalization and $347.7 billion in cash, the company faces what Buffett called “the mathematics of large numbers”, few investments can meaningfully impact returns.
Recent performance data shows the challenges facing large-cap value investing in the current market environment. While Berkshire delivered exceptional long-term returns over Buffett’s 60-year tenure, famously turning $1,000 into over $55 million, the company has faced increasing headwinds in recent years as growth stocks dominated market leadership.
The Numbers Don’t Lie: Structural Drivers of Berkshire Underperformance
Cash Deployment Challenge
Berkshire’s record $347.7 billion cash position represents both opportunity and obstacle. While providing defensive strength, this cash mountain earns modest 4-5% returns while growth stocks deliver exponential gains. The sheer size of Berkshire’s balance sheet is increasingly viewed as a contributor to persistent Berkshire underperformance, especially in a market driven by fast-moving growth names.
Warren Buffett has long acknowledged this challenge, noting that “Companies capable of moving the needle have been endlessly picked over by us and by others.” The scale constraints that once provided advantages now limit investment options for a conglomerate of Berkshire’s size.
The numbers tell the story: Berkshire has been a net seller of stocks for multiple consecutive quarters, selling nearly $174 billion over the past 10 quarters while struggling to find attractive acquisition targets that could meaningfully impact returns for a company with over $1 trillion in assets.
Portfolio Composition Analysis
Berkshire’s Top Holdings by Portfolio Weight:
| Holding | Portfolio Weight | Sector | Style Classification |
|---|---|---|---|
| Apple (AAPL) | 25.76% | Technology | Large-Cap Growth |
| American Express (AXP) | 15.77% | Financial Services | Large-Cap Value |
| Coca-Cola (KO) | 11.07% | Consumer Staples | Large-Cap Value |
| Occidental Petroleum (OXY) | 8.9% | Energy | Large-Cap Value |
| Moody's (MCO) | 4.2% | Financial Services | Large-Cap Growth |
Portfolio Style Breakdown:
- Value-oriented holdings: 65% of equity portfolio
- Growth-oriented holdings: 30% of equity portfolio
- Cash and equivalents: $347.7 billion (29% of total assets)
The portfolio’s heavy concentration in traditional value sectors, financial services, energy, and consumer staples, has created structural headwinds during a period when growth stocks and technology have driven market returns. While Apple provides significant technology exposure, it represents Berkshire’s only major position in the AI ecosystem currently powering market leadership.
Insurance Operations Under Pressure
While historically profitable, Berkshire’s insurance operations face mounting challenges:
- GEICO: Despite 2024 turnaround ($3.6B pretax profit), competitive pressures intensify
- Reinsurance: Social inflation and climate losses strain underwriting margins
- General Re: $1.1 billion in wildfire losses from Southern California events
Q2 2025 insurance underwriting profits fell 11% year-over-year despite generating $174 billion in valuable float.
What This Means for Investors
The 11 percentage point performance gap between Berkshire and the S&P 500 since Buffett’s retirement announcement reflects both immediate succession concerns and longer-term structural challenges facing value investing in today’s market environment.
Key Takeaways:
- The succession from Buffett to Greg Abel represents the end of an era for American investing
- Berkshire’s massive scale and cash position create both opportunities and constraints
- The company’s value-oriented approach faces headwinds in a growth-dominated market
- The company’s value-oriented approach faces headwinds in a growth-dominated market, contributing to ongoing Berkshire underperformance
While the immediate market reaction was severe, investors should consider whether current valuations present long-term opportunities for those willing to accept the risks of a post-Buffett Berkshire Hathaway.
Whenever you’re ready, there are 3 ways YCharts can help you:
1. Want to reduce time spent researching stocks, funds, or macro trends?
Explore how advisors are using AI in YCharts to accelerate their workflows.
2. Wondering how an efficient, compliant, and personalized proposal process could transform your business?
Check out how Alan Cohen used YCharts Proposals to double his business, and how you can too.
3. Want to test out YCharts for free?
Start a no-risk 7-Day Free Trial.
Disclaimer
©2025 YCharts, Inc. All Rights Reserved. YCharts, Inc. (“YCharts”) is not registered with the U.S. Securities and Exchange Commission (or with the securities regulatory authority or body of any state or any other jurisdiction) as an investment adviser, broker-dealer or in any other capacity, and does not purport to provide investment advice or make investment recommendations. This report has been generated through application of the analytical tools and data provided through ycharts.com and is intended solely to assist you or your investment or other adviser(s) in conducting investment research. You should not construe this report as an offer to buy or sell, as a solicitation of an offer to buy or sell, or as a recommendation to buy, sell, hold or trade, any security or other financial instrument. For further information regarding your use of this report, please go to: ycharts.com/about/disclosure
Next Article
Monthly Market Wrap: July 2025Read More →