Monthly Market Wrap: July 2025

Welcome back to the Monthly Market Wrap from YCharts, where we dissect crucial market trends for advisors and their clients. This July, most equity indices finished the month in the black to start the second half of 2025, while the median sales price of existing homes set an all-time high for the first time in twelve months and treasury yields rose across the curve.
Want to use these visuals in your own presentations? Download our free Monthly Market Wrap slide deck, containing all charts featured in the Market Wrap and more in a shareable, presentation-ready format.
July 2025 Market Summary: Stocks Rise to Start 2H 2025, Median Sale Price of Existing Homes Hits New High, Treasury Yields Rise
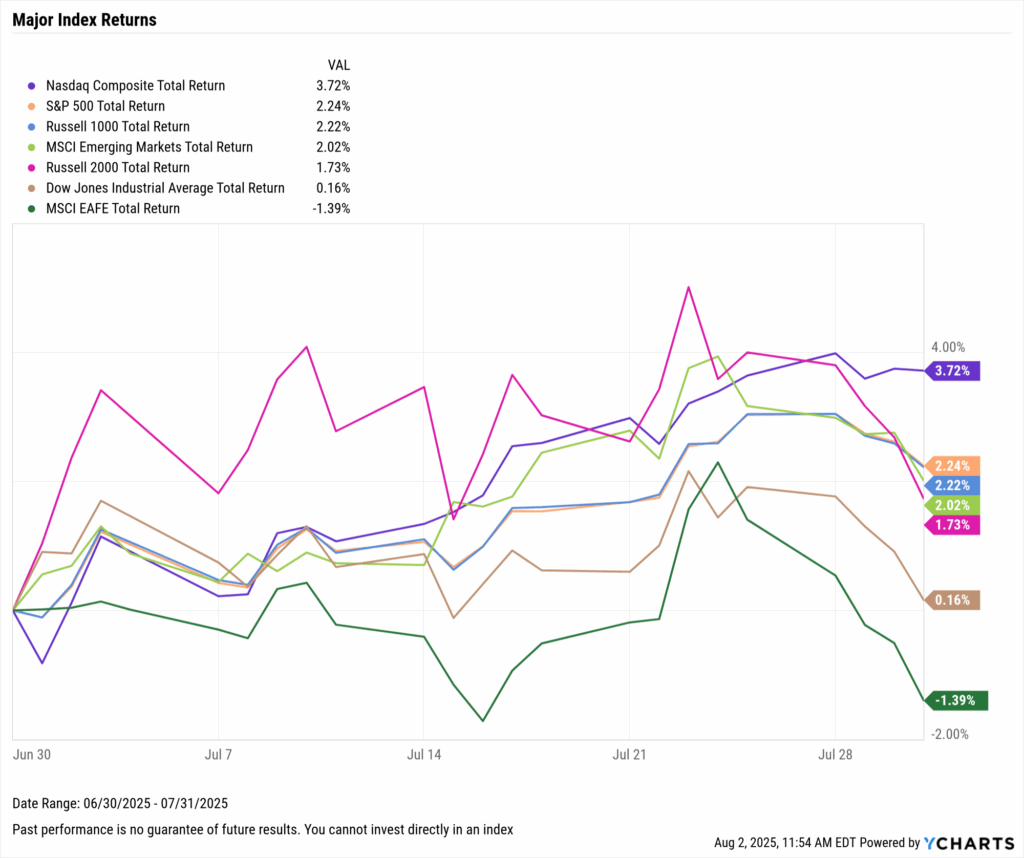
Equities kicked off the second half of 2025 on a mostly positive note with most indices posting gains in July. The Dow Jones Industrial Average rose 0.2%, the S&P 500 added 2.2%, and the Nasdaq Composite advanced 3.7%. Only Developed EAFE Markets had a negative July, shedding 1.4% in the month.
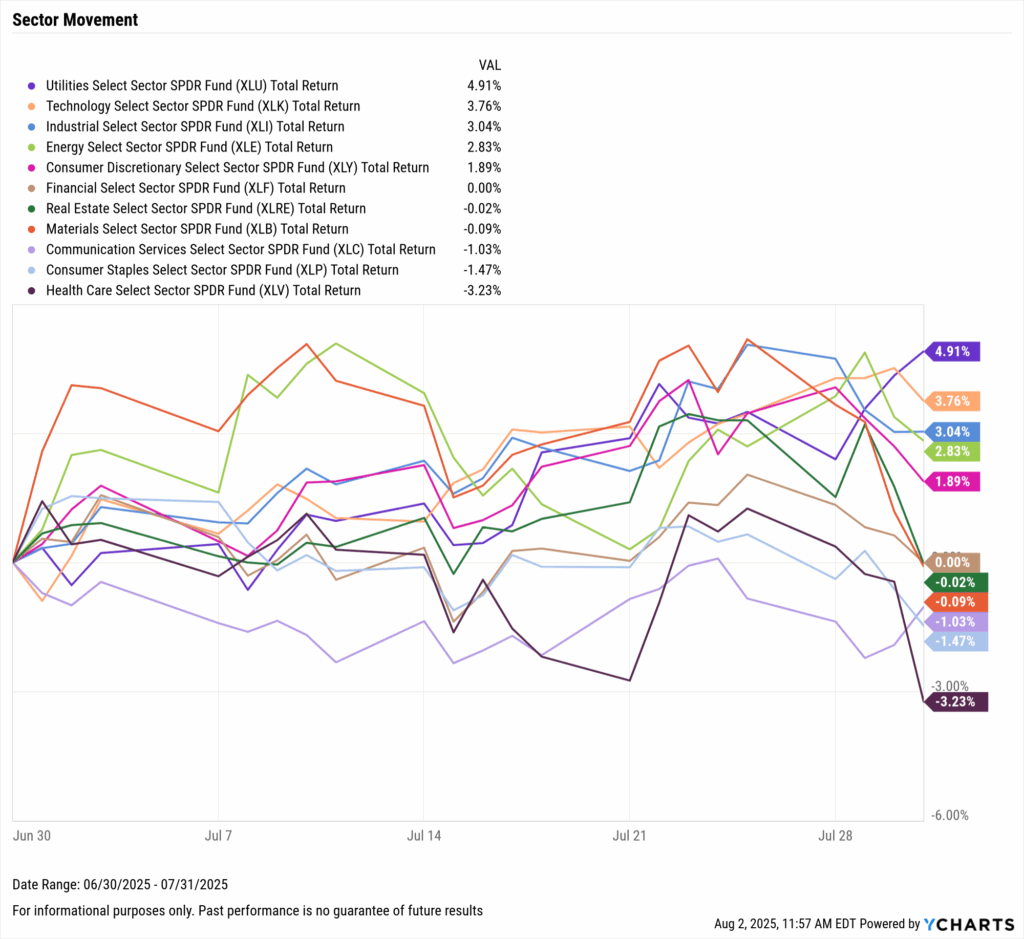
The most defensive and most cyclically-sensitive sectors topped the list for July: Utilities and Technology, which rose 4.9% and 3.8%, respectively. Industrials came in third place with a 3% gain. Six of the ten worst-performing S&P 500 stocks in July were Health Care names, dragging the sector down by 3.2%, making it the worst performer in July.
The Median Sales Price of Existing Homes rose to $435,500 in June, setting a new all-time high for the first time in twelve months. Oil prices spiked further in July following a volatile June; the price of Brent crude spiked 4% in July, while WTI rose 2.3%. The Federal Reserve maintained its key Fed Funds Rate target range of 4.25%-4.50% at the FOMC’s July 30th meeting, but the majority of investors currently anticipate the Fed will cut the target rate by 25 basis points at its next meeting on September 17th.
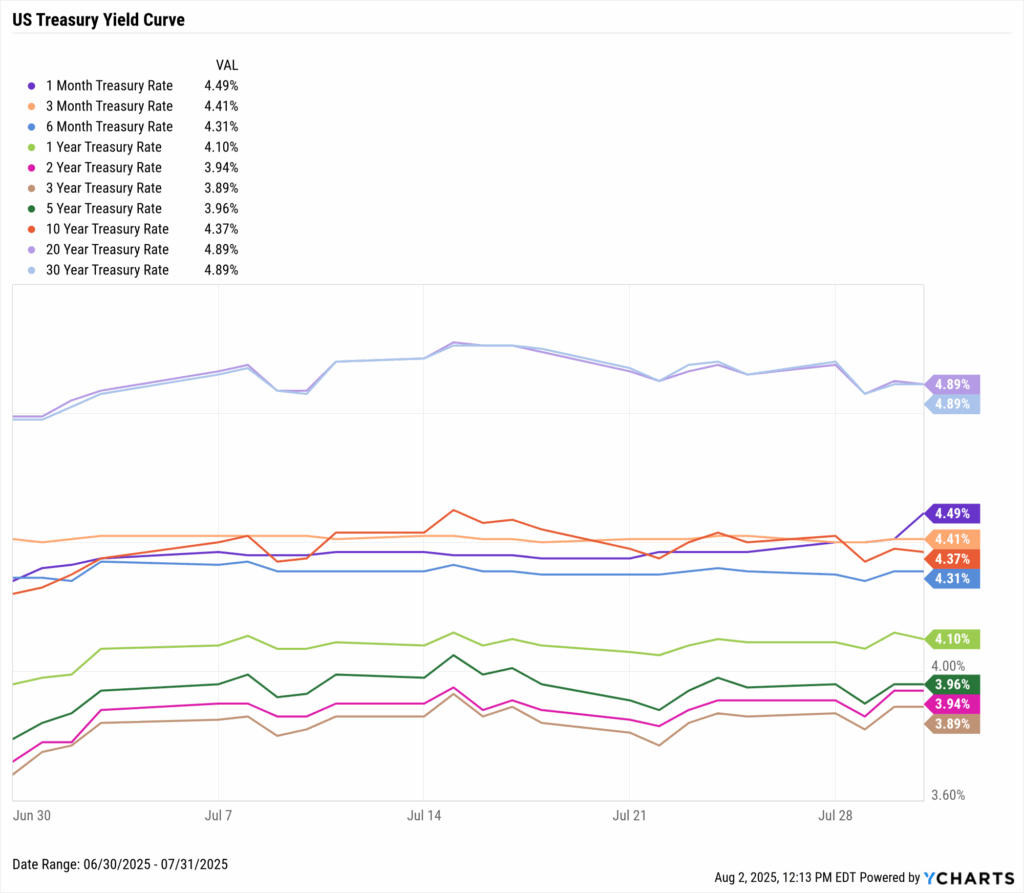
Treasury yields rose across the board in July, with the exception of the 3-month Treasury Rate which stayed flat MoM at 4.41%. The 2-year Treasury Rate logged the highest monthly increase of 22 basis points. Higher yields across the curve pushed prices of bond funds lower, such as the iShares 20+ Year Treasury Bond ETF (TLT), which slipped 1.1% in July.
Jump to Fixed Income Performance
Want to create your own monthly recap, complete with these charts in a presentation deck that contains your firm’s branding? Start a Free Trial →
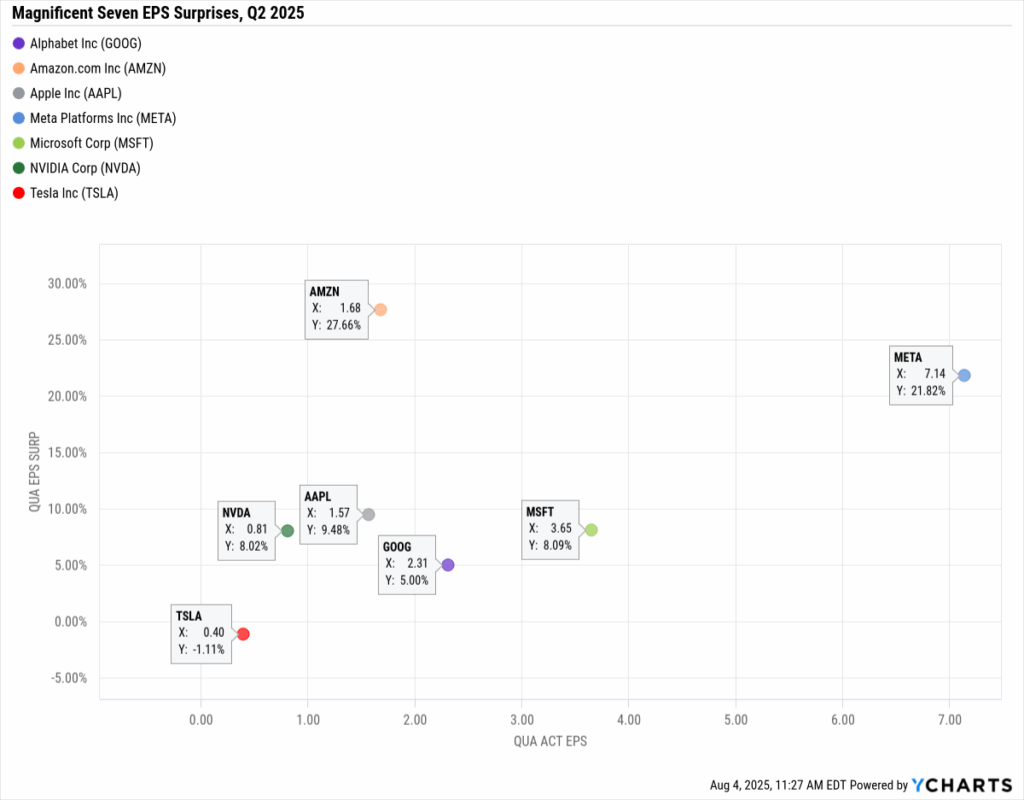
Off the YCharts! Magnificent Seven Q2 Earnings Surprises
This earnings season, many eyes were fixed to the Q2 reports of the Magnificent Seven stocks for company-specific guidance and potential market-wide outlooks.
Six of the seven Magnificent Seven companies beat their latest earnings estimates by posting a positive EPS surprise. These names were Alphabet (GOOG), Amazon (AMZN), Apple (AAPL), Meta Platforms (META), Microsoft (MSFT), and NVIDIA (NVDA).
The lone outlier? Tesla (TSLA), which missed its earnings estimates by 1.1%.
Download Visual | Modify in YCharts
Equity Performance: Equities Begin Second Half of 2025 On Generally Positive Note; Utilities and Tech Lead, Health Care Lags
Major Indices
Download Visual | Modify in YCharts | View Below Table in YCharts
| Index | 1 Month Total Returns | 3 Month Total Returns | 6 Month Total Returns | 1 Year Total Returns |
|---|---|---|---|---|
| Nasdaq Composite | 3.7% | 21.3% | 8.0% | 20.9% |
| S&P 500 | 2.2% | 14.2% | 5.6% | 16.3% |
| Russell 1000 | 2.2% | 14.3% | 5.1% | 16.5% |
| MSCI Emerging Markets | 2.0% | 12.9% | 15.8% | 17.9% |
| Russell 2000 | 1.7% | 13.0% | -2.6% | -0.6% |
| Dow Jones Industrial Average | 0.2% | 9.0% | -0.1% | 9.9% |
| MSCI EAFE | -1.4% | 5.6% | 12.3% | 13.3% |
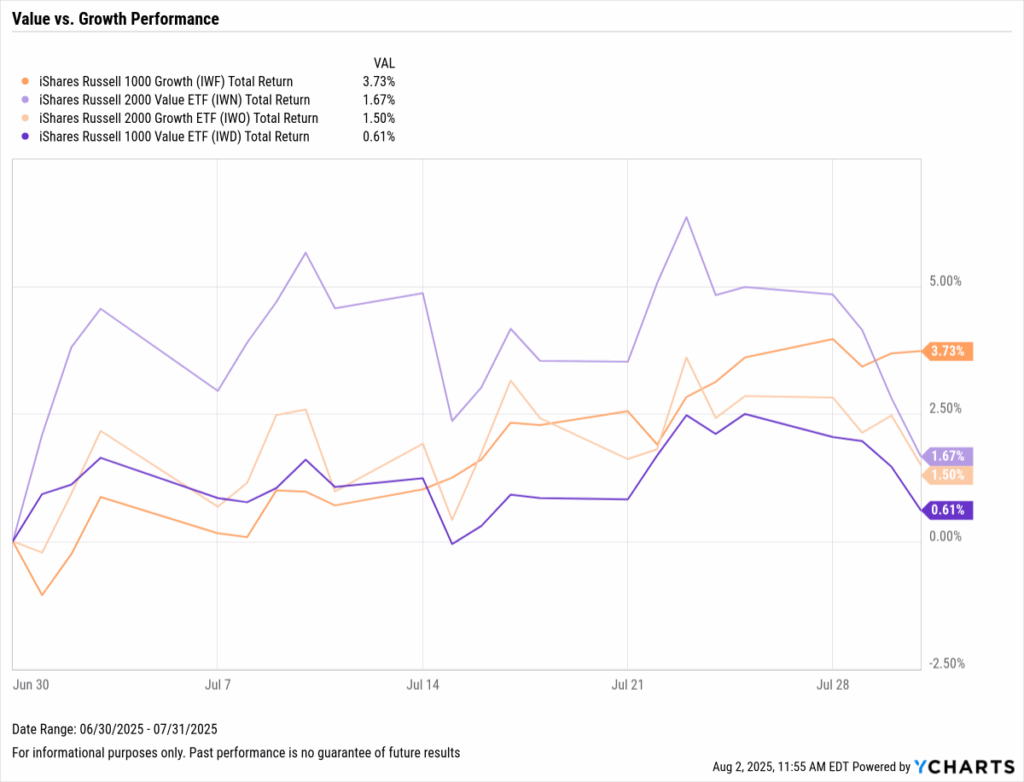
Value vs. Growth Performance
Download Visual | Modify in YCharts | View Below Table in YCharts
| Ticker | Name | 1 Month Total Returns | 3 Month Total Returns | 6 Month Total Returns | 1 Year Total Returns |
|---|---|---|---|---|---|
| IWF | iShares Russell 1000 Growth | 3.7% | 20.2% | 7.8% | 23.5% |
| IWN | iShares Russell 2000 Value ETF | 1.7% | 11.3% | -3.5% | -4.6% |
| IWO | iShares Russell 2000 Growth ETF | 1.5% | 14.6% | -2.0% | 3.0% |
| IWD | iShares Russell 1000 Value ETF | 0.6% | 7.7% | 1.8% | 8.6% |
US Sector Movement
Download Visual | Modify in YCharts | View Below Table in YCharts
| Ticker | Sector | 1 Month Total Returns | 3 Month Total Returns | 6 Month Total Returns | 1 Year Total Returns |
|---|---|---|---|---|---|
| XLU | Utilities | 4.9% | 9.3% | 11.5% | 21.1% |
| XLK | Technology | 3.8% | 25.3% | 14.2% | 20.9% |
| XLI | Industrial | 3.0% | 16.2% | 10.5% | 20.6% |
| XLE | Energy | 2.8% | 9.2% | 1.1% | -3.4% |
| XLY | Consumer Discretionary | 1.9% | 12.5% | -4.2% | 19.1% |
| XLF | Financial | 0.0% | 7.8% | 2.5% | 21.5% |
| XLRE | Real Estate | 0.0% | 1.2% | 1.5% | 3.9% |
| XLB | Materials | -0.1% | 5.1% | -0.2% | -2.9% |
| XLC | Communication Services | -1.0% | 12.8% | 5.5% | 26.6% |
| XLP | Consumer Staples | -1.5% | -1.8% | 2.2% | 5.1% |
| XLV | Health Care | -3.2% | -6.7% | -10.4% | -11.4% |
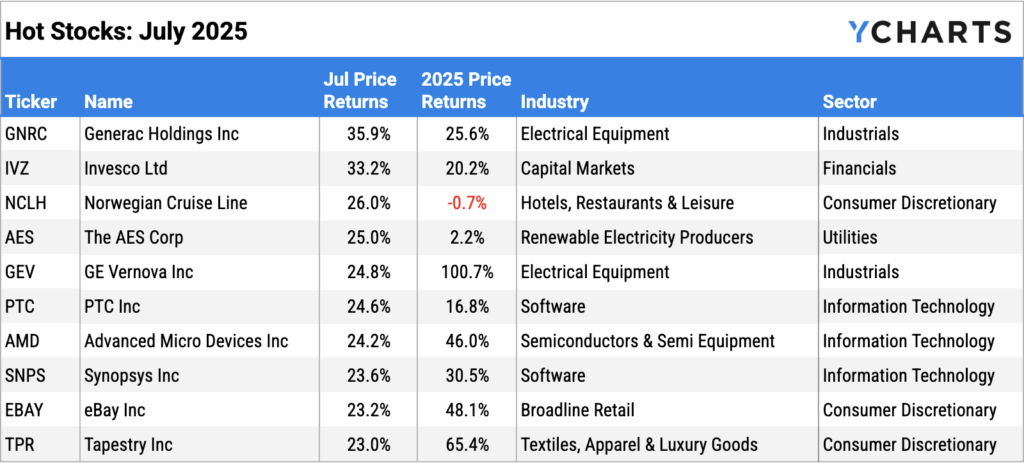
Hot Stocks: Top 10 S&P 500 Performers of July 2025
Download Visual | Modify in YCharts
| Symbol | Name | 1 Month Price Returns | YTD Price Returns | Industry | Sector |
|---|---|---|---|---|---|
| GNRC | Generac Holdings Inc | 35.9% | 24.9% | Electrical Equipment | Industrials |
| IVZ | Invesco Ltd | 33.2% | 17.9% | Capital Markets | Financials |
| NCLH | Norwegian Cruise Line Holdings Ltd | 26.0% | -4.8% | Hotels, Restaurants & Leisure | Consumer Discretionary |
| AES | The AES Corp | 25.0% | 2.8% | Independent Power & Renewable Electricity Producers | Utilities |
| GEV | GE Vernova Inc | 24.8% | 99.6% | Electrical Equipment | Industrials |
| PTC | PTC Inc | 24.6% | 15.4% | Software | Information Technology |
| AMD | Advanced Micro Devices Inc | 24.2% | 42.1% | Semiconductors & Semiconductor Equipment | Information Technology |
| SNPS | Synopsys Inc | 23.6% | 27.5% | Software | Information Technology |
| EBAY | eBay Inc | 23.2% | 48.1% | Broadline Retail | Consumer Discretionary |
| TPR | Tapestry Inc | 23.0% | 62.7% | Textiles, Apparel & Luxury Goods | Consumer Discretionary |
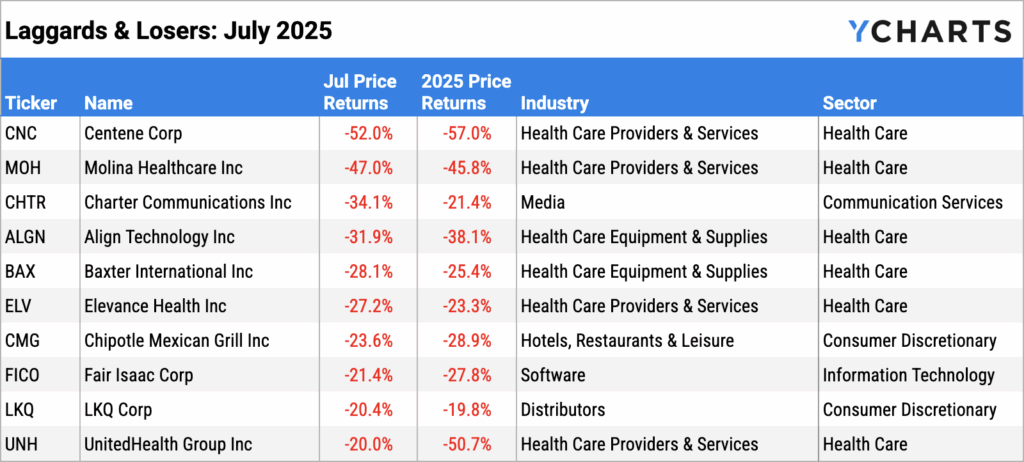
Laggards & Losers: 10 Worst S&P 500 Performers of July 2025
Download Visual | Modify in YCharts
| Symbol | Name | 1 Month Price Returns | YTD Price Returns | Industry | Sector |
|---|---|---|---|---|---|
| CNC | Centene Corp | -52.0% | -57.2% | Health Care Providers & Services | Health Care |
| MOH | Molina Healthcare Inc | -47.0% | -46.7% | Health Care Providers & Services | Health Care |
| CHTR | Charter Communications Inc | -34.1% | -22.8% | Media | Communication Services |
| ALGN | Align Technology Inc | -31.9% | -34.5% | Health Care Equipment & Supplies | Health Care |
| BAX | Baxter International Inc | -28.1% | -24.7% | Health Care Equipment & Supplies | Health Care |
| ELV | Elevance Health Inc | -27.2% | -25.5% | Health Care Providers & Services | Health Care |
| CMG | Chipotle Mexican Grill Inc | -23.6% | -29.5% | Hotels, Restaurants & Leisure | Consumer Discretionary |
| FICO | Fair Isaac Corp | -21.4% | -30.6% | Software | Information Technology |
| LKQ | LKQ Corp | -20.4% | -19.3% | Distributors | Consumer Discretionary |
| UNH | UnitedHealth Group Inc | -20.0% | -53.0% | Health Care Providers & Services | Health Care |
Featured Market News and YCharts Insights
Helping Clients Navigate the “Big Beautiful Bill”
Structure Prospect Meetings to Improve Engagement and Close More Clients
5 Conversations That Turn Summer Into a Planning Season
Bitcoin for Financial Advisors: Price Trends, Portfolio Strategy, and Client Communication
The 10 Best Performing Stocks in the Last 25 Years
YCharts Monthly Product Update
Economic Data Overview: Oil Prices Climb Higher, Single-Family Home Prices Surpass All-Time High
Employment
The unemployment rate remained at 4.2% in July for the fourth month out of the last five, even as the labor force participation rate fell a tenth of a percentage point to 62.2%. The most recent nonfarm payrolls report showed 73,000 jobs were added to the U.S. economy in July, as payroll figures for both May and June were revised significantly down by more than 250,000 combined.
Consumers and Inflation
The US inflation rate logged a slight increase MoM, coming in at 2.67% in June. Core inflation rose to 2.93% between May and June. The US Consumer Price Index inched higher by 0.3% MoM in June, and US Personal Spending grew 0.34% between May and June.
The Federal Reserve maintained its key Fed Funds Rate target range of 4.25%-4.50% at the FOMC’s July 30th meeting, the fifth consecutive meeting in which it has voted to do so. The next meeting will take place on September 17th, at which the majority of investors currently anticipate the Fed will buck its recent trend by cutting the target rate by 25 basis points, according to the CME FedWatch tool.
Production and Sales
The US ISM Manufacturing PMI decreased one point in July to 48.0, while the Services PMI rose 0.9 points to 50.8, putting the latter PMI back into expansion territory. The YoY US Producer Price Index rose slightly to 2.34% in June, and US Retail and Food Services Sales rebounded 0.64% MoM after posting the largest MoM decline in May since April 2023.
Housing
US New Single-Family Home Sales rose 0.64% MoM in June on the heels of a double-digit decline last month, while Existing Home Sales contracted 2.72% in the same month. The Median Sales Price of Existing Homes set a new all-time high in June for the first time since June 2024, climbing 2.74% MoM to $435,300. Mortgage rates were relatively unchanged throughout July; the 15-year Mortgage Rate was 5.85% as of July 31st, while the 30-year ended the month at 6.72%.
Commodities
The SPDR Gold Shares ETF (GLD) rose as much as 3.7% in July before settling at $302.96, a monthly decline of 0.61%. Oil prices increased in July following a volatile June stemming from concerns over diminishing production in the Middle East; the price of Brent crude spiked 4% in July to $70.87 per barrel as of July 31st, while WTI rose 2.3% to $67.81. Despite the higher oil prices, the average price of gas fell four cents to $3.24 per gallon MoM.
Cryptocurrencies
Major cryptocurrencies continued to roar higher in July. Bitcoin rose 8.7% in July to end the month at $117,833.20, bringing the asset class up 27.2% YTD. However, Ethereum surged 52.1% to $3,807.42 as of July 31st, erasing the second-largest cryptocurrency’s YTD deficit to net a positive 13.3% gain through the first seven months of 2025.
Fixed Income Performance: Insights into Bond ETFs and Treasury Yields
US Treasury Yield Curve
1 Month Treasury Rate: 4.49%
3 Month Treasury Rate: 4.41%
6 Month Treasury Rate: 4.31%
1 Year Treasury Rate: 4.10%
2 Year Treasury Rate: 3.94%
3 Year Treasury Rate: 3.89%
5 Year Treasury Rate: 3.96%
10 Year Treasury Rate: 4.37%
20 Year Treasury Rate: 4.89%
30 Year Treasury Rate: 4.89%
Download Visual | Modify in YCharts
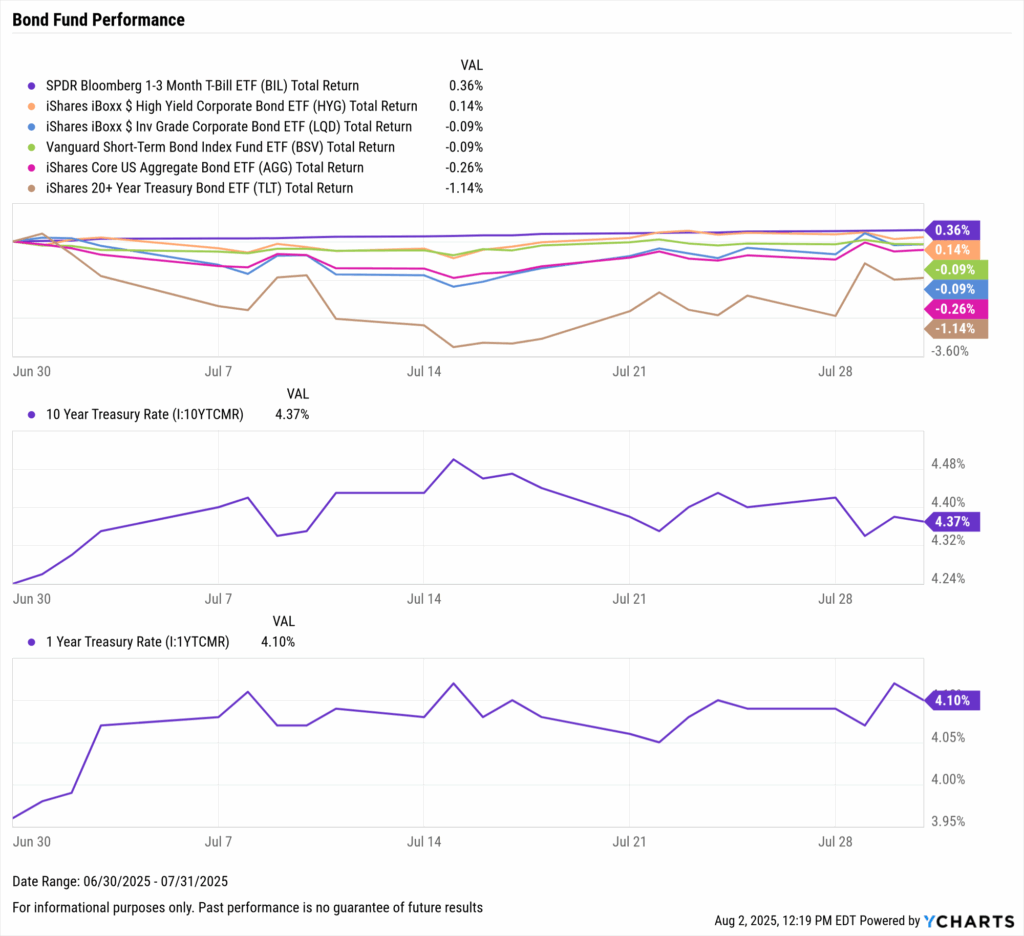
Bond Fund Performance
Download Visual | Modify in YCharts | View Below Table in YCharts
| Ticker | Name | 1 Month Total Returns | 3 Month Total Returns | 6 Month Total Returns | 1 Year Total Returns |
|---|---|---|---|---|---|
| BIL | SPDR Bloomberg 1-3 Month T-Bill ETF | 0.4% | 1.1% | 2.1% | 4.5% |
| HYG | iShares iBoxx $ High Yield Corporate Bond ETF | 0.1% | 3.8% | 3.8% | 8.5% |
| BSV | Vanguard Short-Term Bond Index Fund ETF | -0.1% | 0.4% | 2.9% | 4.7% |
| LQD | iShares iBoxx $ Inv Grade Corporate Bond ETF | -0.1% | 2.2% | 3.9% | 4.1% |
| AGG | iShares Core US Aggregate Bond ETF | -0.3% | 0.6% | 3.2% | 3.4% |
| TLT | iShares 20+ Year Treasury Bond ETF | -1.1% | -1.8% | 1.2% | -4.4% |
Stay updated with the latest market trends, economic data, and financial analysis with YCharts, your go-to source for financial insights and advisor tools. Download the visual aids directly from YCharts, and contact us for customized access to these charts.
Have a great August! 📈
Whenever you’re ready, there are 3 ways YCharts can help you:
1. Looking for a tool to help you better communicate market events?
Send us an email at hello@ycharts.com or call (866) 965-7552. You’ll be directly in touch with one of our Chicago-based team members.
2. Want to test out YCharts for free?
Start a no-risk 7-Day Free Trial.
3. Download a copy of the Monthly Market Wrap slide deck:
Disclaimer
©2025 YCharts, Inc. All Rights Reserved. YCharts, Inc. (“YCharts”) is not registered with the U.S. Securities and Exchange Commission (or with the securities regulatory authority or body of any state or any other jurisdiction) as an investment adviser, broker-dealer or in any other capacity, and does not purport to provide investment advice or make investment recommendations. This report has been generated through application of the analytical tools and data provided through ycharts.com and is intended solely to assist you or your investment or other adviser(s) in conducting investment research. You should not construe this report as an offer to buy or sell, as a solicitation of an offer to buy or sell, or as a recommendation to buy, sell, hold or trade, any security or other financial instrument. For further information regarding your use of this report, please go to: ycharts.com/about/disclosure
Next Article
Tech IPOs, Antitrust Shakeups & the 2025 Market: What Advisors Can’t Afford to MissRead More →