Breaking Open the Black Box: Introducing Transparent, Customizable Risk Profiles
For many advisors, risk profiling tools feel like a black box.
You ask the right questions, walk clients through a risk tolerance questionnaire, and get a score—but what exactly does that number mean? How was it calculated? And more importantly, how does it map to an actual portfolio recommendation?
When risk scoring is opaque, rigid, or misaligned with your investment philosophy, it becomes hard to explain your recommendations. Even worse, it becomes harder for clients to understand them. That lack of clarity can quickly erode trust.
Risk Profiles on YCharts break open the black box. Now, you can connect portfolio recommendations to client risk preferences in a clear, scalable, and fully customizable way—through an intuitive proposal workflow.
Align Strategy to Risk—Without the Guesswork
Risk Profiles let you assign your model portfolios to predefined risk levels and apply them across clients and proposals in just a few clicks. In addition, you can customize profile names, descriptions, asset allocation bands, and metric ranges to reflect how you talk about risk—keeping proposals aligned with your process and investment philosophy.
No more building allocations from scratch or stitching together disconnected tools to bridge the gap between risk preferences and portfolio construction.
The result? A proposal workflow that’s faster, more consistent, and easier for you to explain—and for clients to understand.
Whether you’re using firm-approved or your own models, Risk Profiles help you scale personalized proposals without sacrificing clarity or control.
See It In Action
Want a quick walkthrough? Nick Maggiulli, COO of Ritholtz Wealth Management, shows how Risk Profiles support your proposal workflow in the video below.
Visuals That Explain the “Why”
Clients shouldn’t have to guess why a portfolio is right for them. Risk Profiles bring clarity to your recommendations with intuitive visuals that show exactly how a strategy aligns with their risk preferences—making the story behind the portfolio easy to see and easier to trust.
The Talking Points module illustrates how the client is allocated today, what their selected risk profile recommends, and how your proposed model portfolio fits within that range.
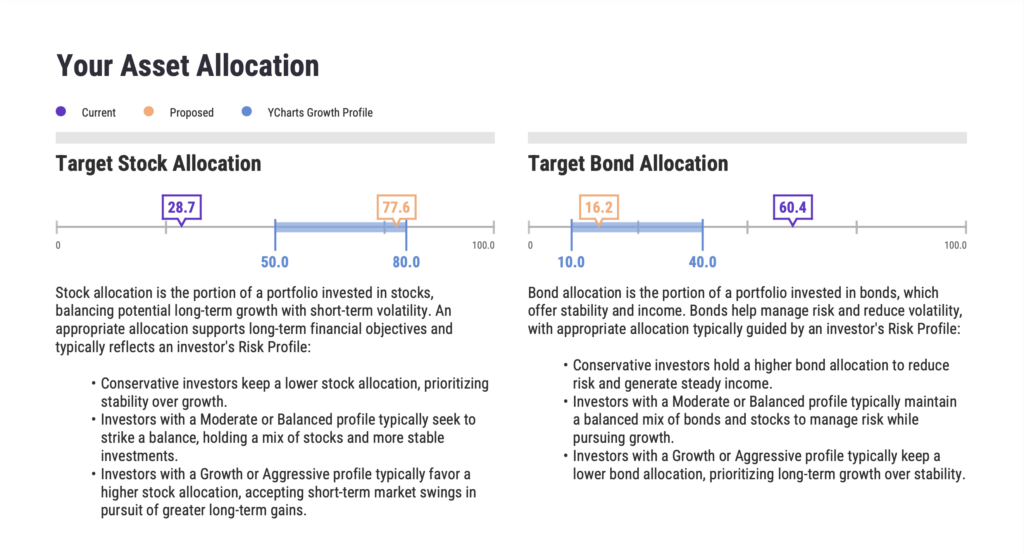
The blue-shaded band is fully customizable, reinforcing that that your guidance is grounded in the client’s comfort level and your expertise. Other visuals—like allocation comparison and the risk/reward scatter plots—further support your recommendations and simplify complex concepts for clients.
Built for Your Workflow
Whether you’re a solo advisor running your own models or part of a larger firm using standardized models, Risk Profiles adapt to the way you ork—without adding friction.
Get started quickly with public templates or create a fully customized risk framework to match your firm’s philosophy. Once your profiles are set, YCharts tools help you move from intake to proposal seamlessly:
• Use Quick Extract to upload client holdings in seconds
• Identify gaps and optimization opportunities with Quickflows
• Generate a fully branded, risk-aligned proposal directly within your existing Proposal Workflow
Because Risk Profiles live inside the same platform you already use for research, model management, and presentations, there’s no switching between tools. It’s a unified experience—from insight to outcome—so you can stay focused on client relationships and your organic growth goals.
Whenever you’re ready, here’s how YCharts can help you:
1. Want to know how much time you could save on proposals?
Calculate Your ROI with YCharts and see the impact for your business.
2. Looking to move on from your investment research and analytics platform?
3. Want to test out YCharts for free?
Start a no-risk 7-Day Free Trial.
Disclaimer
©2025 YCharts, Inc. All Rights Reserved. YCharts, Inc. (“YCharts”) is not registered with the U.S. Securities and Exchange Commission (or with the securities regulatory authority or body of any state or any other jurisdiction) as an investment adviser, broker-dealer or in any other capacity, and does not purport to provide investment advice or make investment recommendations. This report has been generated through application of the analytical tools and data provided through ycharts.com and is intended solely to assist you or your investment or other adviser(s) in conducting investment research. You should not construe this report as an offer to buy or sell, as a solicitation of an offer to buy or sell, or as a recommendation to buy, sell, hold or trade, any security or other financial instrument. For further information regarding your use of this report, please go to: ycharts.com/about/disclosure
Next Article
Q1 2025 Financial Sector Earnings: Live Updates & Market ReactionsRead More →