Economic Update: Reviewing Q2 2024

Below is a sneak peek of insights from the YCharts Q2 2024 Economic Summary Deck. This quarter, equities, led by a “Magnificent Trio” of big tech companies, continued to advance. Meanwhile, housing experienced a rare shift, and Emerging Markets outperformed the broader market.
The deck, published quarterly, arms advisors and investors with key insights from the previous quarter to help you make smarter investment decisions going forward.
You can also catch the top market and economic storylines from Q2 in our new 5-minute video recap. Watch below:
Market and Asset Class Update
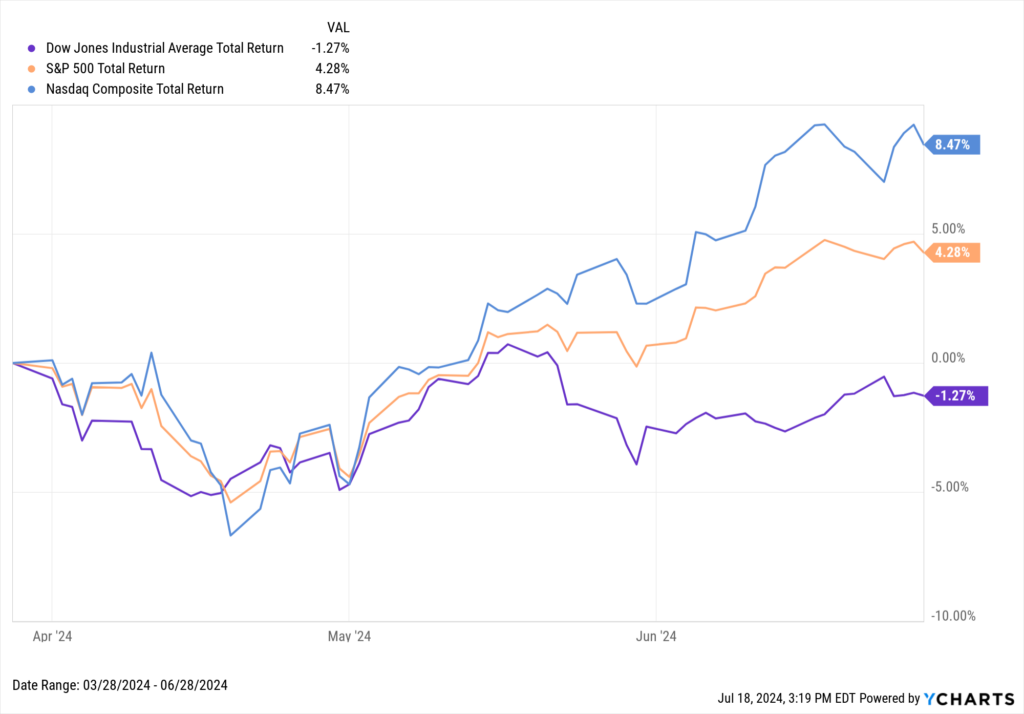
Two of the three major U.S. indices ascended in Q2 2024. The NASDAQ rose 8.5% in Q2, reemerging as a leader after lagging behind the S&P 500 in Q1. The S&P, for its part, advanced 4.3% in the second quarter of the year, while the Dow Jones fell 1.3%.
Download Visual | Modify in YCharts
Despite the Dow’s dip, all three major US indices ended the first half of 2024 in positive territory. The NASDAQ surged 18.6%, the S&P advanced 15.3%, and the Dow Jones experienced a lesser yet positive increase of 4.8%.
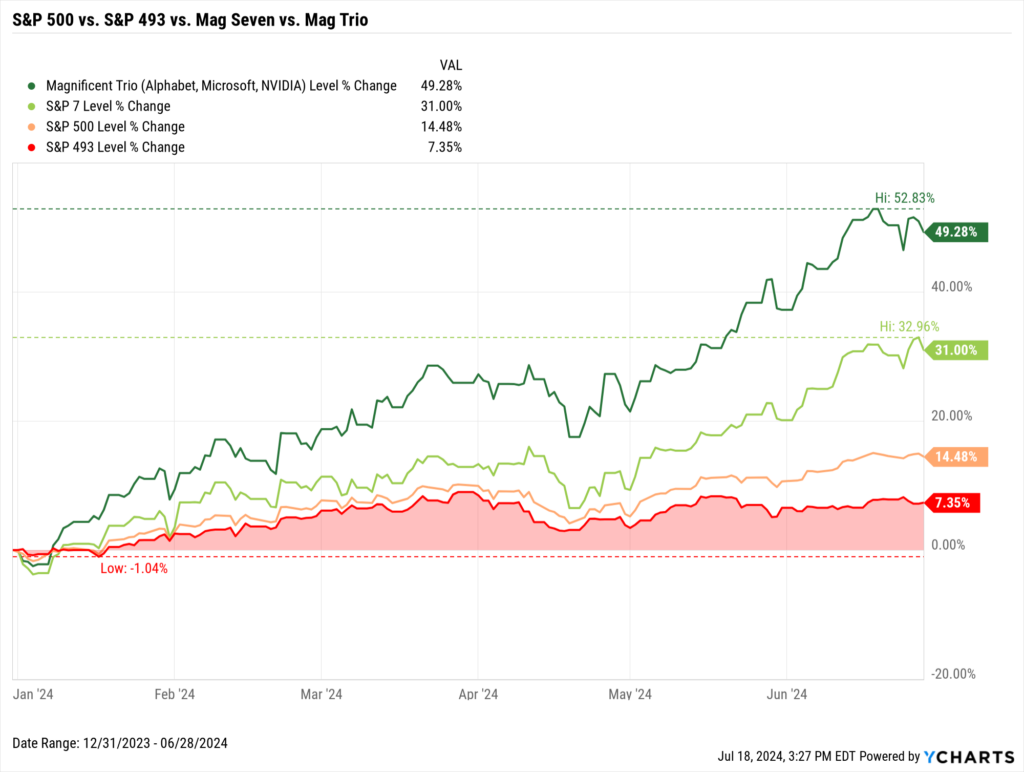
Six months into 2024, there’s been further market concentration as a “Magnificent Trio” of Alphabet (GOOGL), Microsoft (MSFT), and NVIDIA (NVDA) propelled markets higher. Emerging as standouts from the cohort of “Magnificent Seven” stocks, these three companies collectively outperformed both the broader S&P 500 and the group of Mag Seven stocks, underscoring the growing impact of these leading tech companies on overall market dynamics.
Download Visual | Modify in YCharts | Get in Touch to Access Chart
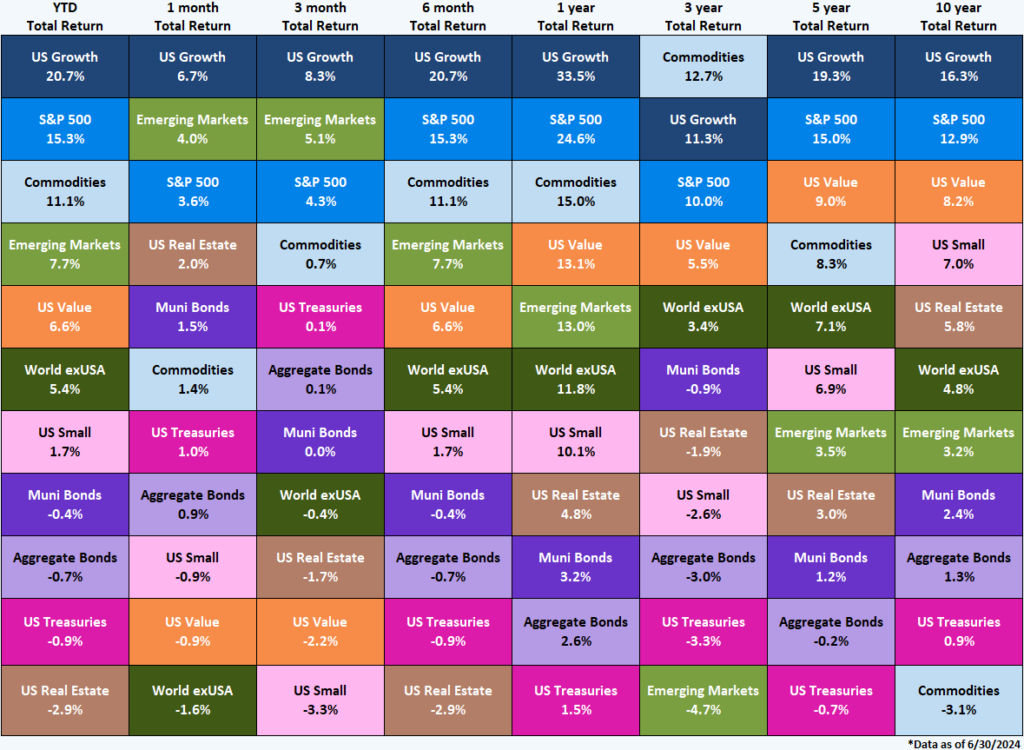
As it did in Q1, US Growth outperformed all other asset classes in Q2, advancing 8.3% in the quarter and 20.7% through the first six months of 2024. Emerging Markets, well, emerged in Q2, posting a 5.1% increase, while the S&P 500 trailed closely behind with a 4.3% return.
Download Visual | Contact Us to Access This Quilt
Existing Home Prices Surpass New Home Prices
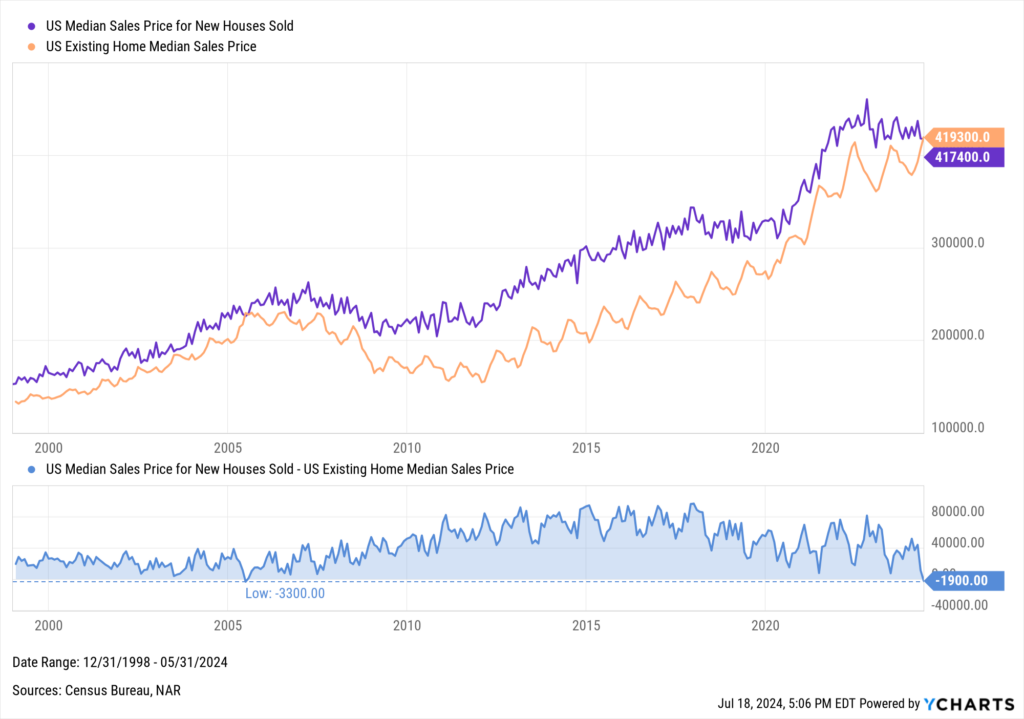
The “lock-in” effect in housing, one of the lingering consequences of the ZIRP era, has made current homeowners reluctant to buy new homes, thereby diminishing the supply of existing homes on the market. This scarcity could be one of the reasons that led to a rare occurrence in the housing market, where the median sales price for existing US homes exceeded that of new homes.
This phenomenon has only occurred once before, in June 2005, when existing home prices were $3,300 more expensive than new homes on a median basis.
Download Visual | Modify in YCharts
These higher price tags coincide with a period where the 30-year mortgage rate in the US significantly exceeds its 20-year average. This comes against the backdrop of the overall Federal Funds Rate remaining elevated at 5.5% due to the Fed’s ongoing battle against inflation.
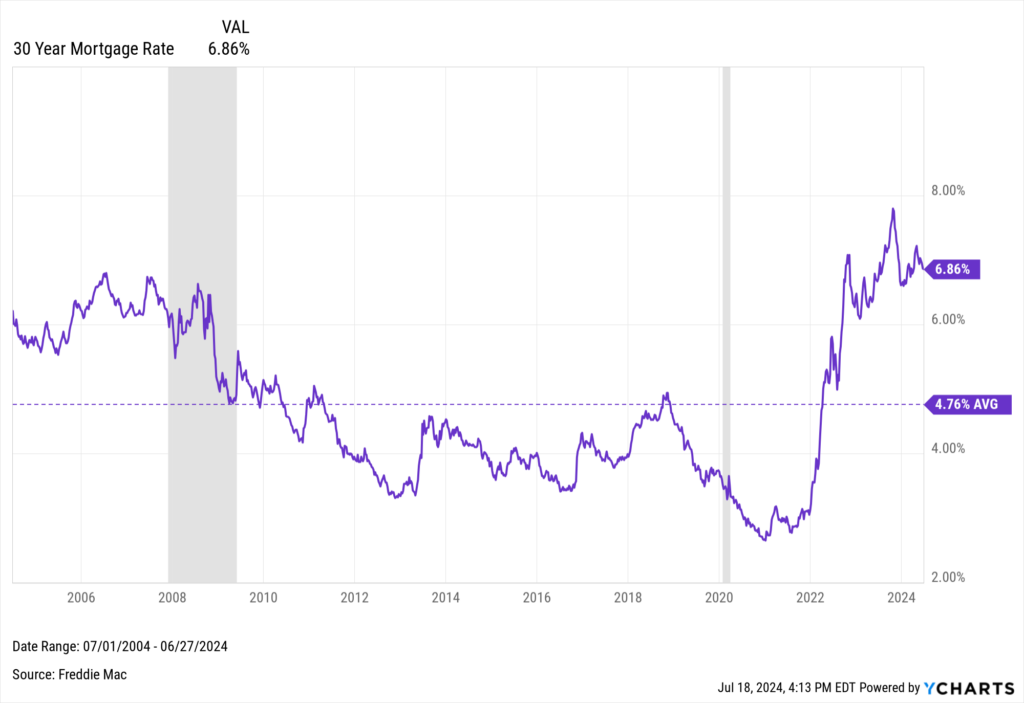
Download Visual | Modify in YCharts
With the US Consumer Price Index (CPI) coming in at just under 3% in June, and the Core Personal Consumption Expenditures (PCE) index falling to 2.6%—below the Federal Reserve’s June Summary of Economic Projections projection for the end of 2024—CME FedWatch indicates there’s a 94% probability of a Fed rate cut as early as September.
A more dovish Fed could not only lead to lower mortgage rates for home buyers but also lower the financing costs for construction, potentially spurring more building activity and increasing the overall housing supply. These potential economic shifts can heavily influence consumer sentiment and general vibes, which could be especially significant in a presidential election year.
Whenever you’re ready, there are 3 ways YCharts can help you:
1. Looking to better communicate the importance of economic events to clients?
Send us an email at hello@ycharts.com or call (866) 965-7552. You’ll be directly in touch with one of our Chicago-based team members.
2. Want to test out YCharts for free?
Start a no-risk 7-Day Free Trial.
3. Download a copy of the Quarterly Economic Update slide deck:
Download the Economic Summary Deck:Disclaimer
©2024 YCharts, Inc. All Rights Reserved. YCharts, Inc. (“YCharts”) is not registered with the U.S. Securities and Exchange Commission (or with the securities regulatory authority or body of any state or any other jurisdiction) as an investment adviser, broker-dealer or in any other capacity, and does not purport to provide investment advice or make investment recommendations. This report has been generated through application of the analytical tools and data provided through ycharts.com and is intended solely to assist you or your investment or other adviser(s) in conducting investment research. You should not construe this report as an offer to buy or sell, as a solicitation of an offer to buy or sell, or as a recommendation to buy, sell, hold or trade, any security or other financial instrument. For further information regarding your use of this report, please go to: ycharts.com/about/disclosure
Next Article
NEW on YCharts: Attribution AnalysisRead More →